Differential expression and enrichment workflow
Source:vignettes/differential-enrichment-workflow.Rmd
differential-enrichment-workflow.RmdThis article shows how to organize differential expression, marker
visualization, and pathway enrichment in scop. The main
distinction is between testing genes, summarizing gene sets, and
interpreting enriched biological terms.
Use this workflow after cell identities and major covariates are stable. Differential expression is gene-level evidence. Enrichment is a summary of a gene list or ranked statistic against a named database. Keep those two evidence layers separate in the text of a report.
Prepare the Object
library(scop)

data(pancreas_sub)
pancreas_sub <- RunStandardWorkflow(pancreas_sub, verbose = FALSE)
#> ℹ [2026-10-12 00:03:26] Skip `log1p()` because `layer = data` is not "counts"

table(pancreas_sub$CellType)
#>
#>        Ductal     Endocrine  Ngn3-high-EP   Ngn3-low-EP Pre-endocrine
#>           253           355           169            67           156
Run Differential Expression
RunDEtest() writes differential-expression tables under
srt@tools. The default single-cell marker workflow is
appropriate for exploratory marker finding. Use sample-aware or
pseudobulk methods when biological replicates are part of the
question.
pancreas_sub <- RunDEtest(
  pancreas_sub,
  group.by = "CellType",
  fc.threshold = 1,
  only.pos = FALSE
)
#> ℹ [2026-10-12 00:03:30] Data type is log-normalized
#> ℹ [2026-10-12 00:03:30] Start differential expression test
#> ℹ [2026-10-12 00:03:30] Find all markers(wilcox) among [1] 5 groups...
#> ℹ [2026-10-12 00:03:30] Using 1 core
#> For a (much!) faster implementation of the Wilcoxon Rank Sum Test,
#> (default method for FindMarkers) please install the presto package
#> --------------------------------------------
#> install.packages('devtools')
#> devtools::install_github('immunogenomics/presto')
#> --------------------------------------------
#> After installation of presto, Seurat will automatically use the more
#> efficient implementation (no further action necessary).
#> This message will be shown once per session
#> ⠙ [2026-10-12 00:03:30] Running for Ductal [1/5] ■■          20% | ETA:  2m
#> ⠹ [2026-10-12 00:03:30] Running for Ngn3-high-EP [2/5] ■■■■        40% | ETA:  …
#> ⠸ [2026-10-12 00:03:30] Running for Endocrine [3/5] ■■■■■■      60% | ETA: 47s
#> ⠼ [2026-10-12 00:03:30] Running for Ngn3-low-EP [4/5] ■■■■■■■■    80% | ETA: 24s
#> ✔ [2026-10-12 00:03:30] Completed 5 tasks in 1m 57.1s
#>
#> ℹ [2026-10-12 00:03:30] Building results
#> ✔ [2026-10-12 00:05:27] Differential expression test completed

names(pancreas_sub@tools)
#> [1] "DEtest_CellType"
head(pancreas_sub@tools$DEtest_CellType$AllMarkers_wilcox)
#>           p_val avg_log2FC pct.1 pct.2     p_val_adj          gene group1
#> 1 7.287773e-130   3.679046 0.897 0.096 5.597739e-126         Cyr61 Ductal
#> 2 1.168267e-127   3.217619 0.937 0.118 8.973461e-124       Adamts1 Ductal
#> 3 2.900413e-120   2.956891 0.976 0.173 2.227807e-116         Anxa2 Ductal
#> 4 8.561291e-113   2.733121 0.949 0.147 6.575927e-109 1700011H14Rik Ductal
#> 5 2.559824e-108   2.764483 0.960 0.229 1.966201e-104         Bicc1 Ductal
#> 6 1.495170e-103   2.646007 0.905 0.147  1.148440e-99         Gsta3 Ductal
#>   group2 test_group_number
#> 1 others                 5
#> 2 others                 5
#> 3 others                 5
#> 4 others                 5
#> 5 others                 5
#> 6 others                 5
#>                                                test_group
#> 1 Ductal;Ngn3-high-EP;Endocrine;Ngn3-low-EP;Pre-endocrine
#> 2 Ductal;Ngn3-high-EP;Endocrine;Ngn3-low-EP;Pre-endocrine
#> 3 Ductal;Ngn3-high-EP;Endocrine;Ngn3-low-EP;Pre-endocrine
#> 4 Ductal;Ngn3-high-EP;Endocrine;Ngn3-low-EP;Pre-endocrine
#> 5 Ductal;Ngn3-high-EP;Endocrine;Ngn3-low-EP;Pre-endocrine
#> 6 Ductal;Ngn3-high-EP;Endocrine;Ngn3-low-EP;Pre-endocrine
Keep the contrast, grouping column, test method, and threshold in the
report. Those choices define the meaning of each marker table. For
FindAllMarkers-style results, group1 names the
group being compared against the remaining cells unless a specific
contrast is stated.
Plot Differential Results
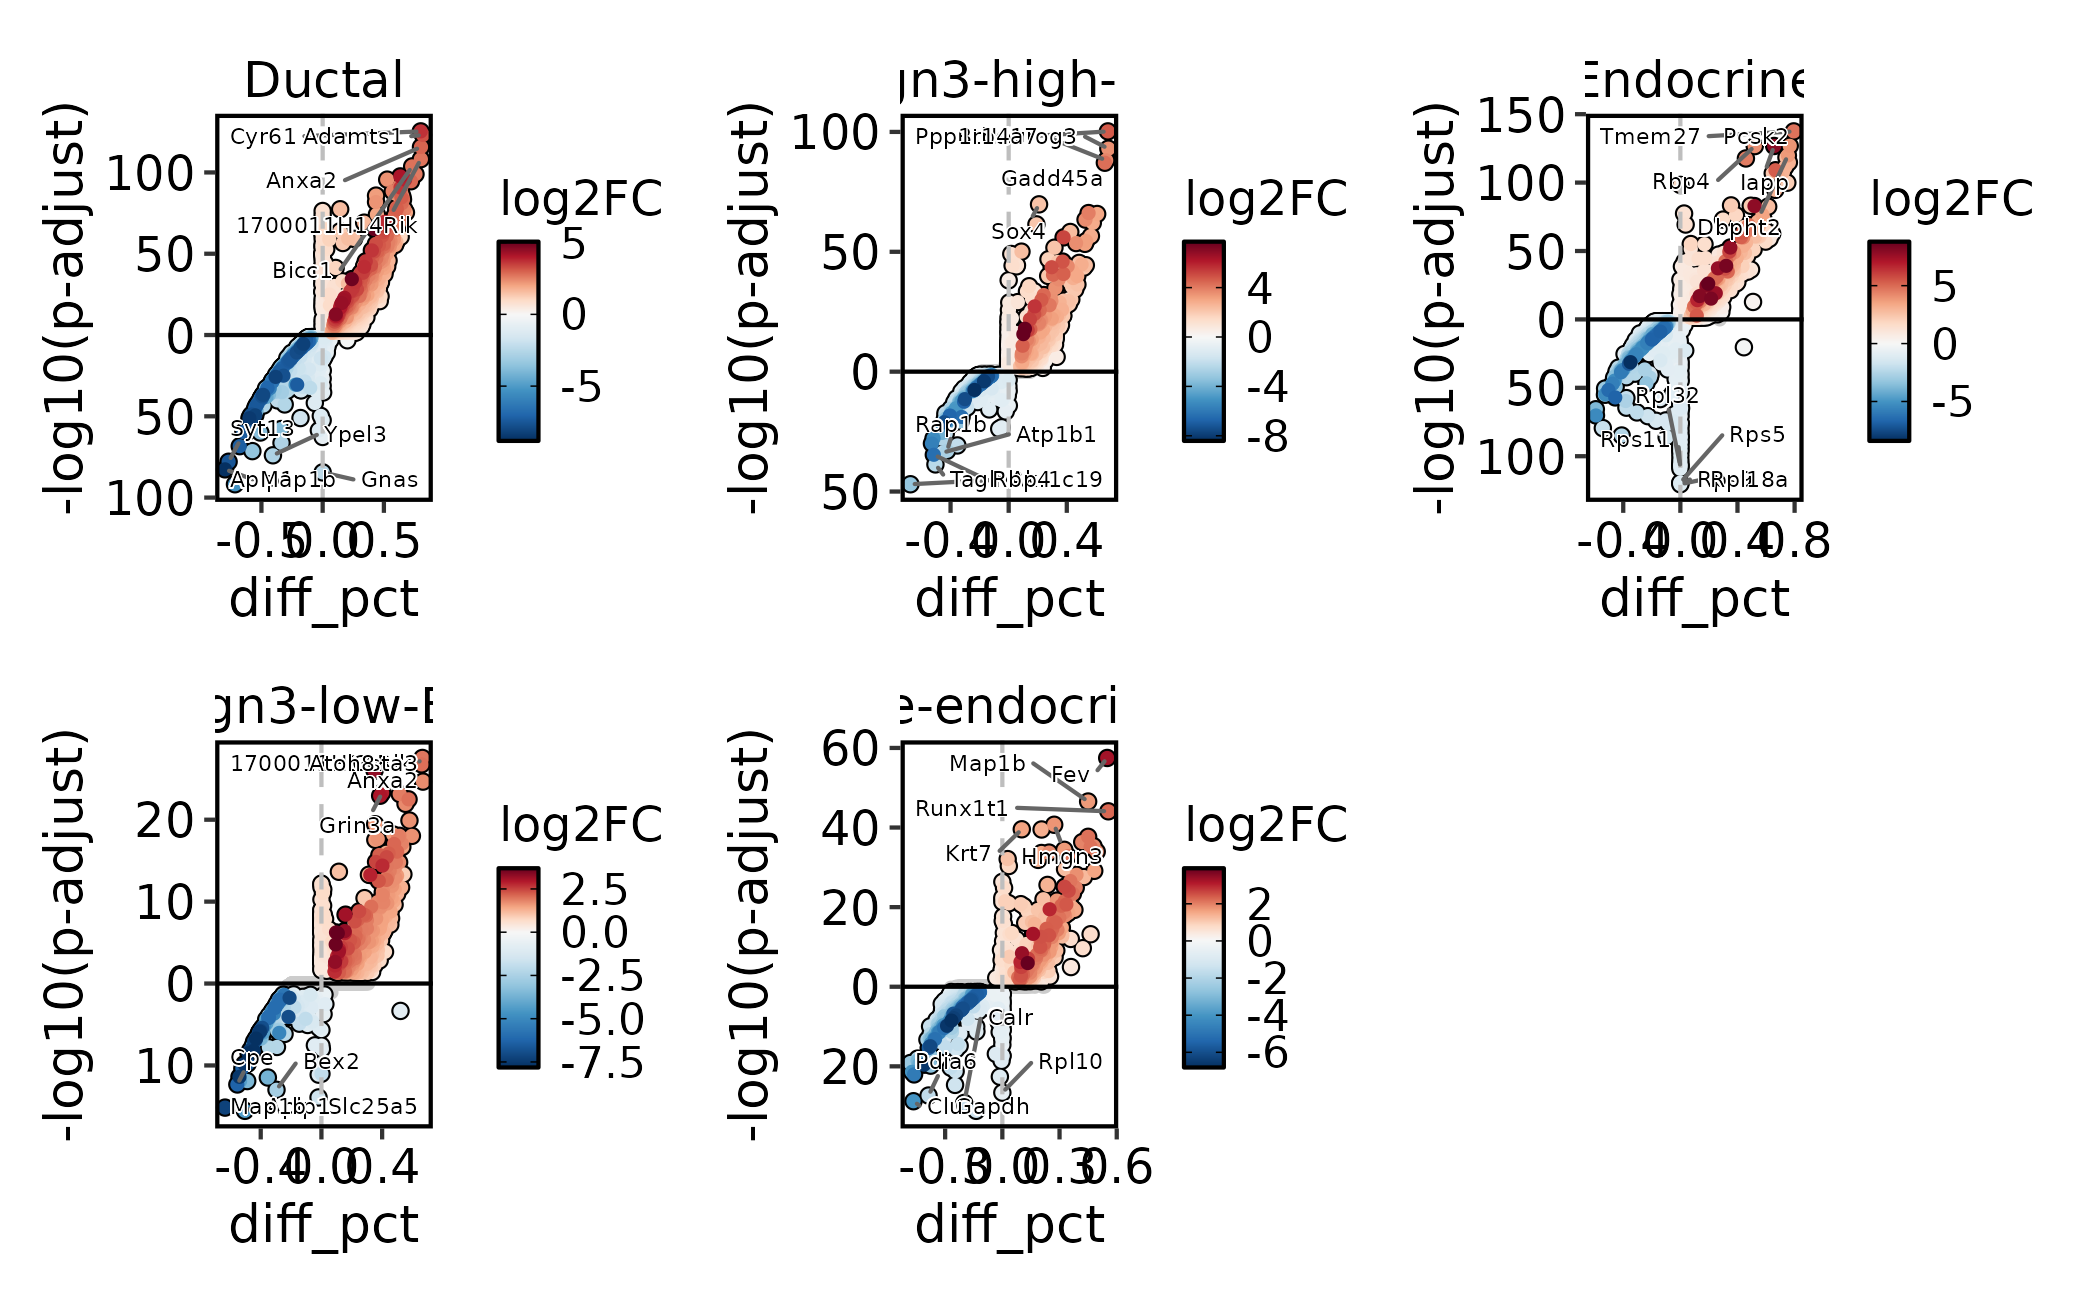
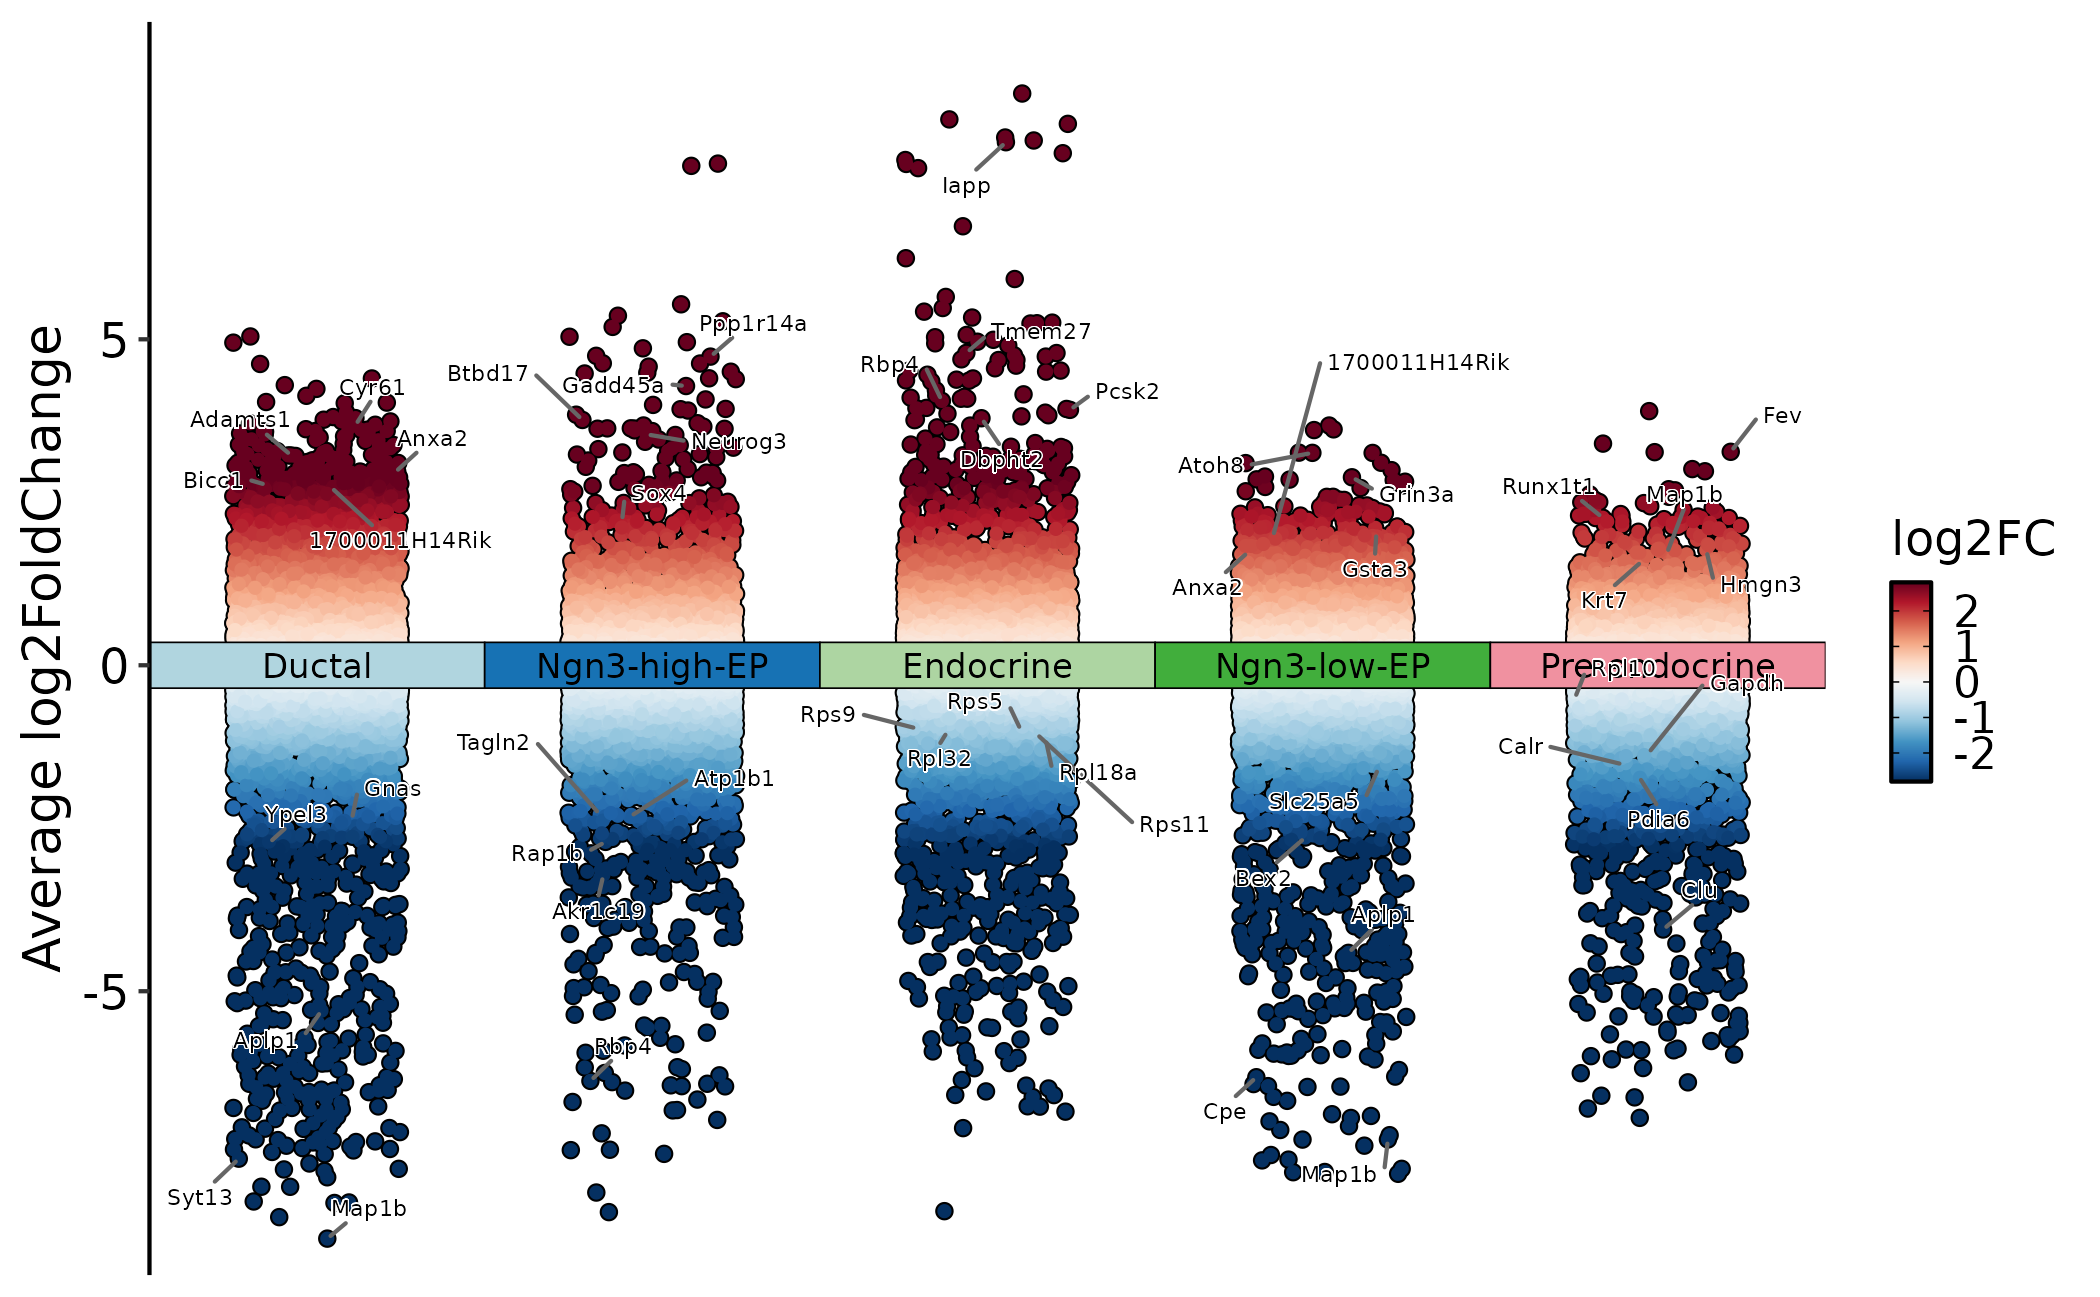
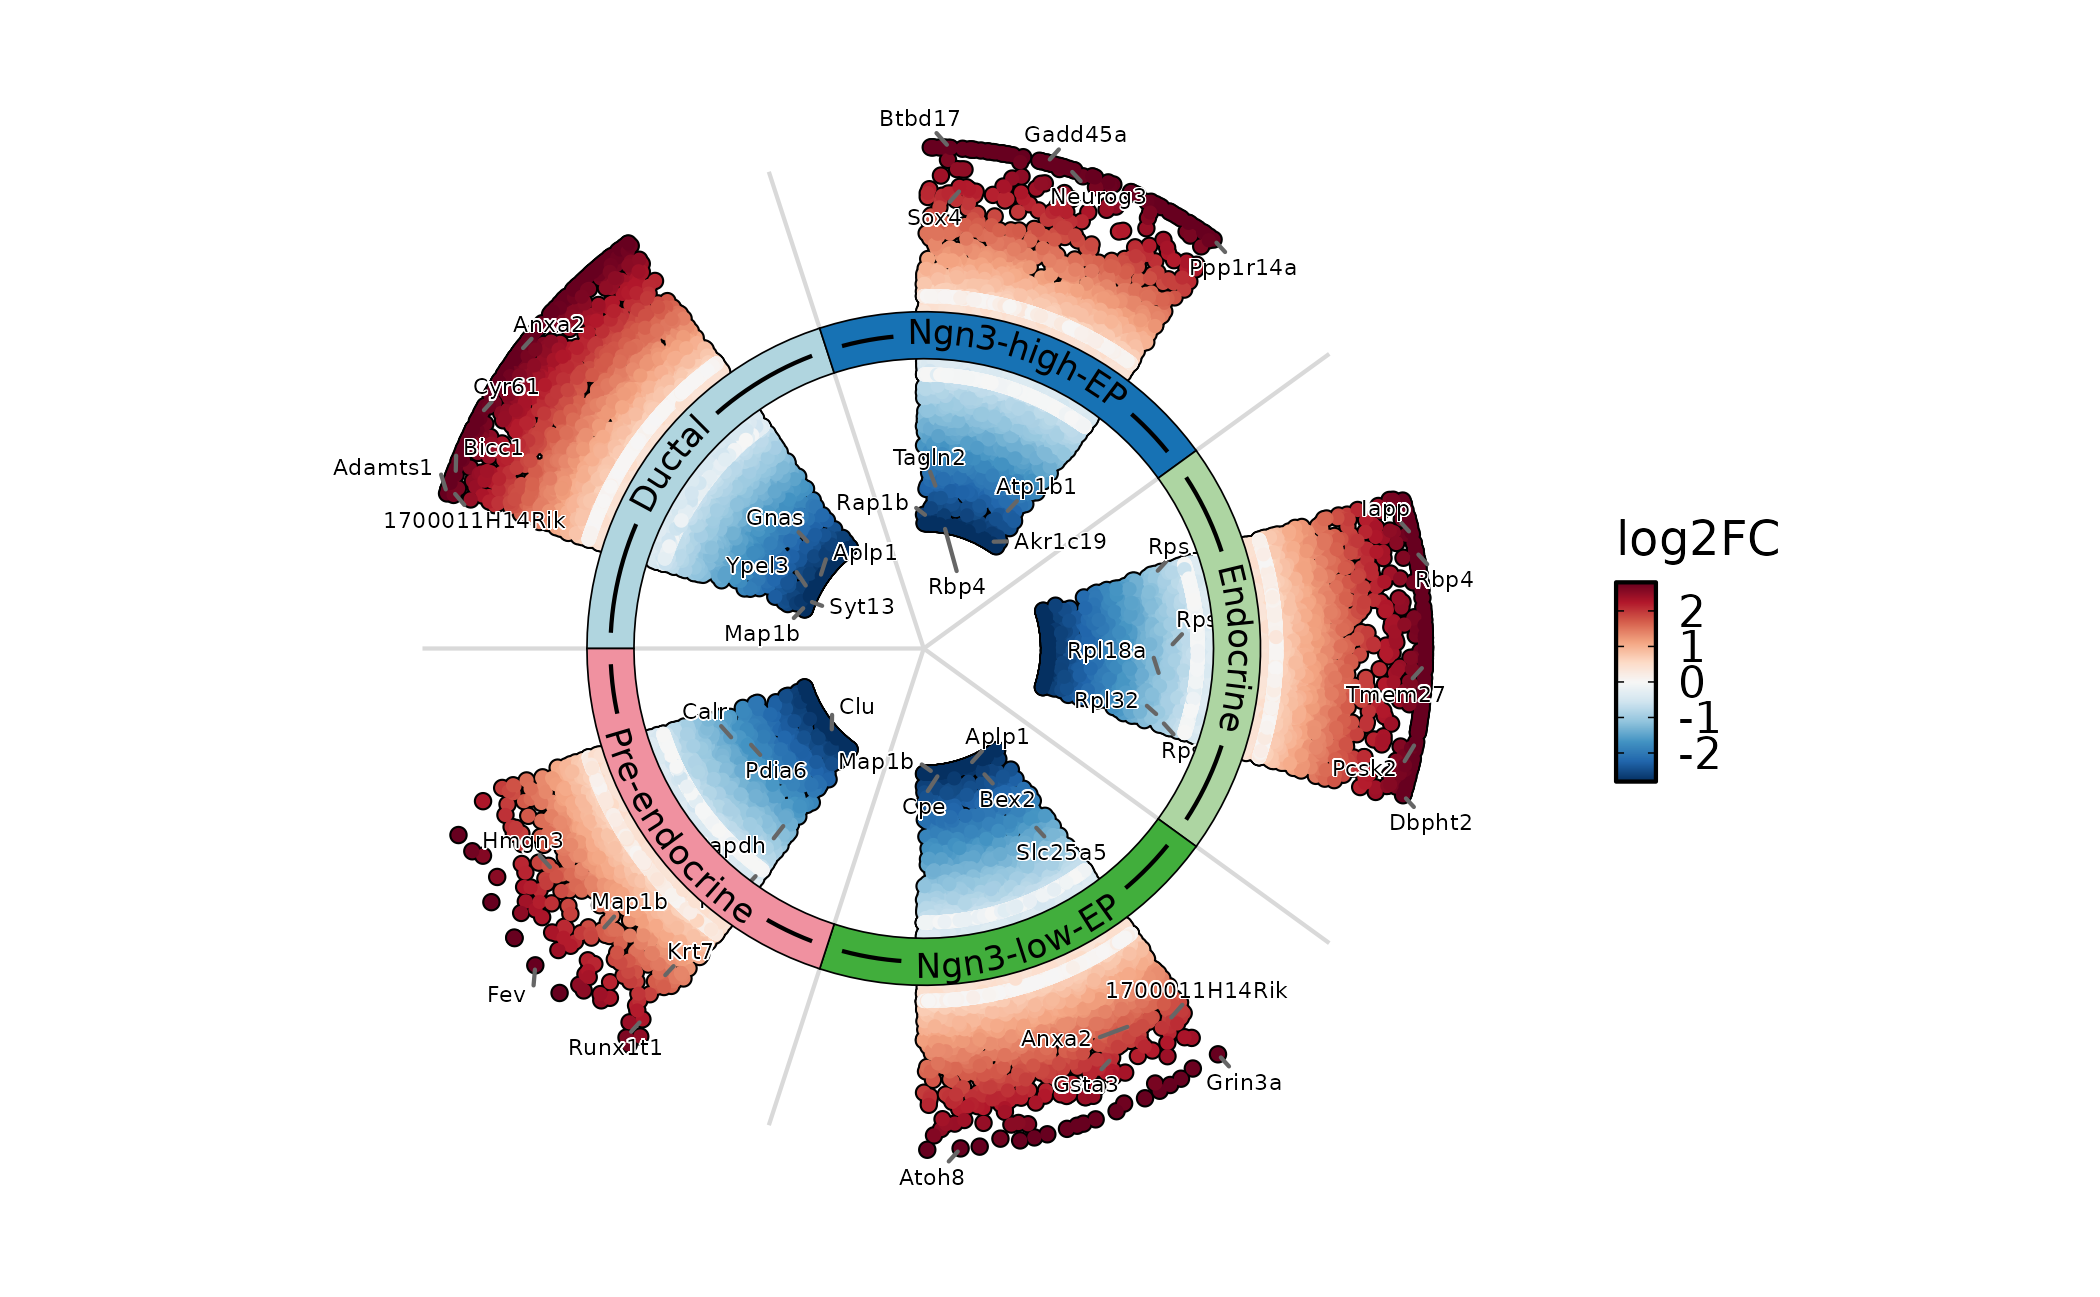
Use volcano, Manhattan, and ring views for different levels of detail. Volcano plots are useful for one group or contrast; Manhattan and ring plots are useful when scanning many groups.
DEtestPlot(
  pancreas_sub,
  group.by = "CellType",
  plot_type = "volcano",
  label.size = 2
)
DEtestPlot(
  pancreas_sub,
  group.by = "CellType",
  plot_type = "manhattan",
  label.size = 2
)
DEtestPlot(
  pancreas_sub,
  group.by = "CellType",
  plot_type = "ring",
  label.size = 2
)
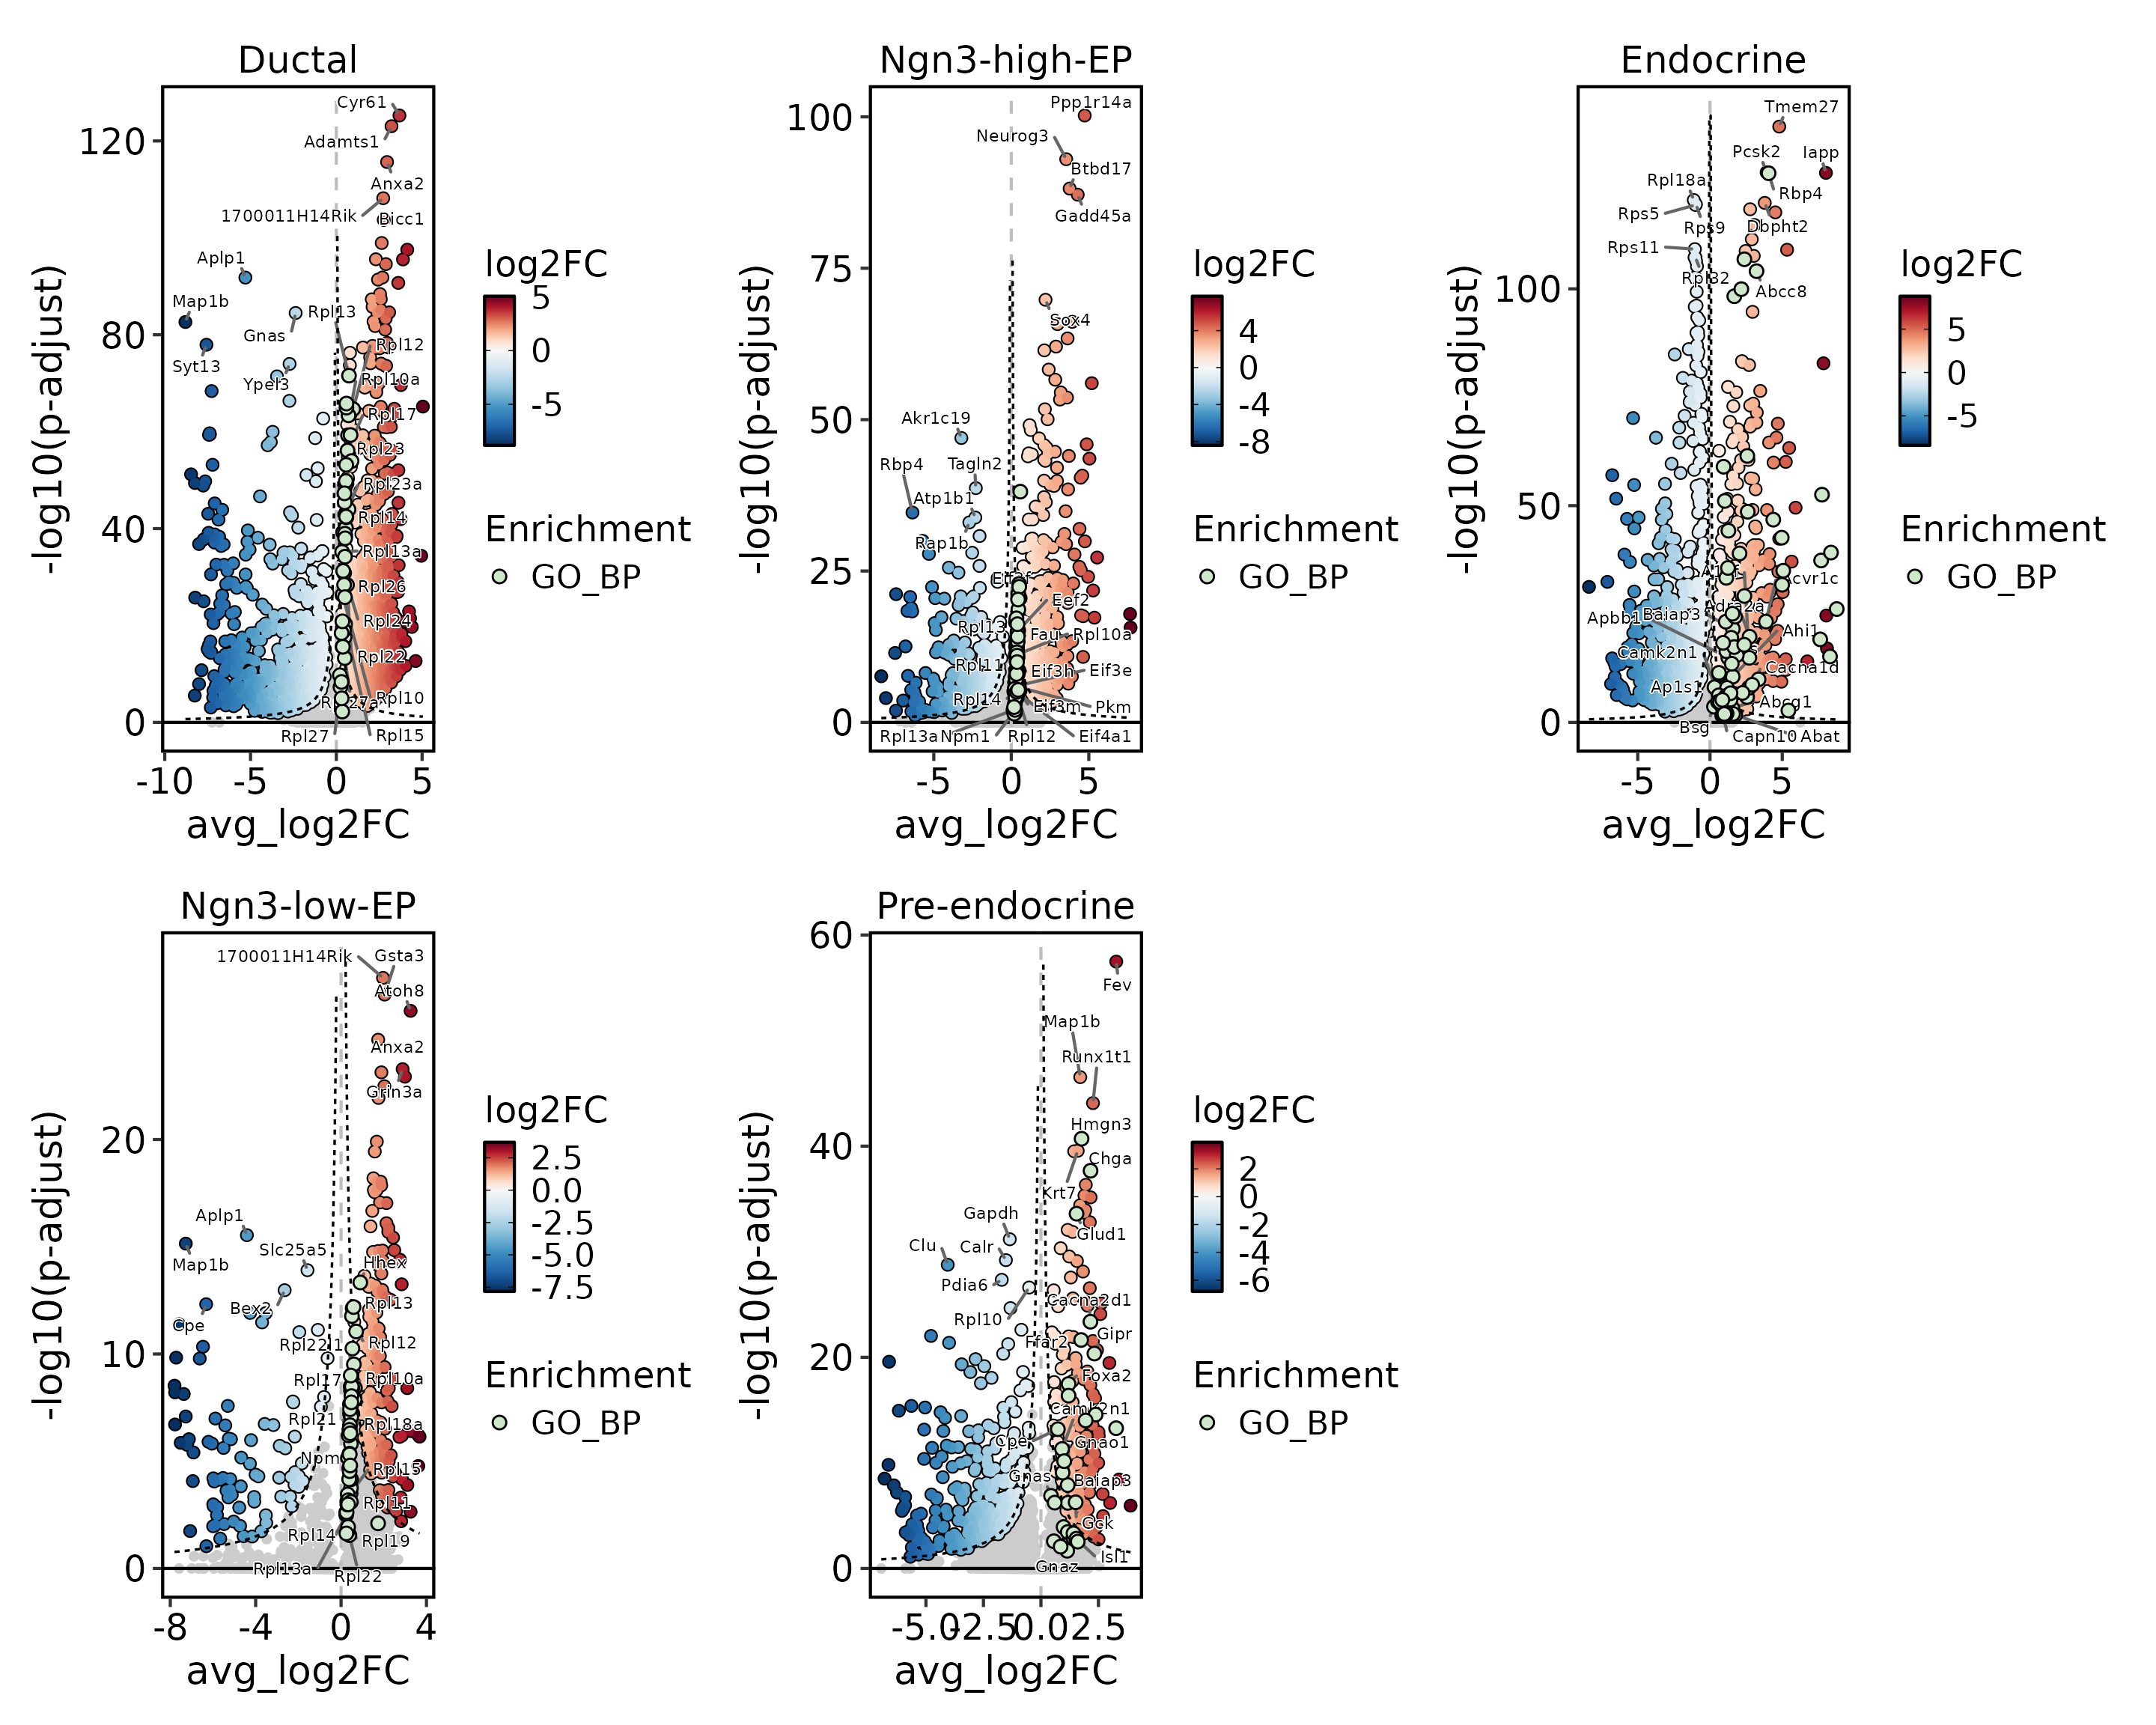
When enrichment results are available, volcano plots can annotate
enriched terms to connect marker genes with pathway-level
interpretation. The enrichment overlay circles genes that belong to
selected enriched terms. The legend title is the analysis layer
(Enrichment), and the legend item is the database, for
example GO_BP.
pancreas_sub <- RunEnrichment(
  pancreas_sub,
  group.by = "CellType",
  db = "GO_BP",
  species = "Mus_musculus"
)
#> ℹ [2026-10-12 00:05:48] Start Enrichment analysis
#> ℹ [2026-10-12 00:05:48] Species: "Mus_musculus"
#> ℹ [2026-10-12 00:05:48] Loading cached: GO_BP version: 3.23.0 nterm:14957 created: 2026-10-11 22:48:45
#> ℹ [2026-10-12 00:05:49] Permform enrichment...
#> ✔ [2026-10-12 00:05:54] Enrichment analysis done

DEtestPlot(
  pancreas_sub,
  group.by = "CellType",
  plot_type = "volcano",
  threshold_method = "hyperbolic",
  hyperbola_c = 6,
  annotate_enrichment = TRUE,
  enrich_from = "Enrichment",
  enrich_db = "GO_BP",
  enrich_top_terms = 3,
  enrich_nlabel = 15,
  label.size = 2
)
Summarize Markers in Heatmaps
Feature heatmaps are useful after markers have been filtered. Keep
the filter explicit and avoid showing very large marker sets without
grouping or splitting. TF marks transcription-factor
annotations and CSPA marks cell-surface protein
annotations. They help prioritize marker genes for follow-up, but they
do not change the DE statistics.
DEGs <- pancreas_sub@tools$DEtest_CellType$AllMarkers_wilcox
DEGs <- DEGs[with(DEGs, avg_log2FC > 1 & p_val_adj < 0.05), ]

pancreas_sub <- AnnotateFeatures(
  pancreas_sub,
  species = "Mus_musculus",
  db = c("TF", "CSPA")
)
#> ℹ [2026-10-12 00:06:02] Species: "Mus_musculus"
#> ℹ [2026-10-12 00:06:02] Loading cached: TF version: AnimalTFDB4 nterm:2 created: 2026-10-11 22:20:48
#> ℹ [2026-10-12 00:06:02] Species: "Mus_musculus"
#> ℹ [2026-10-12 00:06:02] Loading cached: CSPA version: CSPA nterm:1 created: 2026-10-11 22:46:56

ht <- FeatureHeatmap(
  pancreas_sub,
  group.by = "CellType",
  features = DEGs$gene,
  feature_split = DEGs$group1,
  exp_legend_title = "Z-score",
  species = "Mus_musculus",
  db = "GO_BP",
  anno_terms = TRUE,
  feature_annotation = c("TF", "CSPA")
)
#> ℹ [2026-10-12 00:06:04] Start Enrichment analysis
#> ℹ [2026-10-12 00:06:04] Species: "Mus_musculus"
#> ℹ [2026-10-12 00:06:04] Loading cached: GO_BP version: 3.23.0 nterm:14957 created: 2026-10-11 22:48:45
#> ℹ [2026-10-12 00:06:05] Permform enrichment...
#> ✔ [2026-10-12 00:06:09] Enrichment analysis done
#> `use_raster` is automatically set to TRUE for a matrix with more than
#> 2000 rows. You can control `use_raster` argument by explicitly setting
#> TRUE/FALSE to it.
#>
#> Set `ht_opt$message = FALSE` to turn off this message.
#> ℹ [2026-10-12 00:06:09] The size of the heatmap is fixed because certain elements are not scalable.
#> ℹ [2026-10-12 00:06:09] The width and height of the heatmap are determined by the size of the current viewport.
#> ℹ [2026-10-12 00:06:09] If you want to have more control over the size, you can manually set the parameters 'width' and 'height'.
print(ht$plot)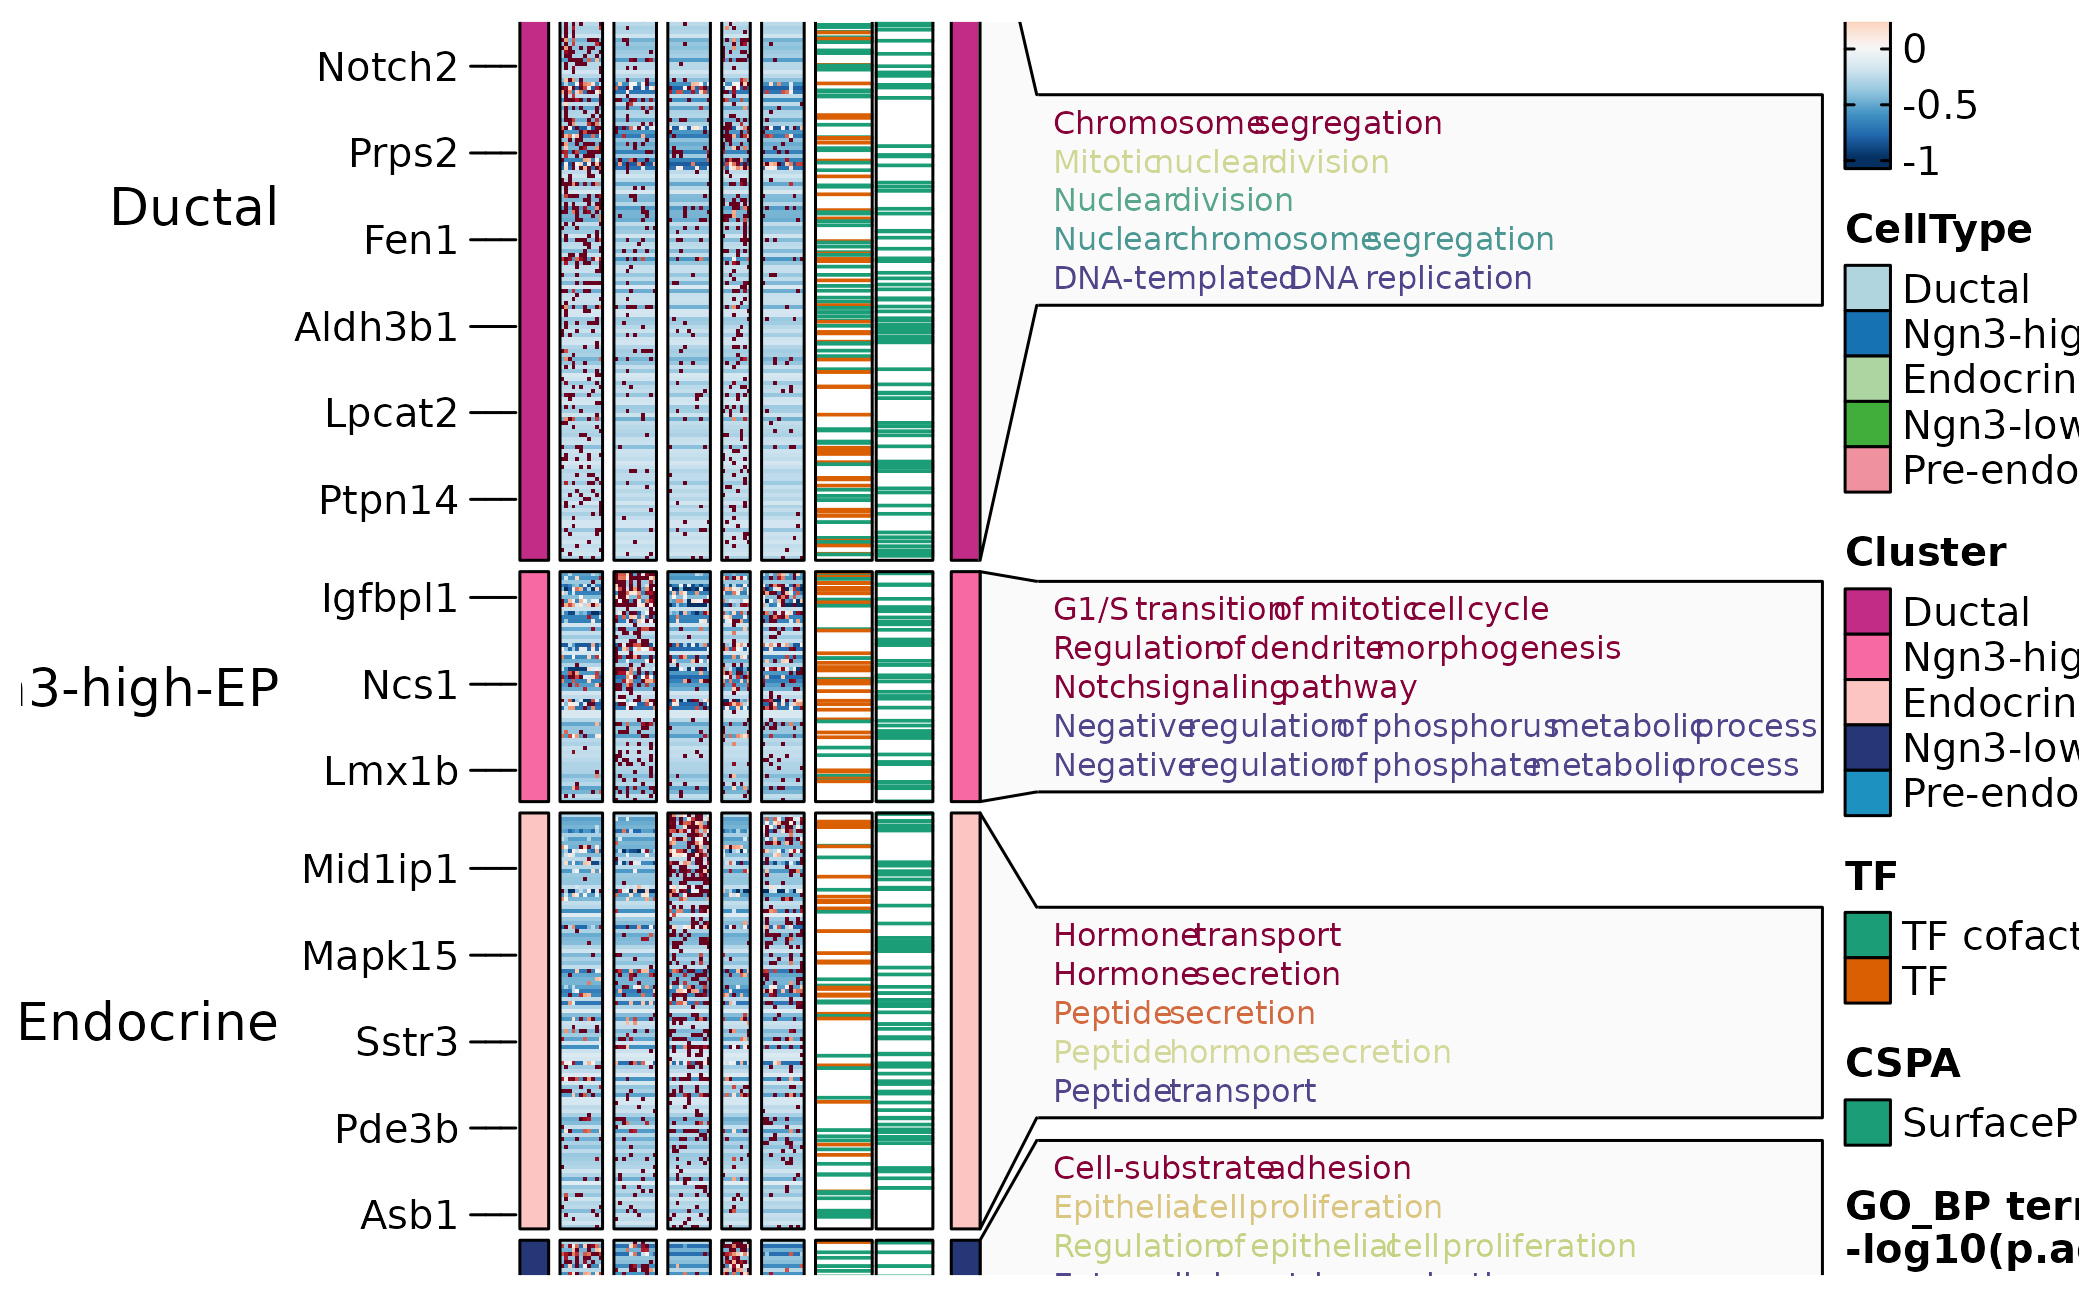
Run Over-Representation Analysis
RunEnrichment() tests whether filtered marker sets are
enriched for terms from the selected database. GO_BP is
Gene Ontology Biological Process. The specific enriched terms are the
rows shown by EnrichmentPlot().
pancreas_sub <- RunEnrichment(
  pancreas_sub,
  group.by = "CellType",
  db = "GO_BP",
  species = "Mus_musculus",
  DE_threshold = "avg_log2FC > log2(1.5) & p_val_adj < 0.05"
)
#> ℹ [2026-10-12 00:06:21] Start Enrichment analysis
#> ℹ [2026-10-12 00:06:21] Species: "Mus_musculus"
#> ℹ [2026-10-12 00:06:21] Loading cached: GO_BP version: 3.23.0 nterm:14957 created: 2026-10-11 22:48:45
#> ℹ [2026-10-12 00:06:22] Permform enrichment...
#> ✔ [2026-10-12 00:06:27] Enrichment analysis done

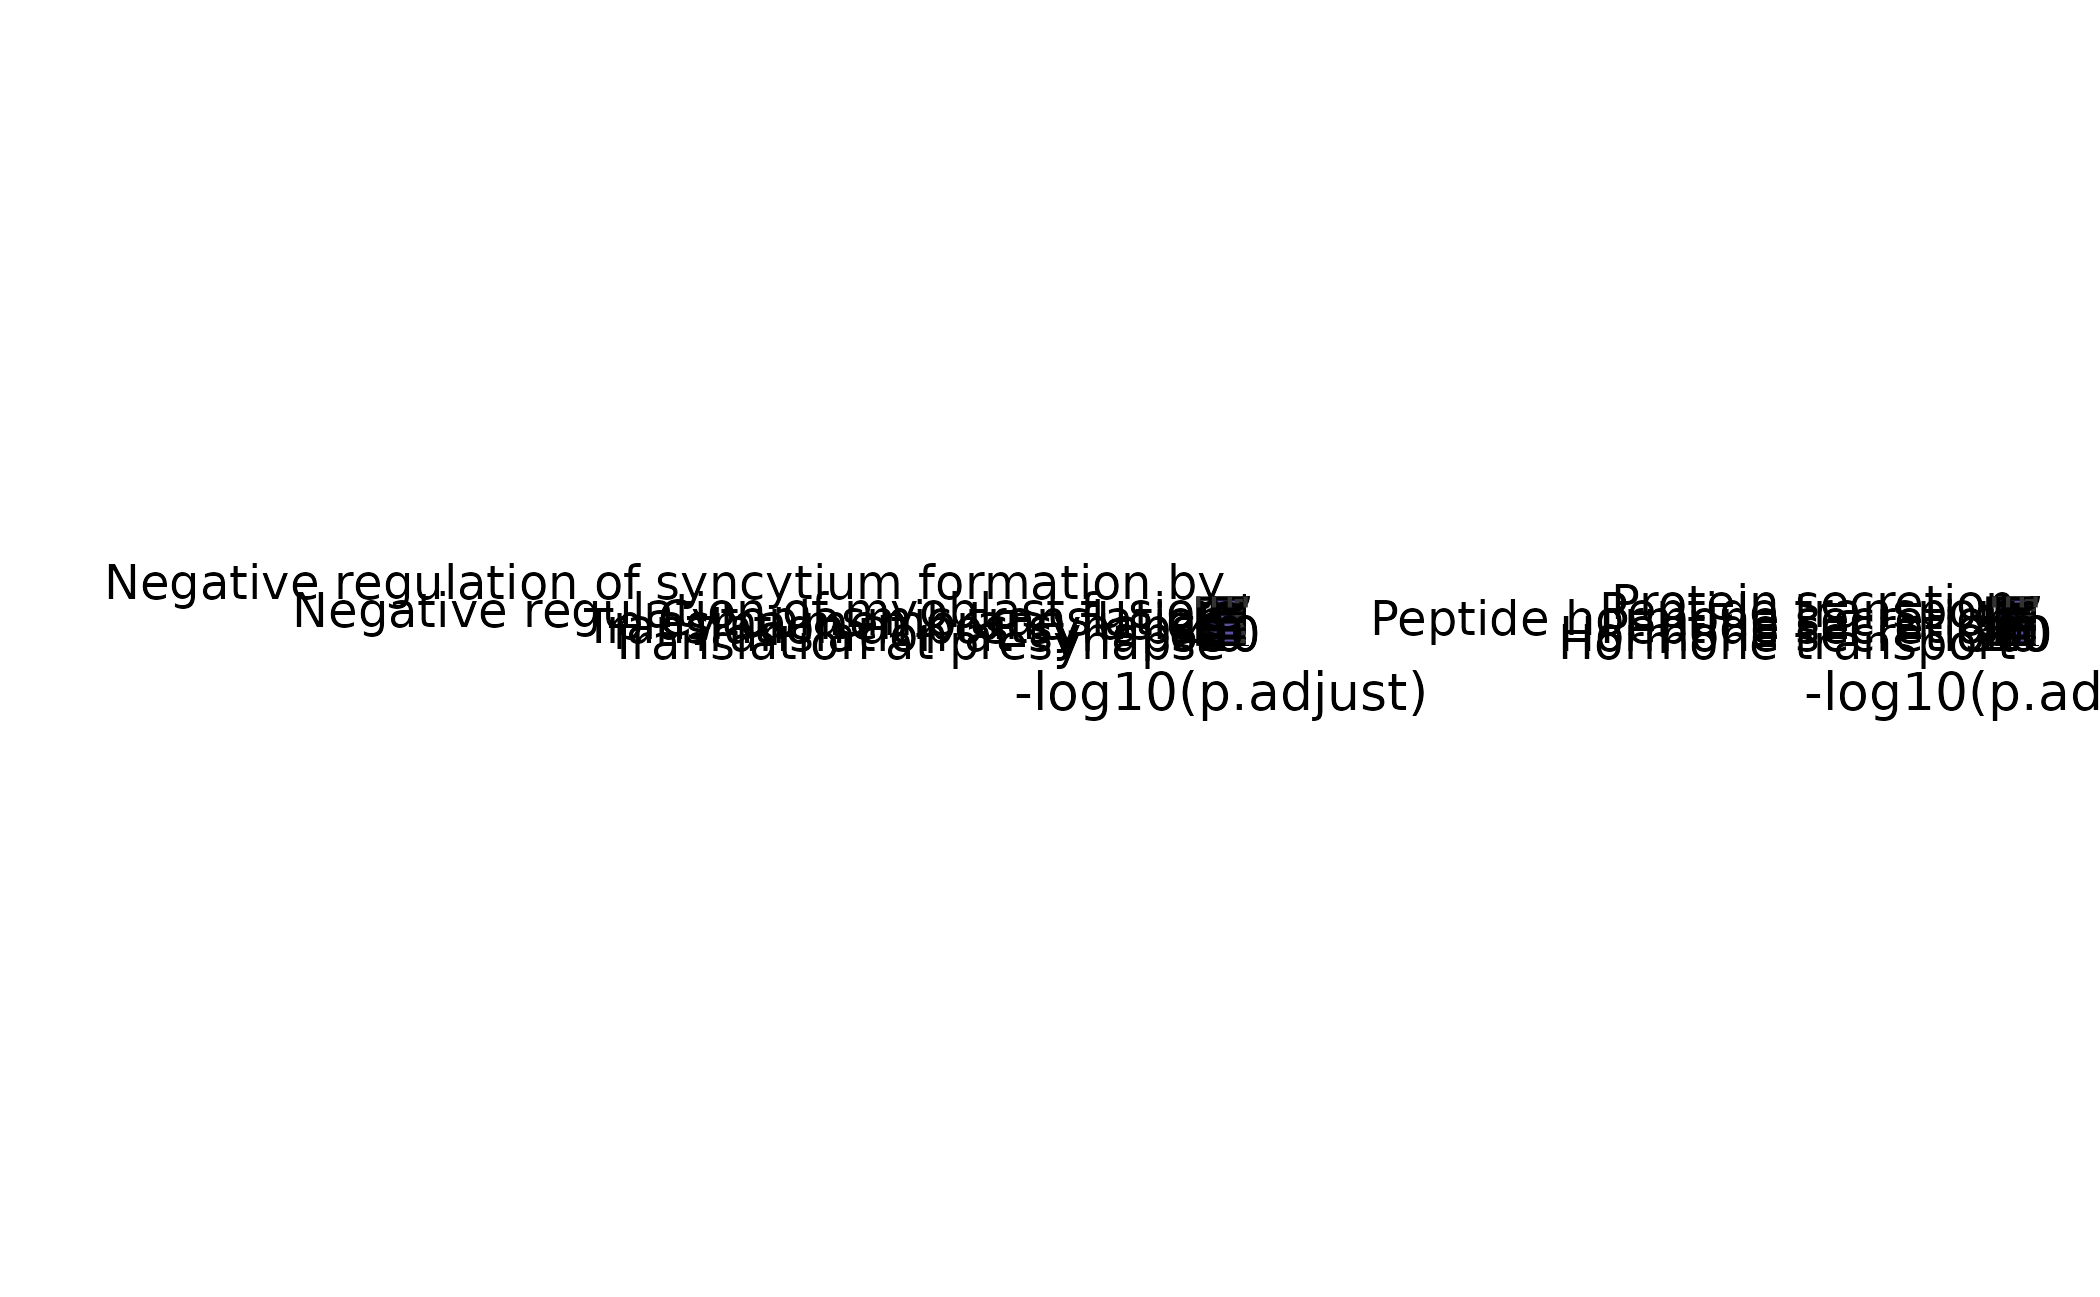
EnrichmentPlot(
  pancreas_sub,
  group.by = "CellType",
  group_use = c("Ductal", "Endocrine"),
  plot_type = "bar"
)
Use different plot types for different questions: bar or lollipop plots for ranked terms, word clouds for broad themes, and networks or enrichmaps for term relationships.
EnrichmentPlot(
  pancreas_sub,
  group.by = "CellType",
  group_use = "Ngn3-low-EP",
  plot_type = "network"
)
#> Found more than one class "dist" in cache; using the first, from namespace 'BiocGenerics'
#> Also defined by 'spam'
#> Found more than one class "dist" in cache; using the first, from namespace 'BiocGenerics'
#> Also defined by 'spam'
#> ✔ [2026-10-12 00:06:28] shadowtext installed successfully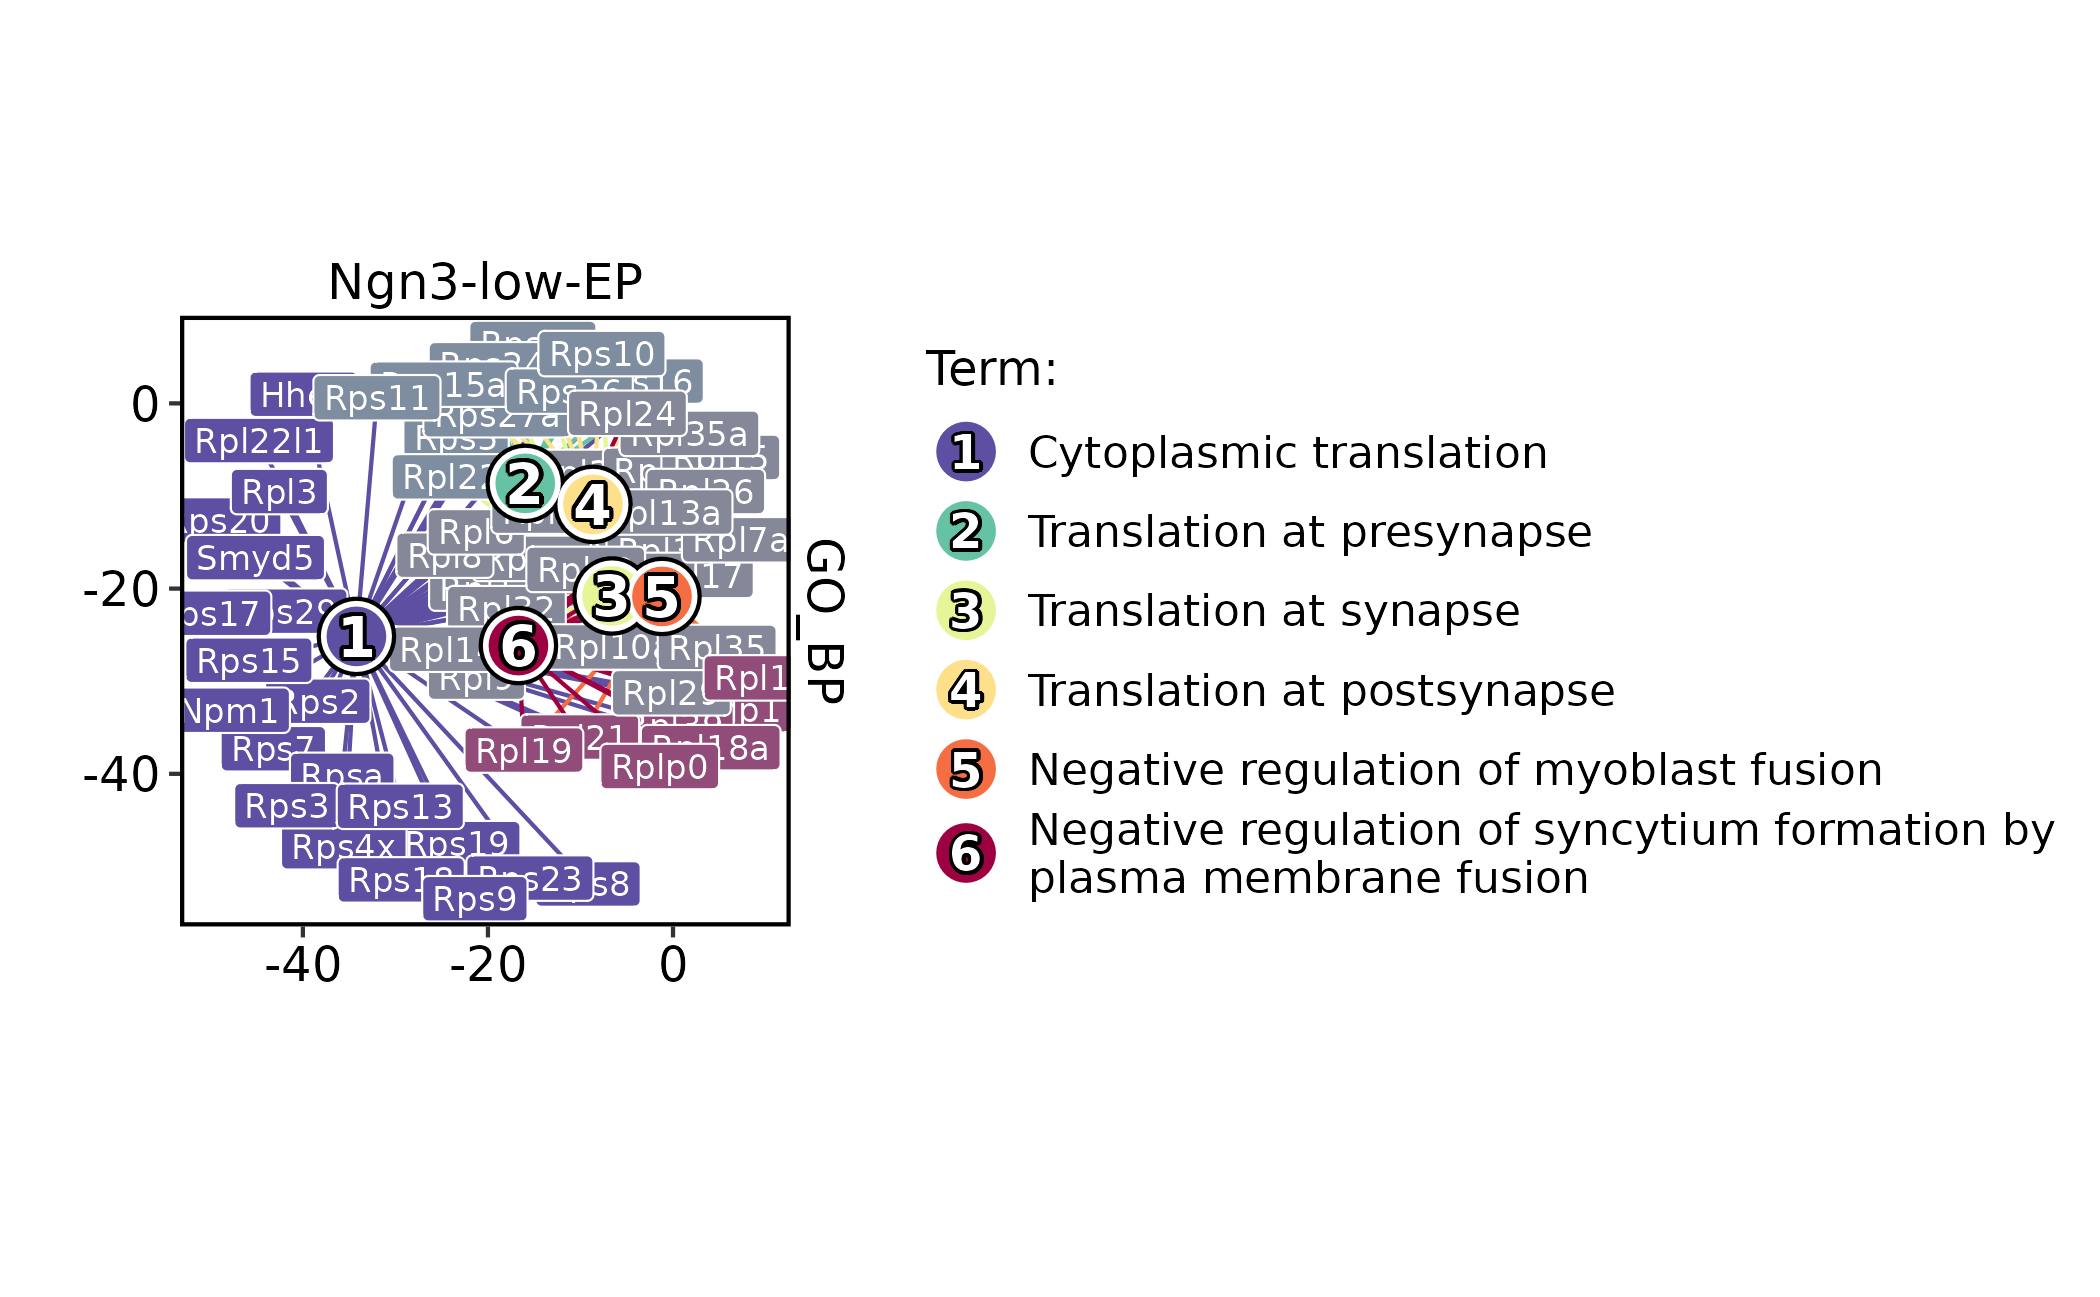
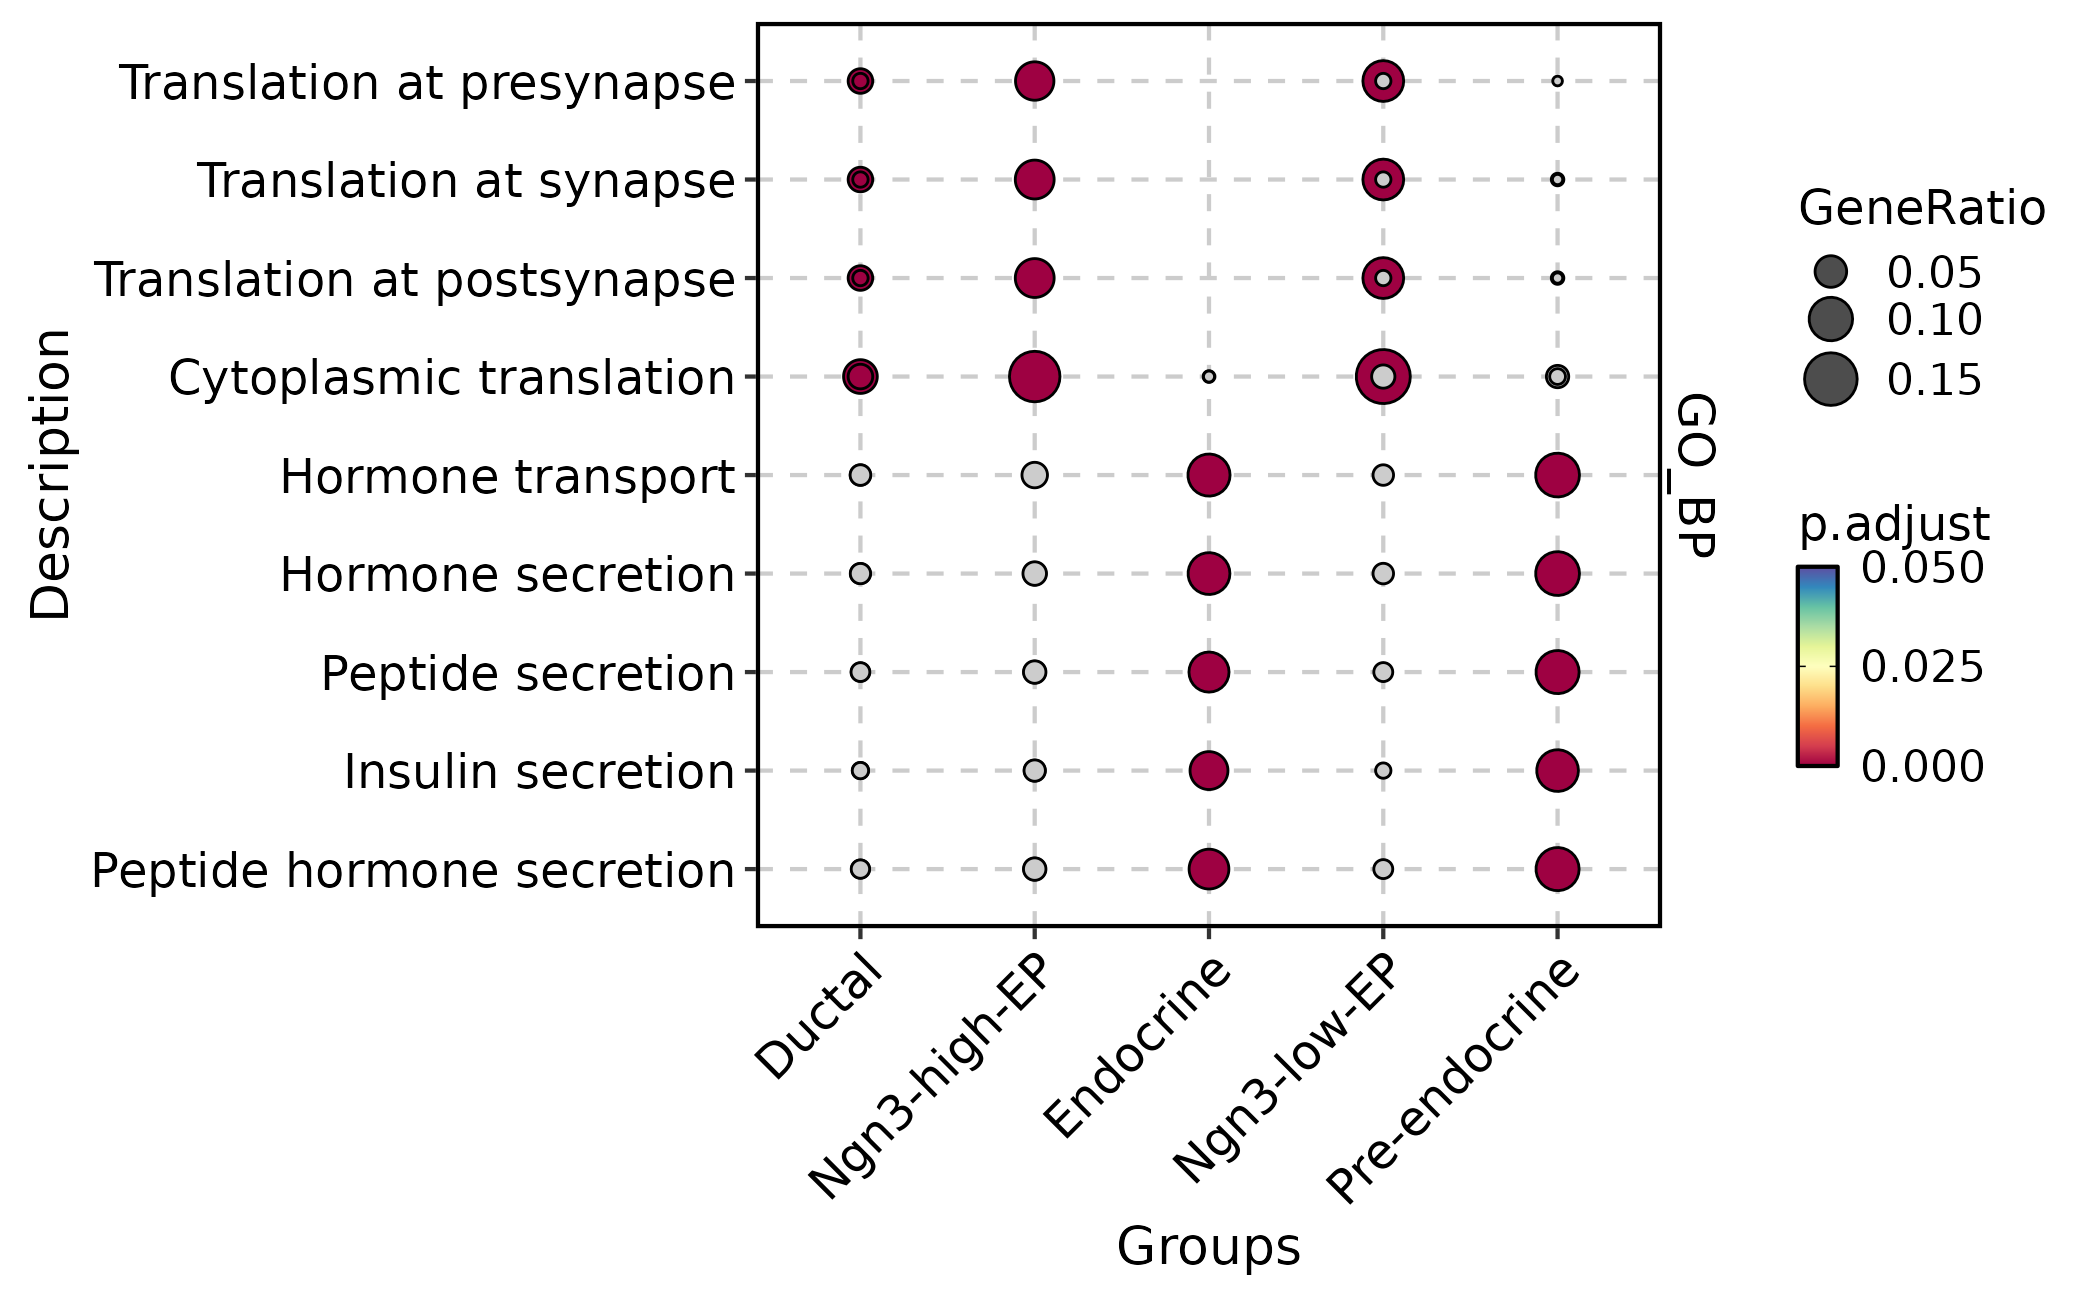
EnrichmentPlot(
  pancreas_sub,
  group.by = "CellType",
  plot_type = "comparison",
  topTerm = 3
)
Run GSEA
Use GSEA when ranked gene statistics are more appropriate than a hard marker cutoff. ORA depends on a marker cutoff, while GSEA uses a ranked gene list. Use GSEA when many genes shift modestly and a binary marker threshold would discard useful signal.
pancreas_sub <- RunGSEA(
  pancreas_sub,
  group.by = "CellType",
  db = "GO_BP",
  species = "Mus_musculus",
  DE_threshold = "p_val_adj < 0.05"
)

gsea_endocrine <- subset(
  pancreas_sub@tools$GSEA_CellType_wilcox$enrichment,
  Groups == "Endocrine" & Database == "GO_BP"
)
gsea_id <- gsea_endocrine$ID[which.min(gsea_endocrine$p.adjust)]

GSEAPlot(
  pancreas_sub,
  group.by = "CellType",
  group_use = "Endocrine",
  id_use = gsea_id
)

GSEAPlot(
  pancreas_sub,
  group.by = "CellType",
  group_use = "Endocrine",
  plot_type = "bar",
  direction = "both",
  topTerm = 10
)
What to Report
A compact differential and enrichment report should include:
- the grouping column, contrast, and DE method;
- whether the test is single-cell marker detection, sample-level pseudobulk, or bulk-style differential testing;
- thresholds for log fold change, adjusted p value, and marker filtering;
- the gene-set database, species, and enrichment method;
- the exact
srt@toolsresult names used for downstream plots; - pathway interpretations separated from the gene-level DE evidence.
Use enrichment to summarize marker lists or ranked statistics. Do not treat an enriched term as proof that every gene in the pathway changes coherently.