This function generates various types of plots for Gene Set Enrichment Analysis (GSEA) results.
Usage
GSEAPlot(
  srt,
  db = "GO_BP",
  group.by = NULL,
  test.use = "wilcox",
  res = NULL,
  plot_type = c("line", "bar", "network", "enrichmap", "wordcloud", "comparison"),
  group_use = NULL,
  id_use = NULL,
  pvalueCutoff = NULL,
  padjustCutoff = 0.05,
  topTerm = ifelse(plot_type == "enrichmap", 100, 6),
  direction = c("pos", "neg", "both"),
  compare_only_sig = FALSE,
  topWord = 100,
  word_type = c("term", "feature"),
  word_size = c(2, 8),
  words_excluded = NULL,
  line_width = 1.5,
  line_alpha = 1,
  line_color = "#6BB82D",
  n_coregene = 10,
  sample_coregene = FALSE,
  features_label = NULL,
  label.fg = "black",
  label.bg = "white",
  label.bg.r = 0.1,
  label.size = 4,
  network_layout = "fr",
  network_labelsize = 5,
  network_blendmode = "blend",
  network_layoutadjust = TRUE,
  network_adjscale = 60,
  network_adjiter = 100,
  enrichmap_layout = "fr",
  enrichmap_cluster = "fast_greedy",
  enrichmap_label = c("term", "feature"),
  enrichmap_labelsize = 5,
  enrlichmap_nlabel = 4,
  enrichmap_show_keyword = FALSE,
  enrichmap_mark = c("ellipse", "hull"),
  enrichmap_expand = c(0.5, 0.5),
  character_width = 50,
  lineheight = 0.7,
  palette = "Spectral",
  palcolor = NULL,
  aspect.ratio = NULL,
  legend.position = "right",
  legend.direction = "vertical",
  theme_use = "theme_scop",
  theme_args = list(),
  combine = TRUE,
  nrow = NULL,
  ncol = NULL,
  byrow = TRUE,
  seed = 11,
  verbose = TRUE
)
Arguments
- srt
A
Seuratobject containing the results of RunDEtest and RunGSEA. If specified, GSEA results will be extracted from the Seurat object automatically. If not specified, theresarguments must be provided.- db
The database to use for enrichment plot. Default is
"GO_BP".- group.by
A character vector specifying the grouping variable in the
Seuratobject. This argument is only used ifsrtis specified.- test.use
A character vector specifying the test to be used in differential expression analysis. This argument is only used if
srtis specified.- res
Enrichment results generated by RunGSEA function. If provided, 'srt', 'test.use' and 'group.by' are ignored.
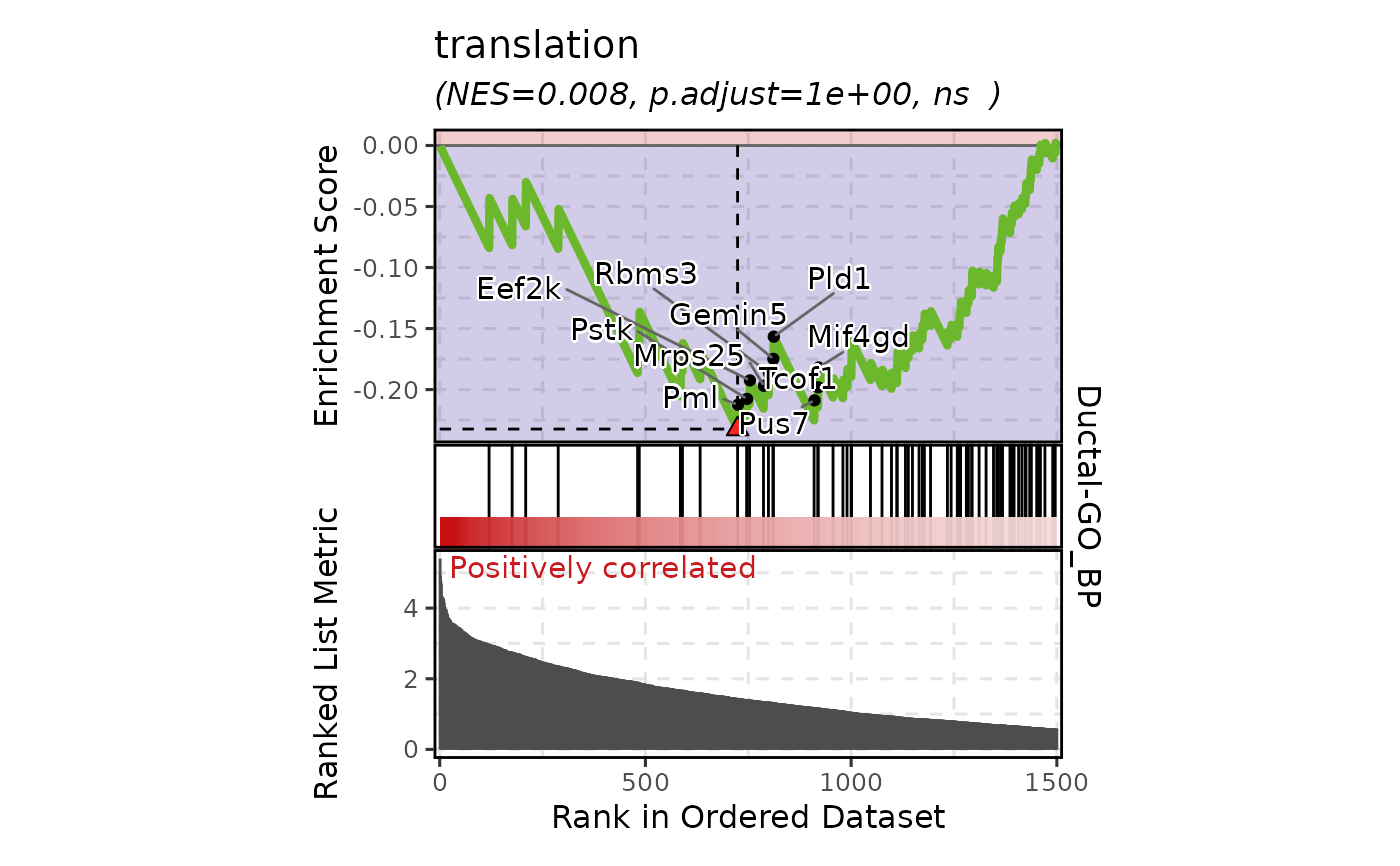
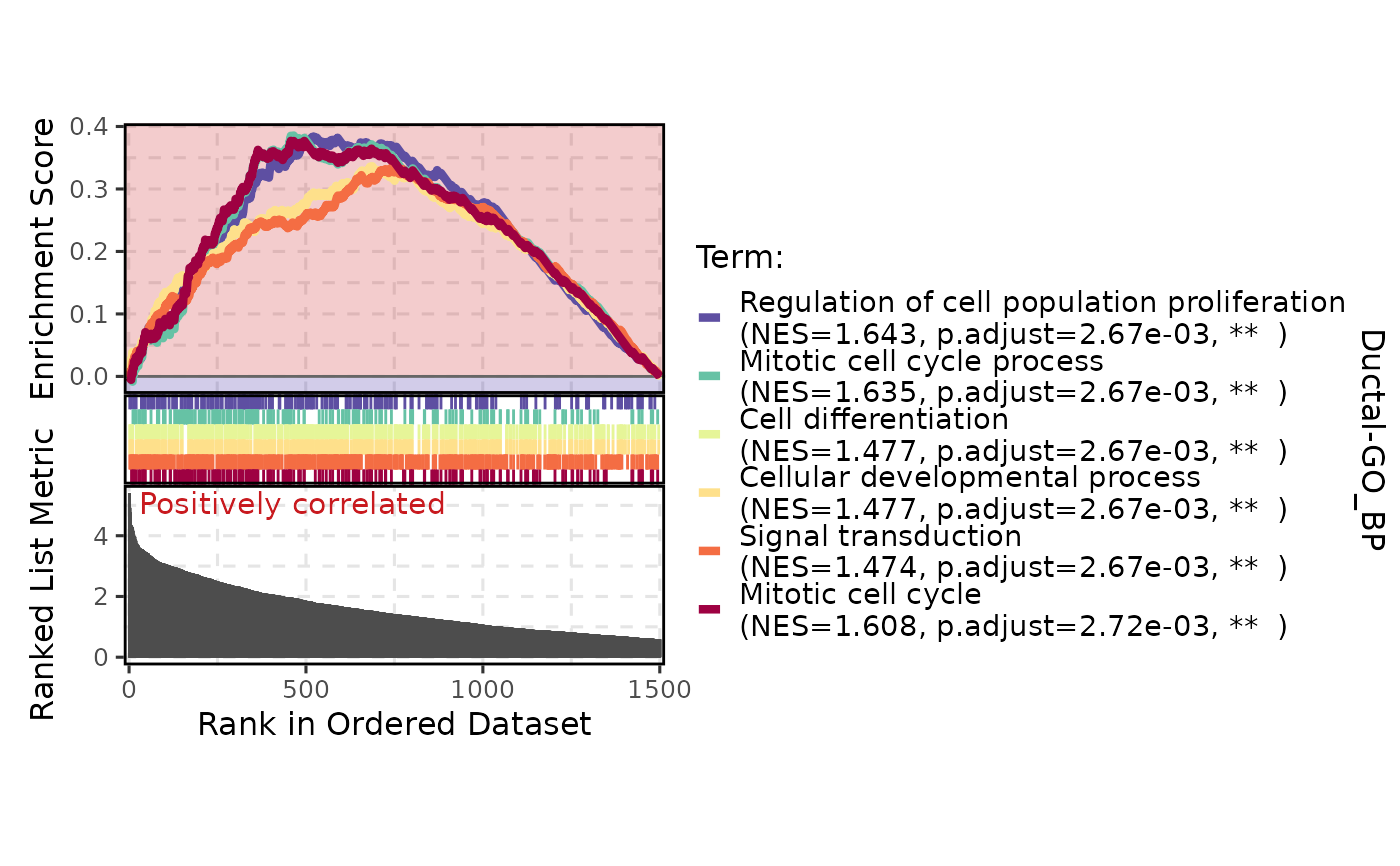
- plot_type
The type of plot to generate. Options are: "line", "comparison", "bar", "network", "enrichmap", "wordcloud". Default is
"line".- group_use
The group(s) to be used for enrichment plot. Default is
NULL.- id_use
List of IDs to be used to display specific terms in the enrichment plot. Default value is
NULL.- pvalueCutoff
The p-value cutoff. Only work when
padjustCutoffisNULL. Default isNULL.- padjustCutoff
The p-adjusted cutoff. Default is
0.05.- topTerm
The number of top terms to display. Default is
6, or100ifplot_typeis"enrichmap".- direction
The direction of enrichment to include in the plot. Must be one of "pos", "neg", or "both". Default is
"both".- compare_only_sig
Whether to compare only significant terms. Default is
FALSE.- topWord
The number of top words to display for wordcloud. Default is
100.- word_type
The type of words to display in wordcloud. Options are
"term"and"feature". Default is"term".- word_size
The size range for words in wordcloud. Default is
c(2, 8).- words_excluded
Words to be excluded from the wordcloud. Default is
NULL, which means that the built-in words (words_excluded) will be used.- line_width
The linewidth for the line plot.
- line_alpha
The alpha value for the line plot.
- line_color
The color for the line plot.
- n_coregene
The number of core genes to label in the line plot.
- sample_coregene
Whether to randomly sample core genes for labeling in the line plot.
- features_label
A character vector of feature names to include as labels in the line plot.
- label.fg
The color of the labels.
- label.bg
The background color of the labels.
- label.bg.r
The radius of the rounding of the label's background.
- label.size
The size of the labels.
- network_layout
The layout algorithm to use for network plot. Options are
"fr","kk","random","circle","tree","grid", or other algorithm fromigraphpackage. Default is"fr".- network_labelsize
The label size for network plot. Default is
5.- network_blendmode
The blend mode for network plot. Default is
"blend".- network_layoutadjust
Whether to adjust the layout of the network plot to avoid overlapping words. Default is
TRUE.- network_adjscale
The scale for adjusting network plot layout. Default is
60.- network_adjiter
The number of iterations for adjusting network plot layout. Default is
100.- enrichmap_layout
The layout algorithm to use for enrichmap plot. Options are
"fr","kk","random","circle","tree","grid", or other algorithm fromigraphpackage. Default is"fr".- enrichmap_cluster
The clustering algorithm to use for enrichmap plot. Options are
"walktrap","fast_greedy", or other algorithm fromigraphpackage. Default is"fast_greedy".- enrichmap_label
The label type for enrichmap plot. Options are
"term"and"feature". Default is"term".- enrichmap_labelsize
The label size for enrichmap plot. Default is
5.- enrlichmap_nlabel
The number of labels to display for each cluster in enrichmap plot. Default is
4.- enrichmap_show_keyword
Whether to show the keyword of terms or features in enrichmap plot. Default is
FALSE.- enrichmap_mark
The mark shape for enrichmap plot. Options are
"ellipse"and"hull". Default is"ellipse".- enrichmap_expand
The expansion factor for enrichmap plot. Default is
c(0.5, 0.5).- character_width
The maximum width of character of descriptions. Default is
50.- lineheight
The line height for y-axis labels. Default is
0.7.- palette
Color palette name. Available palettes can be found in thisplot::show_palettes. Default is
"Spectral".- palcolor
Custom colors used to create a color palette. Default is
NULL.- aspect.ratio
Aspect ratio of the panel. Default is
1.- legend.position
The position of legends, one of
"none","left","right","bottom","top". Default is"right".- legend.direction
The direction of the legend in the plot. Can be one of
"vertical"or"horizontal".- theme_use
Theme used. Can be a character string or a theme function. Default is
"theme_scop".- theme_args
Other arguments passed to the
theme_use. Default islist().- combine
Combine plots into a single
patchworkobject. IfFALSE, return a list of ggplot objects.- nrow
Number of rows in the combined plot. Default is
NULL, which means determined automatically based on the number of plots.- ncol
Number of columns in the combined plot. Default is
NULL, which means determined automatically based on the number of plots.- byrow
Whether to arrange the plots by row in the combined plot. Default is
TRUE.- seed
Random seed for reproducibility. Default is
11.- verbose
Whether to print the message. Default is
TRUE.
Examples
term2gene <- data.frame(
  Term = c(rep("Endocrine markers", 5), rep("Ductal markers", 5)),
  symbol = c("INS", "GCG", "SST", "IAPP", "PCSK1", "KRT19", "SOX9", "MUC1", "CFTR", "KRT7")
)
genes <- unique(term2gene$symbol)
scores <- seq_along(genes)
names(scores) <- genes
gsea_out <- RunGSEA(
  geneID = genes,
  geneScore = scores,
  geneID_groups = rep("Cluster1", length(genes)),
  TERM2GENE = term2gene,
  minGSSize = 2
)
#> ℹ [2026-07-02 09:06:02] Start GSEA analysis
#> ! [2026-07-02 09:06:02] All values in the `geneScore` are greater than zero. Set scoreType = 'pos'
#> ℹ [2026-07-02 09:06:02] Preparing custom GSEA database from `TERM2GENE`/`TERM2NAME` ...
#> ℹ [2026-07-02 09:06:02] Prepared 10 ranked gene rows after ID mapping.
#> ℹ [2026-07-02 09:06:02] Running GSEA for 1 group/database combination(s) using 1 core(s) ...
#> ℹ [2026-07-02 09:06:02] Using 1 core
#> ℹ [2026-07-02 09:06:02] Running GSEA: group "Cluster1", database "custom", genes 10 ...
#> ℹ [2026-07-02 09:06:02] Finished GSEA: group "Cluster1", database "custom".
#> ℹ [2026-07-02 09:06:02] Building results
#> ✔ [2026-07-02 09:06:02] GSEA analysis done
GSEAPlot(res = gsea_out, db = "custom", plot_type = "comparison")
#> Warning: No shared levels found between `names(values)` of the manual scale and the
#> data's alpha values.

GSEAPlot(res = gsea_out, db = "custom", plot_type = "bar")
#> Warning: `guide_colourbar()` cannot be used for alpha.
#> ℹ Use one of colour, color, or fill instead.
GSEAPlot(res = gsea_out, db = "custom", plot_type = "bar")
#> Warning: `guide_colourbar()` cannot be used for alpha.
#> ℹ Use one of colour, color, or fill instead.