This function generates various types of plots for enrichment (over-representation) analysis.
Usage
EnrichmentPlot(
  srt,
  db = "GO_BP",
  group.by = NULL,
  test.use = "wilcox",
  res = NULL,
  plot_type = c("bar", "dot", "lollipop", "network", "enrichmap", "wordcloud",
    "comparison"),
  split_by = c("Database", "Groups"),
  color_by = "Database",
  group_use = NULL,
  id_use = NULL,
  pvalueCutoff = NULL,
  padjustCutoff = 0.05,
  topTerm = ifelse(plot_type == "enrichmap", 100, 6),
  compare_only_sig = FALSE,
  topWord = 100,
  word_type = c("term", "feature"),
  word_size = c(2, 8),
  words_excluded = NULL,
  network_layout = "fr",
  network_labelsize = 5,
  network_blendmode = "blend",
  network_layoutadjust = TRUE,
  network_adjscale = 60,
  network_adjiter = 100,
  enrichmap_layout = "fr",
  enrichmap_cluster = "fast_greedy",
  enrichmap_label = c("term", "feature"),
  enrichmap_labelsize = 5,
  enrlichmap_nlabel = 4,
  enrichmap_show_keyword = FALSE,
  enrichmap_mark = c("ellipse", "hull"),
  enrichmap_expand = c(0.5, 0.5),
  character_width = 50,
  lineheight = 0.7,
  palette = "Spectral",
  palcolor = NULL,
  aspect.ratio = 1,
  legend.position = "right",
  legend.direction = "vertical",
  theme_use = "theme_scop",
  theme_args = list(),
  combine = TRUE,
  nrow = NULL,
  ncol = NULL,
  byrow = TRUE,
  seed = 11,
  verbose = TRUE
)
Arguments
- srt
A Seurat object containing the results of RunDEtest and RunEnrichment. If specified, enrichment results will be extracted from the
Seuratobject automatically. If not specified, theresarguments must be provided.- db
The database to use for enrichment plot. Default is
"GO_BP".- group.by
A character vector specifying the grouping variable in the
Seuratobject. This argument is only used ifsrtis specified.- test.use
A character vector specifying the test to be used in differential expression analysis. This argument is only used if
srtis specified.- res
Enrichment results generated by RunEnrichment function. If provided, 'srt', 'test.use' and 'group.by' are ignored.
- plot_type
The type of plot to generate. Options are:
"bar","dot","lollipop","network","enrichmap","wordcloud","comparison". Default is"bar".- split_by
The splitting variable(s) for the plot. Can be
"Database","Groups", or both. Default isc("Database", "Groups")for plots.- color_by
The variable used for coloring. Default is
"Database".- group_use
The group(s) to be used for enrichment plot. Default is
NULL.- id_use
List of IDs to be used to display specific terms in the enrichment plot. Default value is
NULL.- pvalueCutoff
The p-value cutoff. Only work when
padjustCutoffisNULL. Default isNULL.- padjustCutoff
The p-adjusted cutoff. Default is
0.05.- topTerm
The number of top terms to display. Default is
6, or100ifplot_typeis"enrichmap".- compare_only_sig
Whether to compare only significant terms. Default is
FALSE.- topWord
The number of top words to display for wordcloud. Default is
100.- word_type
The type of words to display in wordcloud. Options are
"term"and"feature". Default is"term".- word_size
The size range for words in wordcloud. Default is
c(2, 8).- words_excluded
Words to be excluded from the wordcloud. Default is
NULL, which means that the built-in words (words_excluded) will be used.- network_layout
The layout algorithm to use for network plot. Options are
"fr","kk","random","circle","tree","grid", or other algorithm fromigraphpackage. Default is"fr".- network_labelsize
The label size for network plot. Default is
5.- network_blendmode
The blend mode for network plot. Default is
"blend".- network_layoutadjust
Whether to adjust the layout of the network plot to avoid overlapping words. Default is
TRUE.- network_adjscale
The scale for adjusting network plot layout. Default is
60.- network_adjiter
The number of iterations for adjusting network plot layout. Default is
100.- enrichmap_layout
The layout algorithm to use for enrichmap plot. Options are
"fr","kk","random","circle","tree","grid", or other algorithm fromigraphpackage. Default is"fr".- enrichmap_cluster
The clustering algorithm to use for enrichmap plot. Options are
"walktrap","fast_greedy", or other algorithm fromigraphpackage. Default is"fast_greedy".- enrichmap_label
The label type for enrichmap plot. Options are
"term"and"feature". Default is"term".- enrichmap_labelsize
The label size for enrichmap plot. Default is
5.- enrlichmap_nlabel
The number of labels to display for each cluster in enrichmap plot. Default is
4.- enrichmap_show_keyword
Whether to show the keyword of terms or features in enrichmap plot. Default is
FALSE.- enrichmap_mark
The mark shape for enrichmap plot. Options are
"ellipse"and"hull". Default is"ellipse".- enrichmap_expand
The expansion factor for enrichmap plot. Default is
c(0.5, 0.5).- character_width
The maximum width of character of descriptions. Default is
50.- lineheight
The line height for y-axis labels. Default is
0.7.- palette
Color palette name. Available palettes can be found in thisplot::show_palettes. Default is
"Spectral".- palcolor
Custom colors used to create a color palette. Default is
NULL.- aspect.ratio
Aspect ratio of the panel. Default is
1.- legend.position
The position of legends, one of
"none","left","right","bottom","top". Default is"right".- legend.direction
The direction of the legend in the plot. Can be one of
"vertical"or"horizontal".- theme_use
Theme used. Can be a character string or a theme function. Default is
"theme_scop".- theme_args
Other arguments passed to the
theme_use. Default islist().- combine
Combine plots into a single
patchworkobject. IfFALSE, return a list of ggplot objects.- nrow
Number of rows in the combined plot. Default is
NULL, which means determined automatically based on the number of plots.- ncol
Number of columns in the combined plot. Default is
NULL, which means determined automatically based on the number of plots.- byrow
Whether to arrange the plots by row in the combined plot. Default is
TRUE.- seed
Random seed for reproducibility. Default is
11.- verbose
Whether to print the message. Default is
TRUE.
Examples
data(pancreas_sub)
pancreas_sub <- standard_scop(pancreas_sub)
#> ℹ [2026-07-02 08:58:49] Start standard processing workflow...
#> ℹ [2026-07-02 08:58:49] Checking a list of <Seurat>...
#> ! [2026-07-02 08:58:49] Data 1/1 of the `srt_list` is "unknown"
#> ℹ [2026-07-02 08:58:49] Perform `NormalizeData()` with `normalization.method = 'LogNormalize'` on 1/1 of `srt_list`...
#> ℹ [2026-07-02 08:58:49] Perform `FindVariableFeatures()` on 1/1 of `srt_list`...
#> ℹ [2026-07-02 08:58:50] Use the separate HVF from `srt_list`
#> ℹ [2026-07-02 08:58:50] Number of available HVF: 2000
#> ℹ [2026-07-02 08:58:50] Finished check
#> ℹ [2026-07-02 08:58:50] Perform `ScaleData()`
#> ℹ [2026-07-02 08:58:50] Perform pca linear dimension reduction
#> ℹ [2026-07-02 08:58:51] Use stored estimated dimensions 1:23 for Standardpca
#> ℹ [2026-07-02 08:58:51] Perform `Seurat::FindClusters()` with `cluster_algorithm = 'louvain'` and `cluster_resolution = 0.6`
#> ℹ [2026-07-02 08:58:51] Reorder clusters...
#> ℹ [2026-07-02 08:58:51] Skip `log1p()` because `layer = data` is not "counts"
#> ℹ [2026-07-02 08:58:51] Perform umap nonlinear dimension reduction
#> ✔ [2026-07-02 08:58:56] Standard processing workflow completed
pancreas_sub <- RunDEtest(
pancreas_sub,
group.by = "CellType"
)
#> ℹ [2026-07-02 08:58:57] Data type is log-normalized
#> ℹ [2026-07-02 08:58:57] Start differential expression test
#> ℹ [2026-07-02 08:58:57] Find all markers(wilcox) among [1] 5 groups...
#> ℹ [2026-07-02 08:58:57] Using 1 core
#> ⠙ [2026-07-02 08:58:57] Running for Ductal [1/5] ■■ 20% | ETA: 0s
#> ✔ [2026-07-02 08:58:57] Completed 5 tasks in 510ms
#>
#> ℹ [2026-07-02 08:58:57] Building results
#> ✔ [2026-07-02 08:58:57] Differential expression test completed
pancreas_sub <- RunEnrichment(
pancreas_sub,
db = c("GO_BP", "GO_CC"),
group.by = "CellType",
species = "Mus_musculus"
)
#> ℹ [2026-07-02 08:58:57] Start Enrichment analysis
#> ℹ [2026-07-02 08:58:57] Species: "Mus_musculus"
#> ℹ [2026-07-02 08:58:57] Loading cached: GO_BP version: 3.23.0 nterm:14957 created: 2026-07-02 08:44:56
#> ℹ [2026-07-02 08:59:28] Preparing database: GO_BP
#> ℹ [2026-07-02 08:59:39] Preparing database: GO_CC
#> ℹ [2026-07-02 08:59:43] Convert ID types for the GO_BP database
#> ℹ [2026-07-02 08:59:44] Converted ID types using local annotation package org.Mm.eg.db
#> ℹ [2026-07-02 08:59:45] Convert ID types for the GO_CC database
#> ℹ [2026-07-02 08:59:45] Converted ID types using local annotation package org.Mm.eg.db
#> ℹ [2026-07-02 08:59:46] Permform enrichment...
#> ℹ [2026-07-02 08:59:47] Using 1 core
#> ⠙ [2026-07-02 08:59:47] Running for 1 [1/10] ■ 10% | ETA: 5s
#> ⠹ [2026-07-02 08:59:47] Running for 4 [4/10] ■■■■ 40% | ETA: 3s
#> ✔ [2026-07-02 08:59:47] Completed 10 tasks in 3.6s
#>
#> ℹ [2026-07-02 08:59:47] Building results
#> ✔ [2026-07-02 08:59:51] Enrichment analysis done
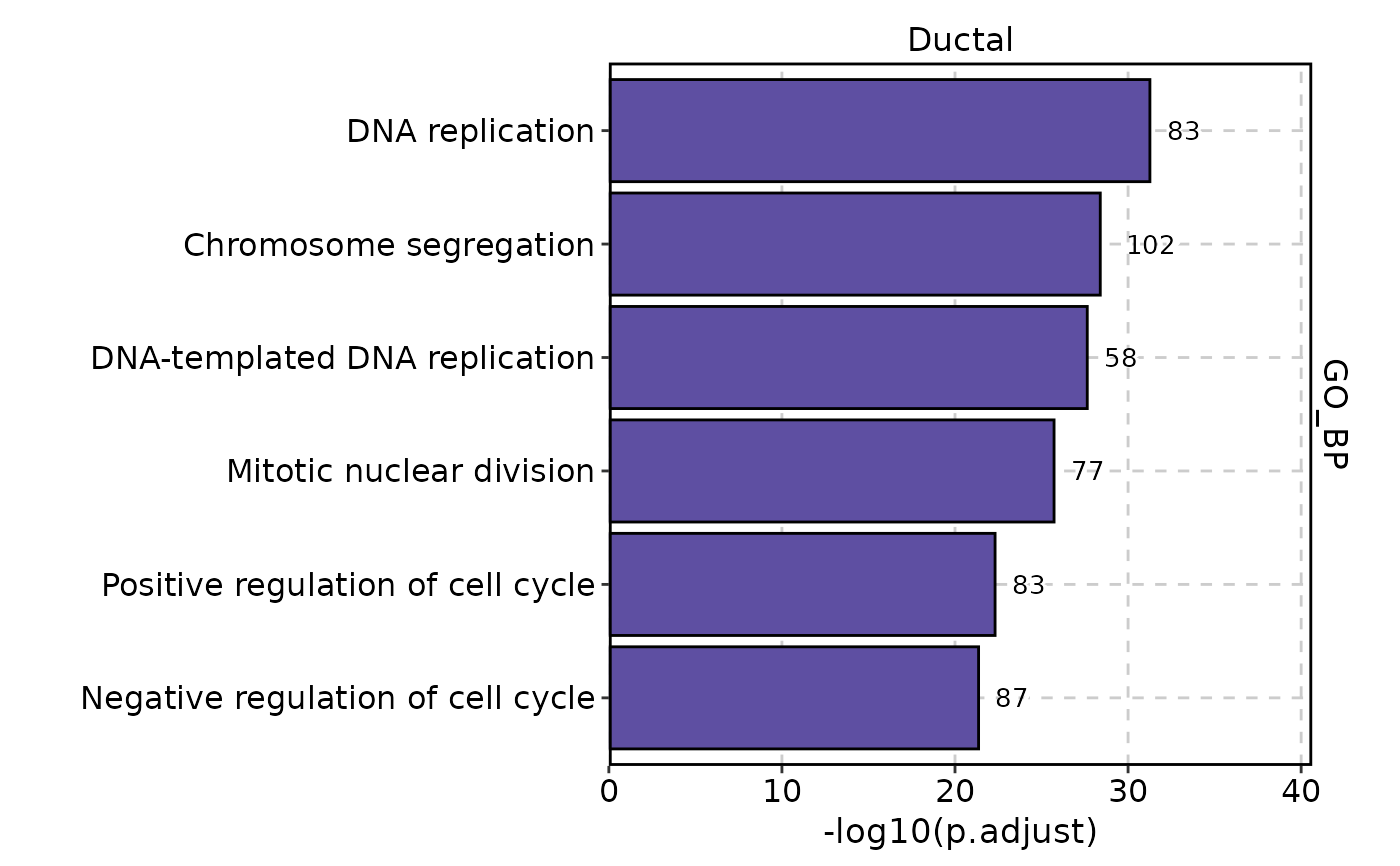
EnrichmentPlot(
pancreas_sub,
db = "GO_BP",
group.by = "CellType",
group_use = "Ductal",
plot_type = "bar"
)
 EnrichmentPlot(
pancreas_sub,
db = "GO_BP",
group.by = "CellType",
plot_type = "bar",
color_by = "Groups",
ncol = 2
)
EnrichmentPlot(
pancreas_sub,
db = "GO_BP",
group.by = "CellType",
plot_type = "bar",
color_by = "Groups",
ncol = 2
)
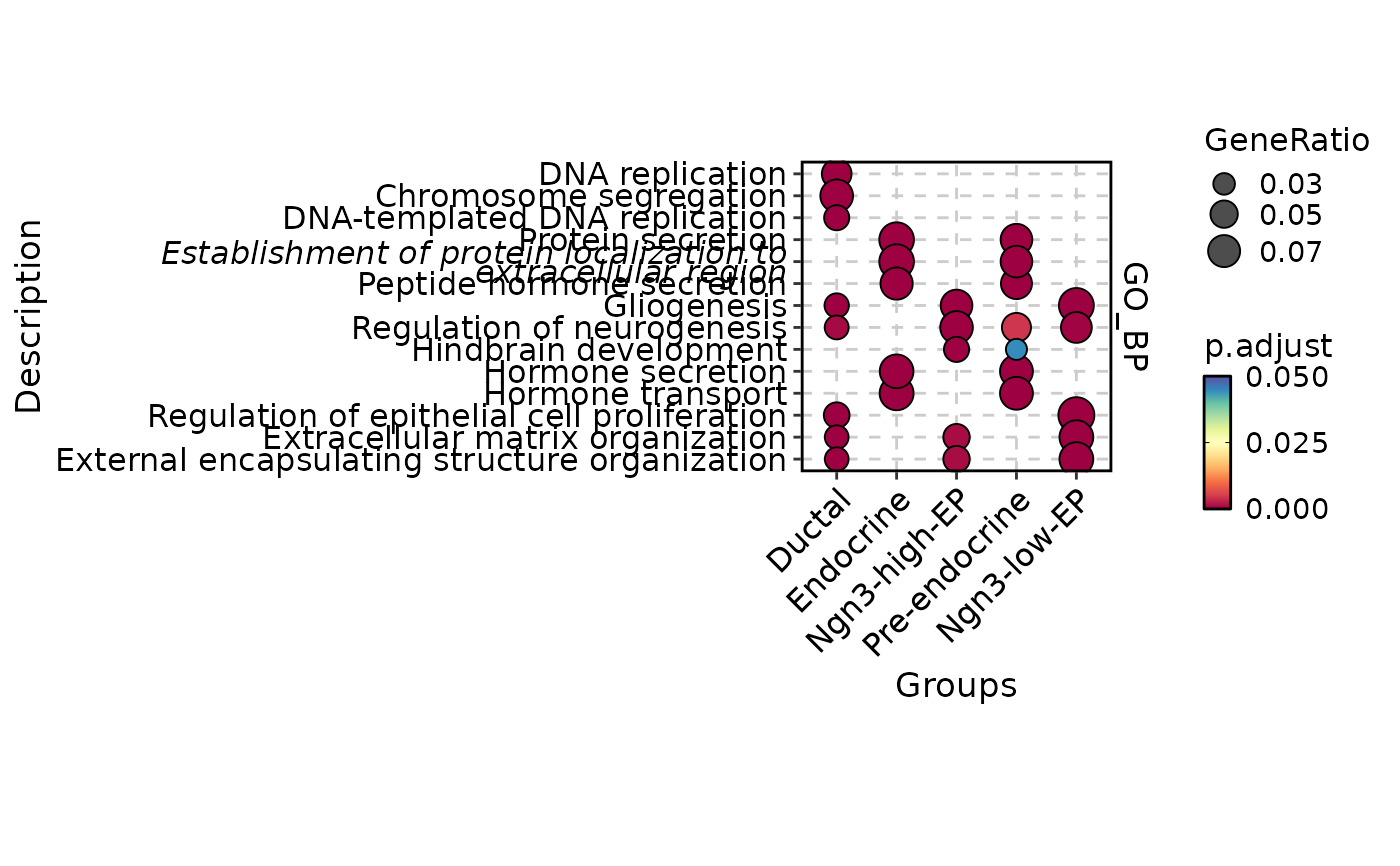
 EnrichmentPlot(
pancreas_sub,
db = "GO_BP",
group.by = "CellType",
plot_type = "bar",
id_use = list(
"Ductal" = c(
"GO:0002181", "GO:0045787",
"GO:0006260", "GO:0050679"
),
"Ngn3-low-EP" = c(
"GO:0050678", "GO:0051101",
"GO:0072091", "GO:0006631"
),
"Ngn3-high-EP" = c(
"GO:0035270", "GO:0030325",
"GO:0008637", "GO:0030856"
),
"Pre-endocrine" = c(
"GO:0090276", "GO:0031018",
"GO:0030073", "GO:1903532"
)
)
)
EnrichmentPlot(
pancreas_sub,
db = "GO_BP",
group.by = "CellType",
plot_type = "bar",
id_use = list(
"Ductal" = c(
"GO:0002181", "GO:0045787",
"GO:0006260", "GO:0050679"
),
"Ngn3-low-EP" = c(
"GO:0050678", "GO:0051101",
"GO:0072091", "GO:0006631"
),
"Ngn3-high-EP" = c(
"GO:0035270", "GO:0030325",
"GO:0008637", "GO:0030856"
),
"Pre-endocrine" = c(
"GO:0090276", "GO:0031018",
"GO:0030073", "GO:1903532"
)
)
)
 EnrichmentPlot(
pancreas_sub,
db = "GO_BP",
group.by = "CellType",
topTerm = 3,
plot_type = "comparison"
)
EnrichmentPlot(
pancreas_sub,
db = "GO_BP",
group.by = "CellType",
topTerm = 3,
plot_type = "comparison"
)
 EnrichmentPlot(
pancreas_sub,
db = "GO_BP",
group.by = "CellType",
topTerm = 3,
plot_type = "comparison",
compare_only_sig = TRUE
)
EnrichmentPlot(
pancreas_sub,
db = "GO_BP",
group.by = "CellType",
topTerm = 3,
plot_type = "comparison",
compare_only_sig = TRUE
)
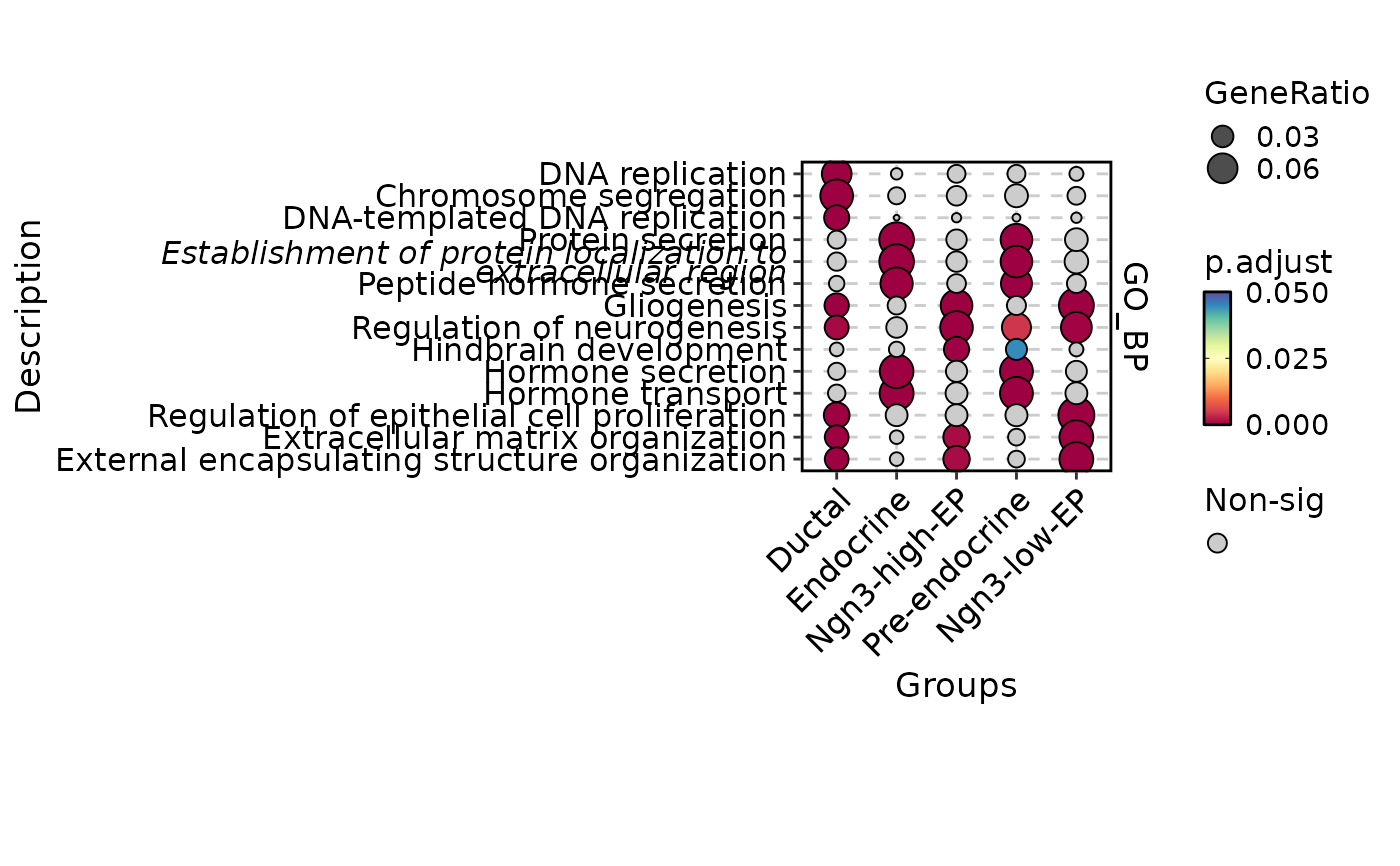
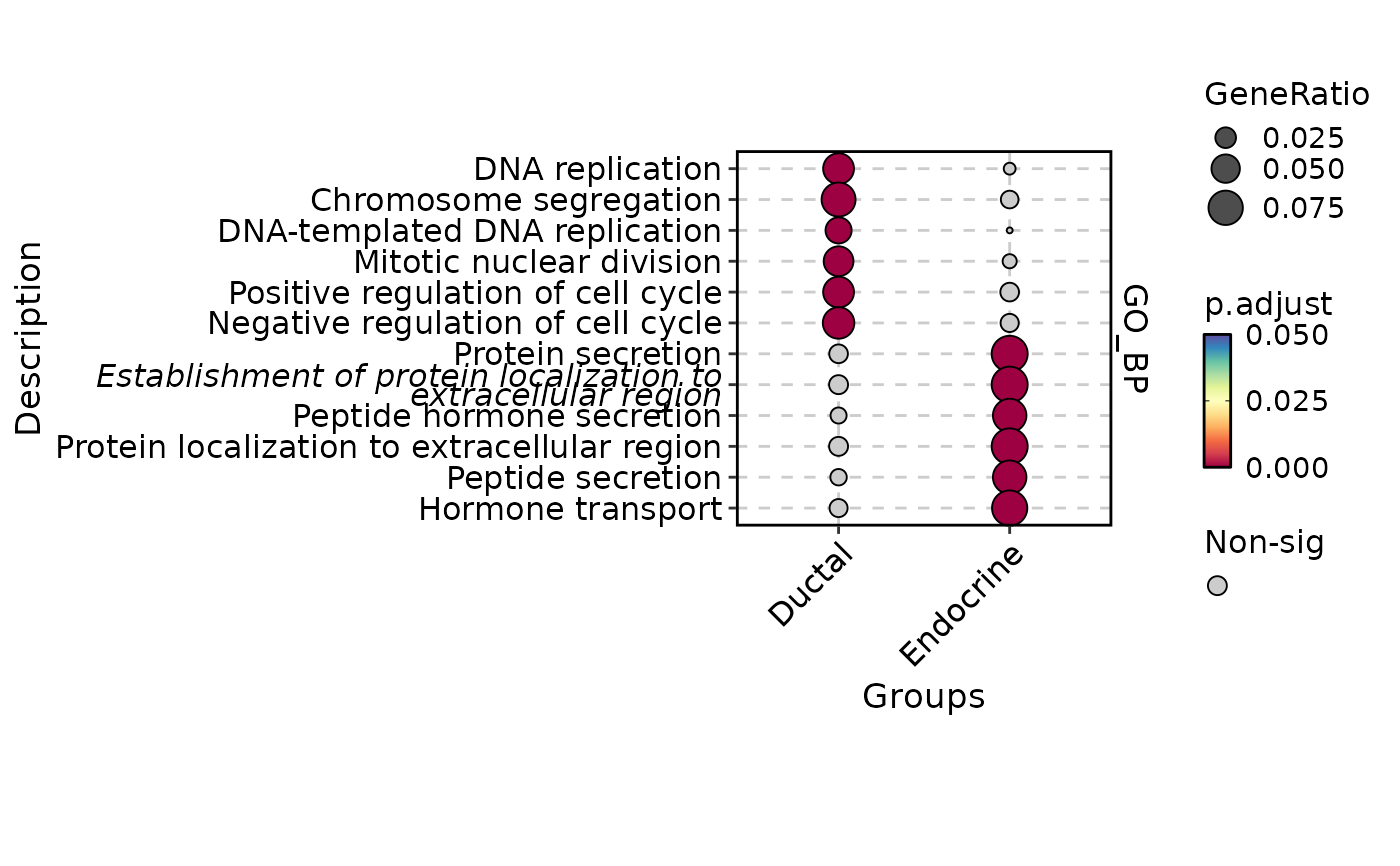
 EnrichmentPlot(
pancreas_sub,
db = "GO_BP",
group.by = "CellType",
group_use = c("Ductal", "Endocrine"),
plot_type = "comparison"
)
EnrichmentPlot(
pancreas_sub,
db = "GO_BP",
group.by = "CellType",
group_use = c("Ductal", "Endocrine"),
plot_type = "comparison"
)
 EnrichmentPlot(
pancreas_sub,
db = c("GO_BP", "GO_CC"),
group.by = "CellType",
group_use = c("Ductal", "Endocrine"),
plot_type = "bar",
split_by = "Groups"
)
EnrichmentPlot(
pancreas_sub,
db = c("GO_BP", "GO_CC"),
group.by = "CellType",
group_use = c("Ductal", "Endocrine"),
plot_type = "bar",
split_by = "Groups"
)
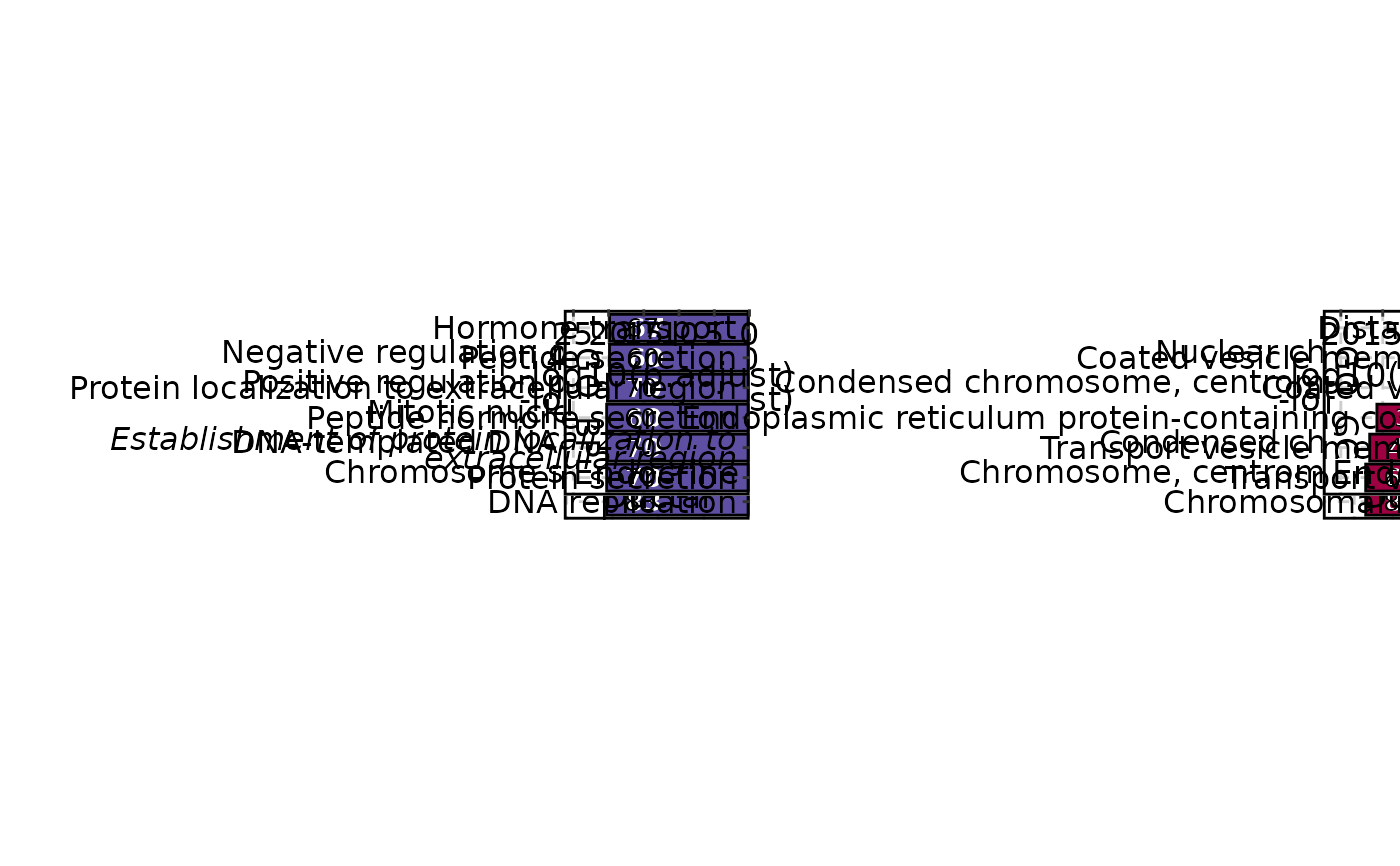
 EnrichmentPlot(
pancreas_sub,
db = c("GO_BP", "GO_CC"),
group.by = "CellType",
group_use = c("Ductal", "Endocrine"),
plot_type = "bar",
split_by = "Database",
color_by = "Groups"
)
EnrichmentPlot(
pancreas_sub,
db = c("GO_BP", "GO_CC"),
group.by = "CellType",
group_use = c("Ductal", "Endocrine"),
plot_type = "bar",
split_by = "Database",
color_by = "Groups"
)
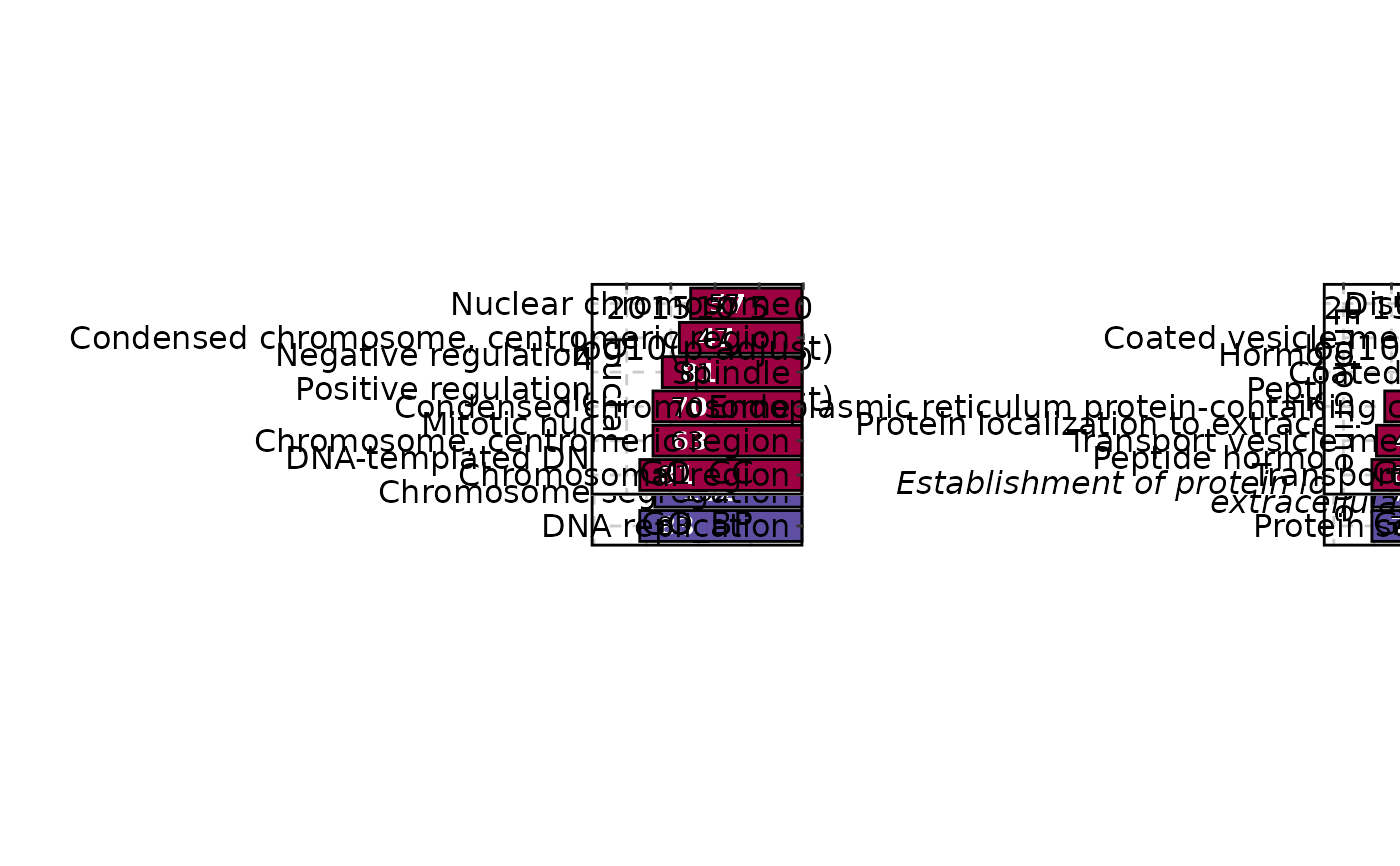
 EnrichmentPlot(
pancreas_sub,
db = c("GO_BP", "GO_CC"),
group.by = "CellType",
group_use = c("Ductal", "Endocrine"),
plot_type = "bar",
split_by = c("Database", "Groups")
)
EnrichmentPlot(
pancreas_sub,
db = c("GO_BP", "GO_CC"),
group.by = "CellType",
group_use = c("Ductal", "Endocrine"),
plot_type = "bar",
split_by = c("Database", "Groups")
)
 EnrichmentPlot(
pancreas_sub,
db = c("GO_BP", "GO_CC"),
group.by = "CellType",
plot_type = "bar",
split_by = "Database",
color_by = "Groups",
palette = "Set1"
)
EnrichmentPlot(
pancreas_sub,
db = c("GO_BP", "GO_CC"),
group.by = "CellType",
plot_type = "bar",
split_by = "Database",
color_by = "Groups",
palette = "Set1"
)
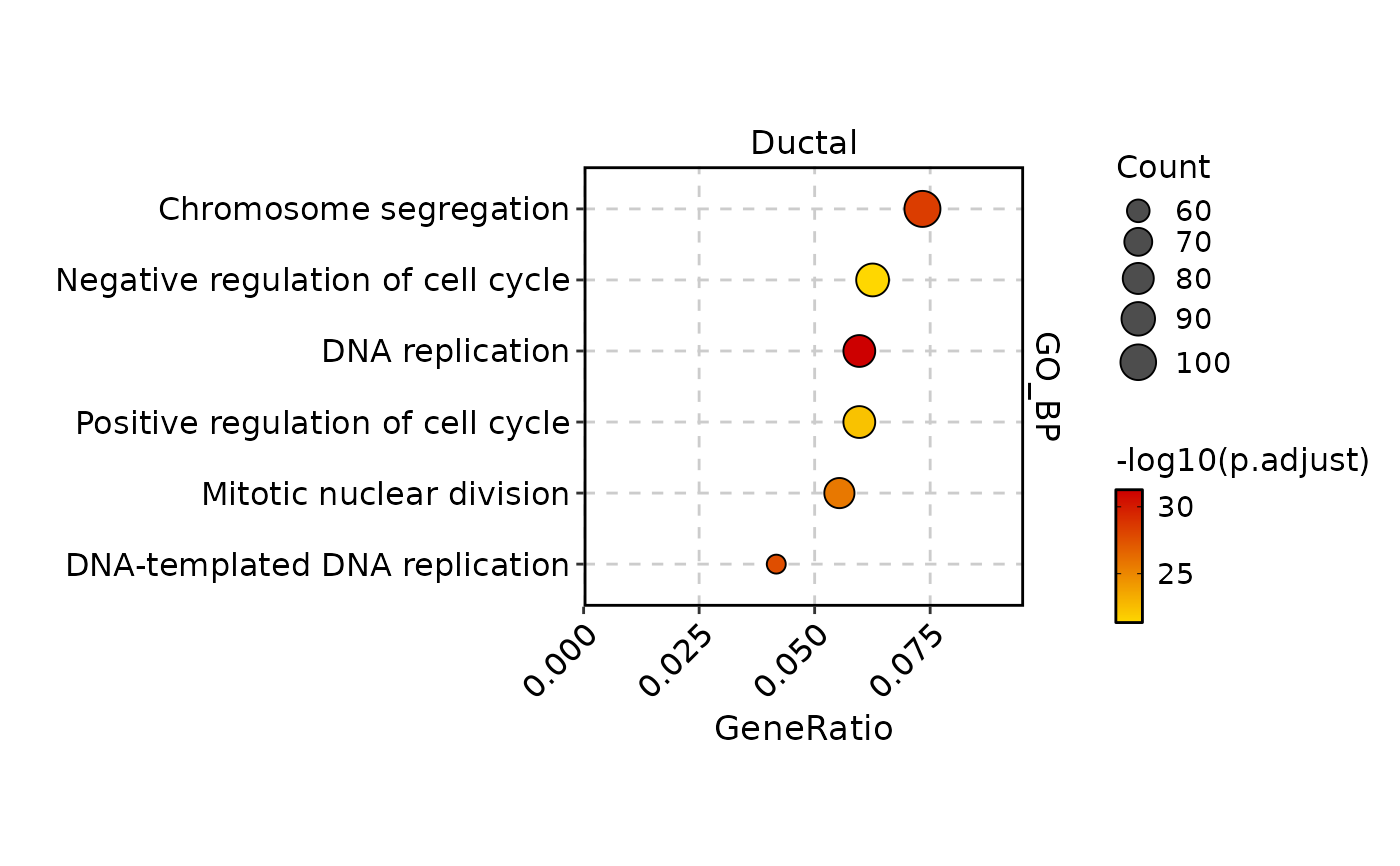
 EnrichmentPlot(
pancreas_sub,
db = "GO_BP",
group.by = "CellType",
group_use = "Ductal",
plot_type = "dot",
palette = "GdRd"
)
EnrichmentPlot(
pancreas_sub,
db = "GO_BP",
group.by = "CellType",
group_use = "Ductal",
plot_type = "dot",
palette = "GdRd"
)
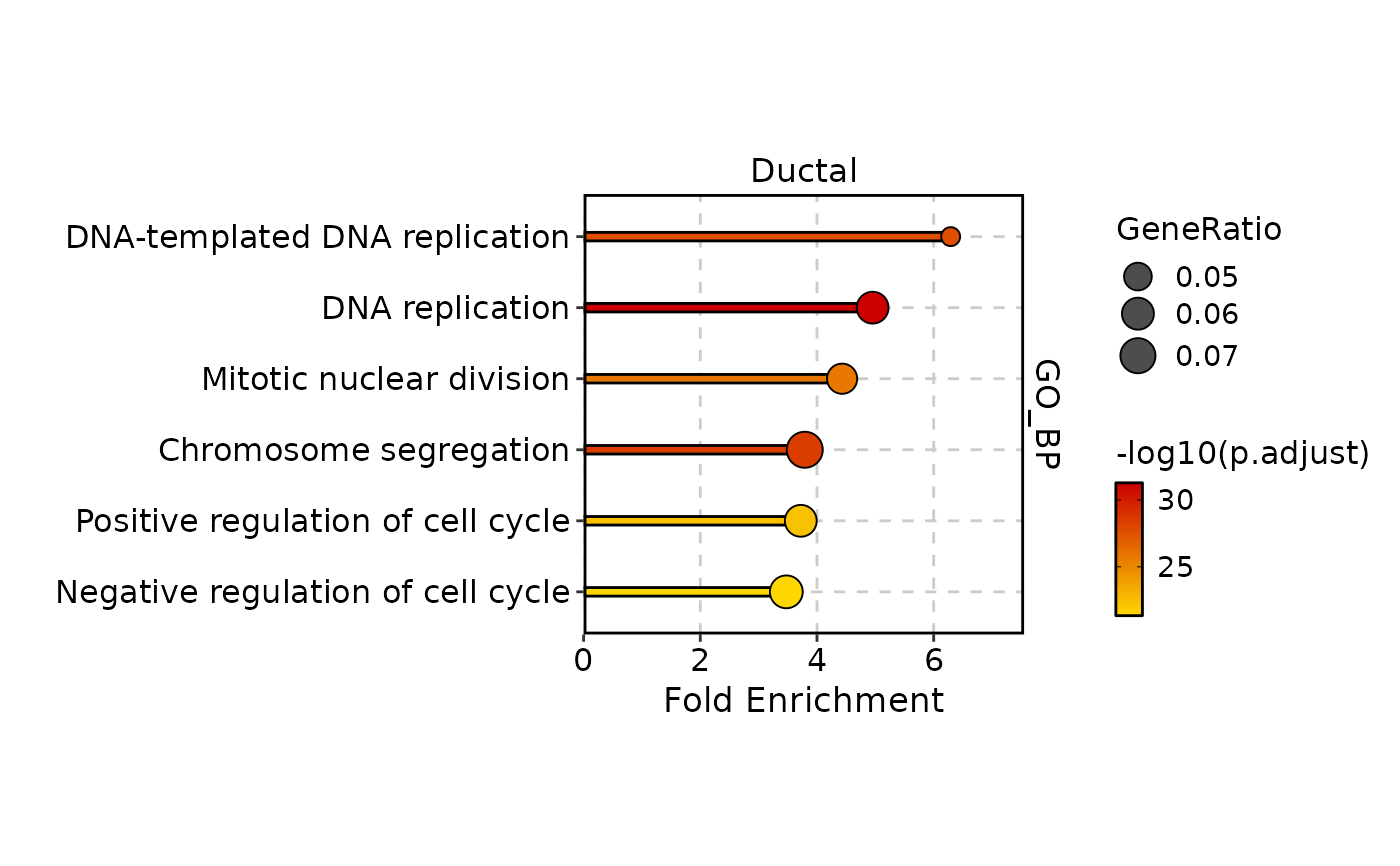
 EnrichmentPlot(
pancreas_sub,
db = "GO_BP",
group.by = "CellType",
group_use = "Ductal",
plot_type = "lollipop",
palette = "GdRd"
)
EnrichmentPlot(
pancreas_sub,
db = "GO_BP",
group.by = "CellType",
group_use = "Ductal",
plot_type = "lollipop",
palette = "GdRd"
)
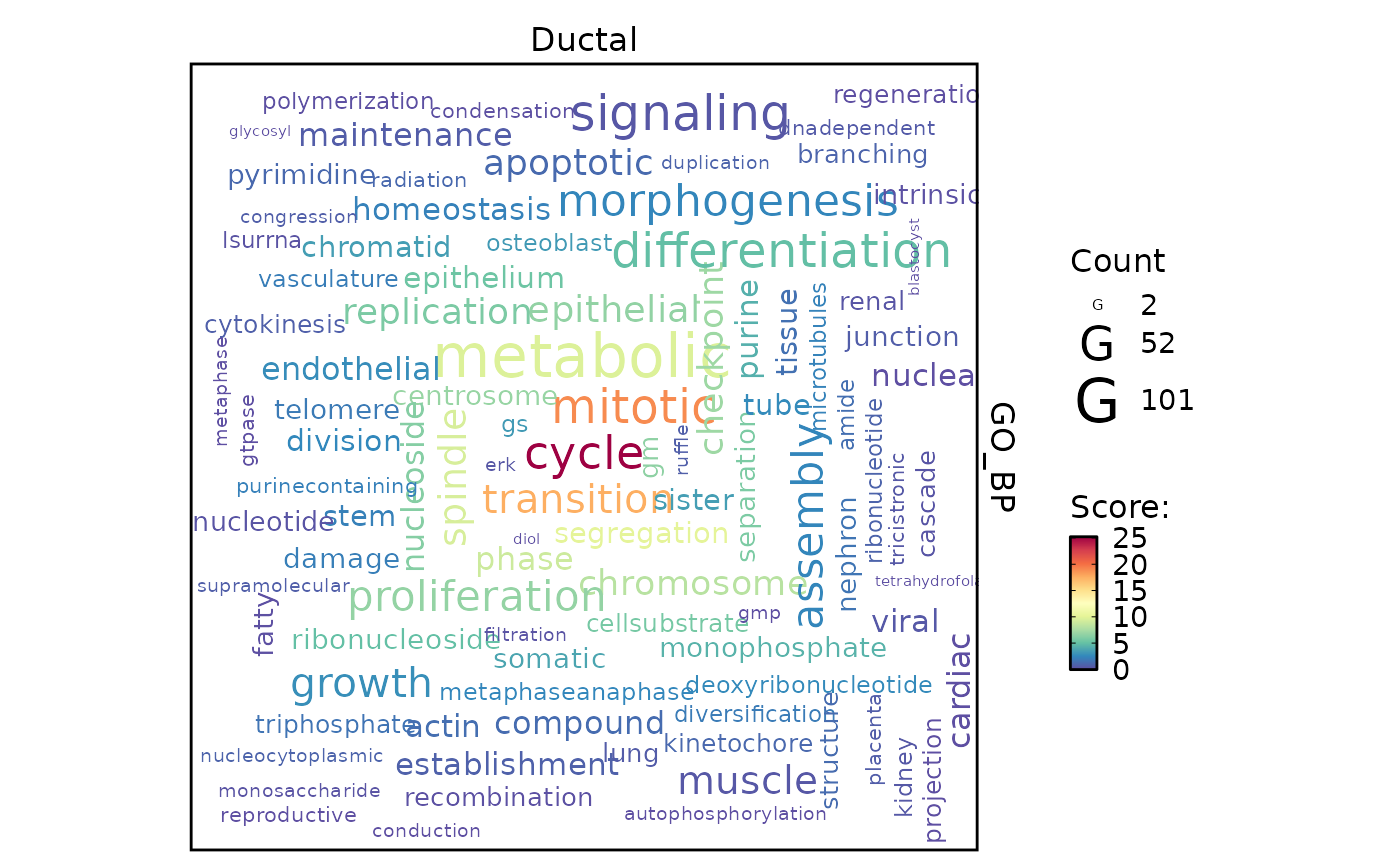
 EnrichmentPlot(
pancreas_sub,
db = "GO_BP",
group.by = "CellType",
group_use = "Ductal",
plot_type = "wordcloud"
)
EnrichmentPlot(
pancreas_sub,
db = "GO_BP",
group.by = "CellType",
group_use = "Ductal",
plot_type = "wordcloud"
)
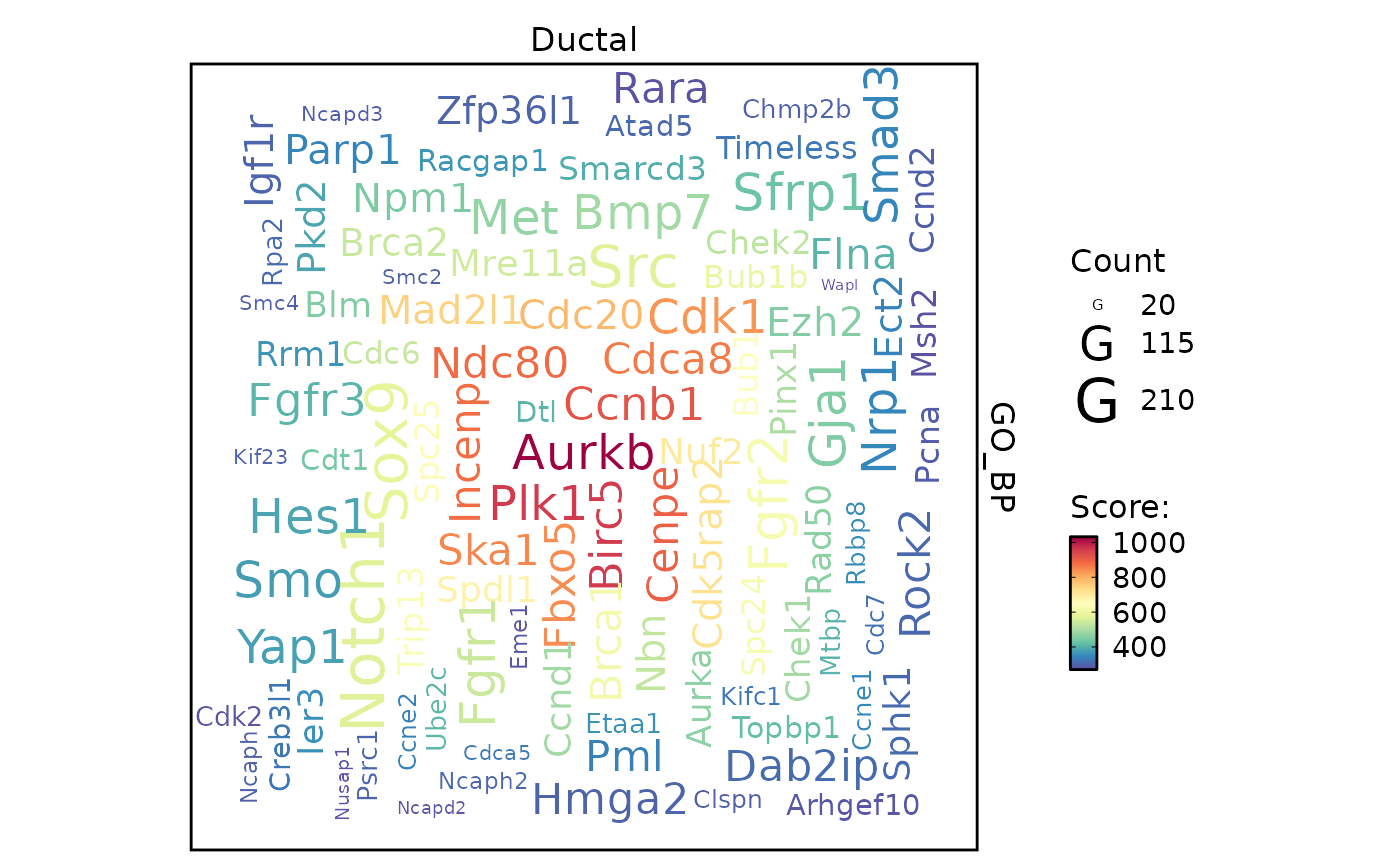
 EnrichmentPlot(
pancreas_sub,
db = "GO_BP",
group.by = "CellType",
group_use = "Ductal",
plot_type = "wordcloud",
word_type = "feature"
)
EnrichmentPlot(
pancreas_sub,
db = "GO_BP",
group.by = "CellType",
group_use = "Ductal",
plot_type = "wordcloud",
word_type = "feature"
)
 EnrichmentPlot(
pancreas_sub,
db = "GO_BP",
group.by = "CellType",
group_use = "Ductal",
plot_type = "network"
)
#> Found more than one class "dist" in cache; using the first, from namespace 'spam'
#> Also defined by ‘BiocGenerics’
#> Found more than one class "dist" in cache; using the first, from namespace 'spam'
#> Also defined by ‘BiocGenerics’
#> ◌ [2026-07-02 09:00:17] Installing: shadowtext...
#>
#> → Package library at /tmp/RtmpDl7zcp/temp_libpath43495630c53.
#> → Will install 1 package.
#> → The package (0 B) is cached.
#> + shadowtext 0.1.6
#> ✔ All system requirements are already installed.
#>
#> ℹ No downloads are needed, 1 pkg is cached
#> ✔ Got shadowtext 0.1.6 (x86_64-pc-linux-gnu-ubuntu-24.04) (243.58 kB)
#> ℹ Installing system requirements
#> ℹ Executing `sudo sh -c apt-get -y update`
#> Get:1 file:/etc/apt/apt-mirrors.txt Mirrorlist [144 B]
#> Hit:6 https://packages.microsoft.com/repos/azure-cli noble InRelease
#> Hit:7 https://packages.microsoft.com/ubuntu/24.04/prod noble InRelease
#> Hit:2 http://azure.archive.ubuntu.com/ubuntu noble InRelease
#> Hit:3 http://azure.archive.ubuntu.com/ubuntu noble-updates InRelease
#> Hit:4 http://azure.archive.ubuntu.com/ubuntu noble-backports InRelease
#> Hit:5 http://azure.archive.ubuntu.com/ubuntu noble-security InRelease
#> Hit:8 https://dl.google.com/linux/chrome-stable/deb stable InRelease
#> Reading package lists...
#> ℹ Executing `sudo sh -c apt-get -y install cmake make libuv1-dev libcairo2-dev libfontconfig1-dev libfreetype6-dev libpng-dev pandoc`
#> Reading package lists...
#> Building dependency tree...
#> Reading state information...
#> cmake is already the newest version (3.28.3-1build7).
#> make is already the newest version (4.3-4.1build2).
#> libuv1-dev is already the newest version (1.48.0-1.1build1).
#> libcairo2-dev is already the newest version (1.18.0-3build1).
#> libfontconfig1-dev is already the newest version (2.15.0-1.1ubuntu2).
#> libfreetype-dev is already the newest version (2.13.2+dfsg-1ubuntu0.1).
#> libpng-dev is already the newest version (1.6.43-5ubuntu0.6).
#> pandoc is already the newest version (3.1.3+ds-2).
#> 0 upgraded, 0 newly installed, 0 to remove and 11 not upgraded.
#> ✔ Installed shadowtext 0.1.6 (1.1s)
#> ✔ 1 pkg + 56 deps: kept 56, added 1, dld 1 (243.58 kB) [5.3s]
#> ✔ [2026-07-02 09:00:22] shadowtext installed successfully
EnrichmentPlot(
pancreas_sub,
db = "GO_BP",
group.by = "CellType",
group_use = "Ductal",
plot_type = "network"
)
#> Found more than one class "dist" in cache; using the first, from namespace 'spam'
#> Also defined by ‘BiocGenerics’
#> Found more than one class "dist" in cache; using the first, from namespace 'spam'
#> Also defined by ‘BiocGenerics’
#> ◌ [2026-07-02 09:00:17] Installing: shadowtext...
#>
#> → Package library at /tmp/RtmpDl7zcp/temp_libpath43495630c53.
#> → Will install 1 package.
#> → The package (0 B) is cached.
#> + shadowtext 0.1.6
#> ✔ All system requirements are already installed.
#>
#> ℹ No downloads are needed, 1 pkg is cached
#> ✔ Got shadowtext 0.1.6 (x86_64-pc-linux-gnu-ubuntu-24.04) (243.58 kB)
#> ℹ Installing system requirements
#> ℹ Executing `sudo sh -c apt-get -y update`
#> Get:1 file:/etc/apt/apt-mirrors.txt Mirrorlist [144 B]
#> Hit:6 https://packages.microsoft.com/repos/azure-cli noble InRelease
#> Hit:7 https://packages.microsoft.com/ubuntu/24.04/prod noble InRelease
#> Hit:2 http://azure.archive.ubuntu.com/ubuntu noble InRelease
#> Hit:3 http://azure.archive.ubuntu.com/ubuntu noble-updates InRelease
#> Hit:4 http://azure.archive.ubuntu.com/ubuntu noble-backports InRelease
#> Hit:5 http://azure.archive.ubuntu.com/ubuntu noble-security InRelease
#> Hit:8 https://dl.google.com/linux/chrome-stable/deb stable InRelease
#> Reading package lists...
#> ℹ Executing `sudo sh -c apt-get -y install cmake make libuv1-dev libcairo2-dev libfontconfig1-dev libfreetype6-dev libpng-dev pandoc`
#> Reading package lists...
#> Building dependency tree...
#> Reading state information...
#> cmake is already the newest version (3.28.3-1build7).
#> make is already the newest version (4.3-4.1build2).
#> libuv1-dev is already the newest version (1.48.0-1.1build1).
#> libcairo2-dev is already the newest version (1.18.0-3build1).
#> libfontconfig1-dev is already the newest version (2.15.0-1.1ubuntu2).
#> libfreetype-dev is already the newest version (2.13.2+dfsg-1ubuntu0.1).
#> libpng-dev is already the newest version (1.6.43-5ubuntu0.6).
#> pandoc is already the newest version (3.1.3+ds-2).
#> 0 upgraded, 0 newly installed, 0 to remove and 11 not upgraded.
#> ✔ Installed shadowtext 0.1.6 (1.1s)
#> ✔ 1 pkg + 56 deps: kept 56, added 1, dld 1 (243.58 kB) [5.3s]
#> ✔ [2026-07-02 09:00:22] shadowtext installed successfully
 EnrichmentPlot(
pancreas_sub,
db = "GO_BP",
group.by = "CellType",
group_use = "Ductal",
plot_type = "network",
id_use = c(
"GO:0050678",
"GO:0035270",
"GO:0090276",
"GO:0030073"
)
)
#> ✔ [2026-07-02 09:00:23] shadowtext installed successfully
EnrichmentPlot(
pancreas_sub,
db = "GO_BP",
group.by = "CellType",
group_use = "Ductal",
plot_type = "network",
id_use = c(
"GO:0050678",
"GO:0035270",
"GO:0090276",
"GO:0030073"
)
)
#> ✔ [2026-07-02 09:00:23] shadowtext installed successfully
 EnrichmentPlot(
pancreas_sub,
db = "GO_BP",
group.by = "CellType",
group_use = "Ductal",
plot_type = "network",
network_layoutadjust = FALSE
)
#> ✔ [2026-07-02 09:00:24] shadowtext installed successfully
EnrichmentPlot(
pancreas_sub,
db = "GO_BP",
group.by = "CellType",
group_use = "Ductal",
plot_type = "network",
network_layoutadjust = FALSE
)
#> ✔ [2026-07-02 09:00:24] shadowtext installed successfully
 EnrichmentPlot(
pancreas_sub,
db = "GO_BP",
group.by = "CellType",
group_use = "Ductal",
plot_type = "network",
topTerm = 4,
network_blendmode = "average",
theme_use = "theme_blank",
theme_args = list(add_coord = FALSE)
) |> thisplot::panel_fix(height = 5)
#> ✔ [2026-07-02 09:00:26] shadowtext installed successfully
EnrichmentPlot(
pancreas_sub,
db = "GO_BP",
group.by = "CellType",
group_use = "Ductal",
plot_type = "network",
topTerm = 4,
network_blendmode = "average",
theme_use = "theme_blank",
theme_args = list(add_coord = FALSE)
) |> thisplot::panel_fix(height = 5)
#> ✔ [2026-07-02 09:00:26] shadowtext installed successfully
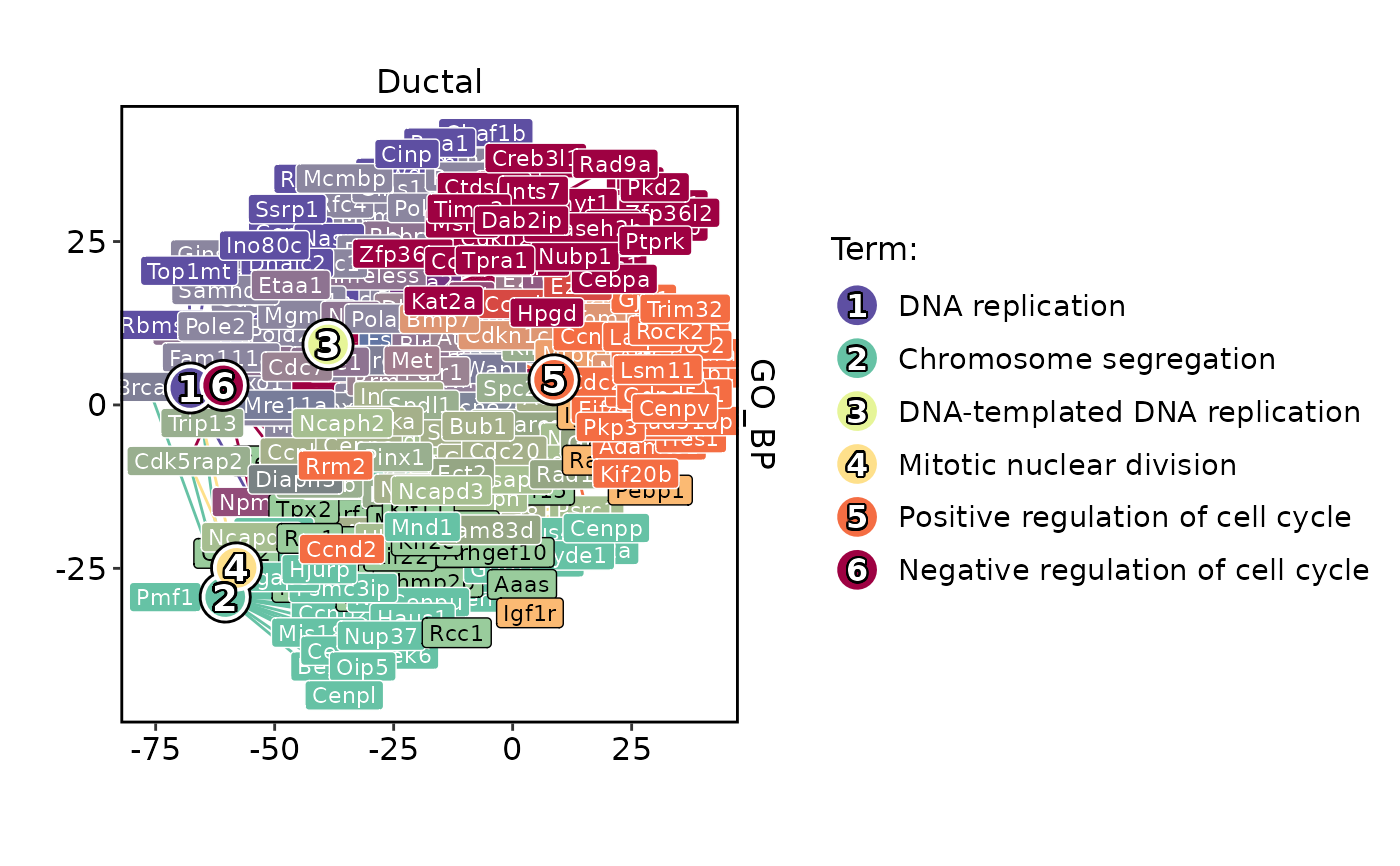
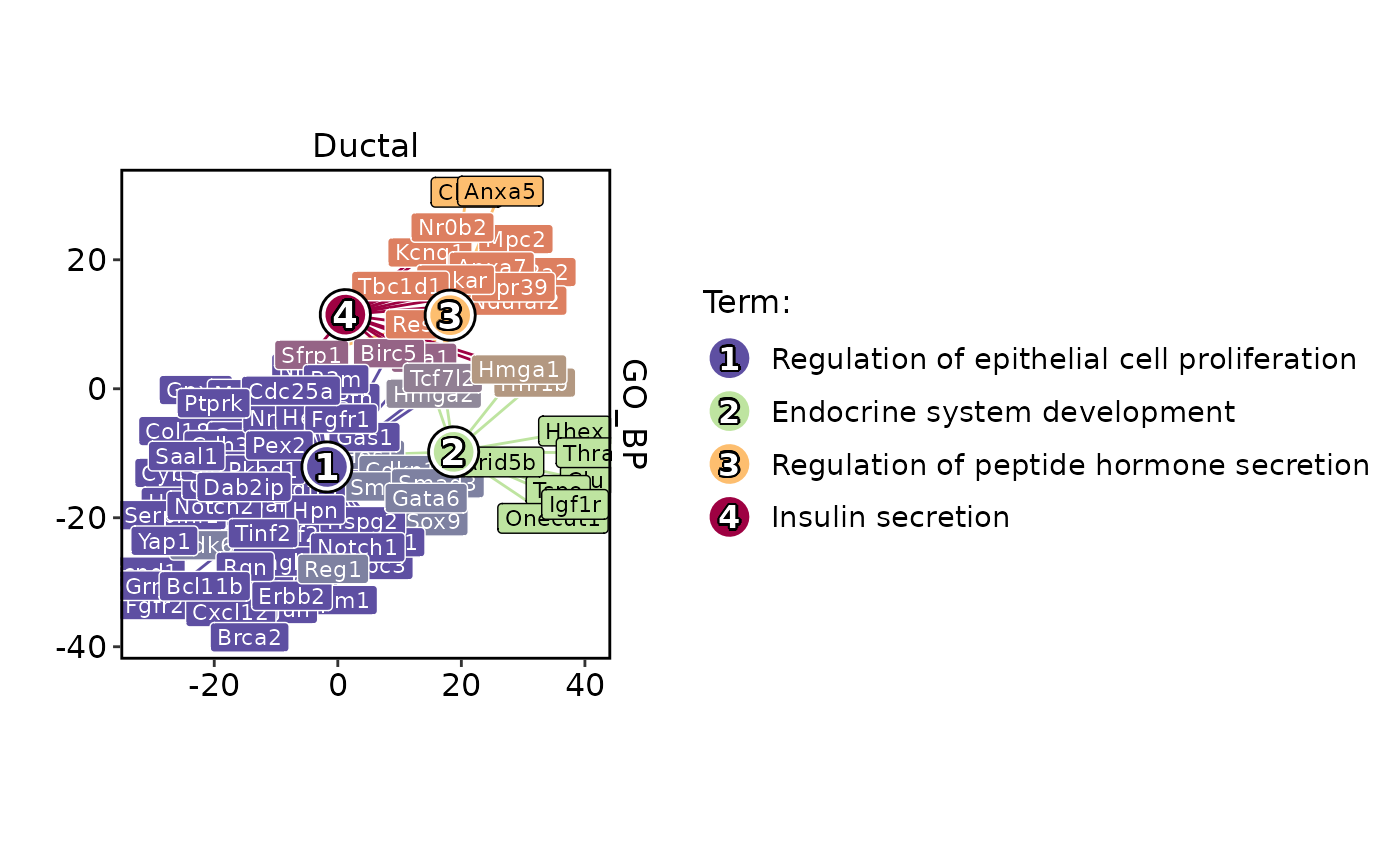
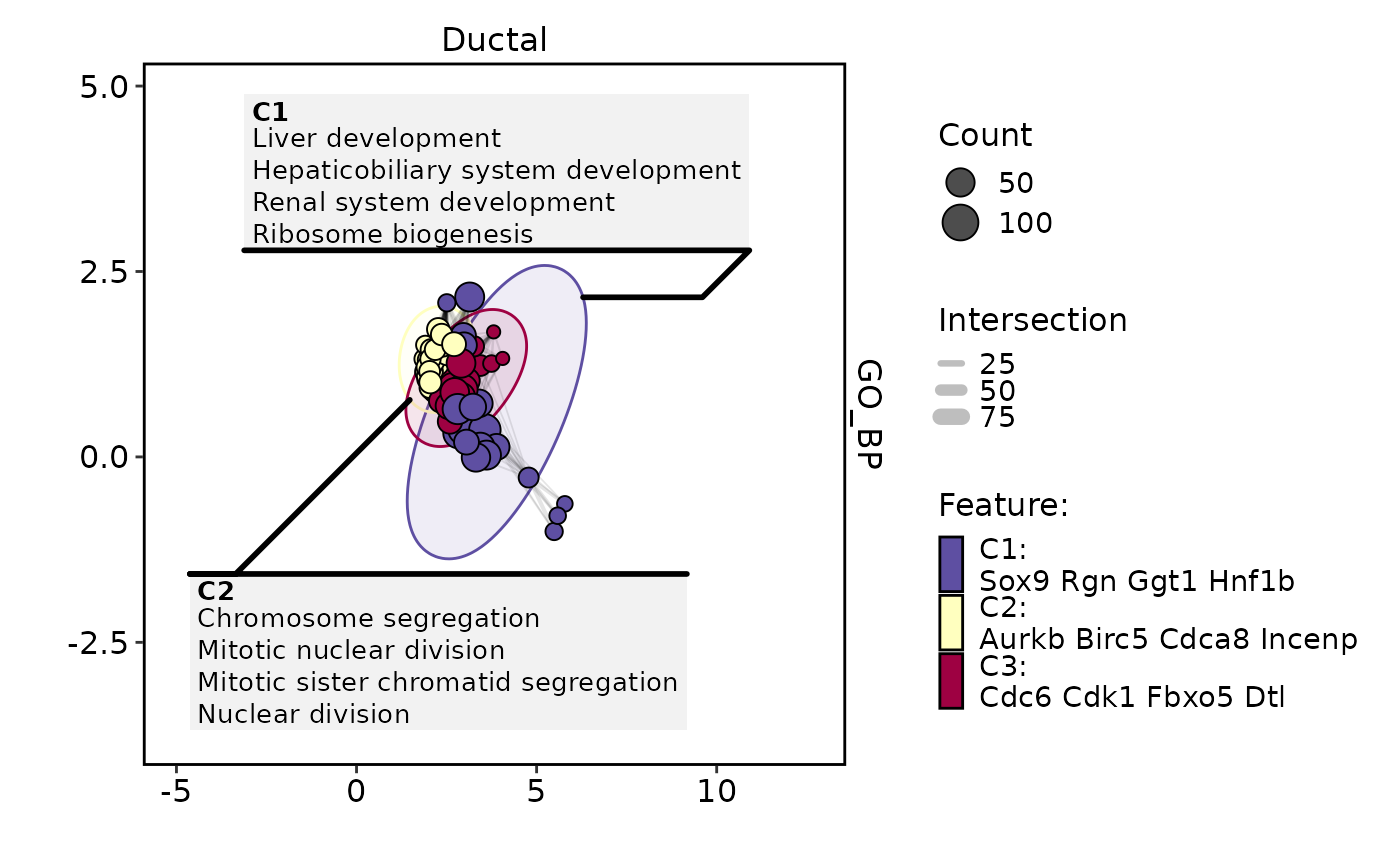
 EnrichmentPlot(
pancreas_sub,
db = "GO_BP",
group.by = "CellType",
group_use = "Ductal",
plot_type = "enrichmap"
)
EnrichmentPlot(
pancreas_sub,
db = "GO_BP",
group.by = "CellType",
group_use = "Ductal",
plot_type = "enrichmap"
)
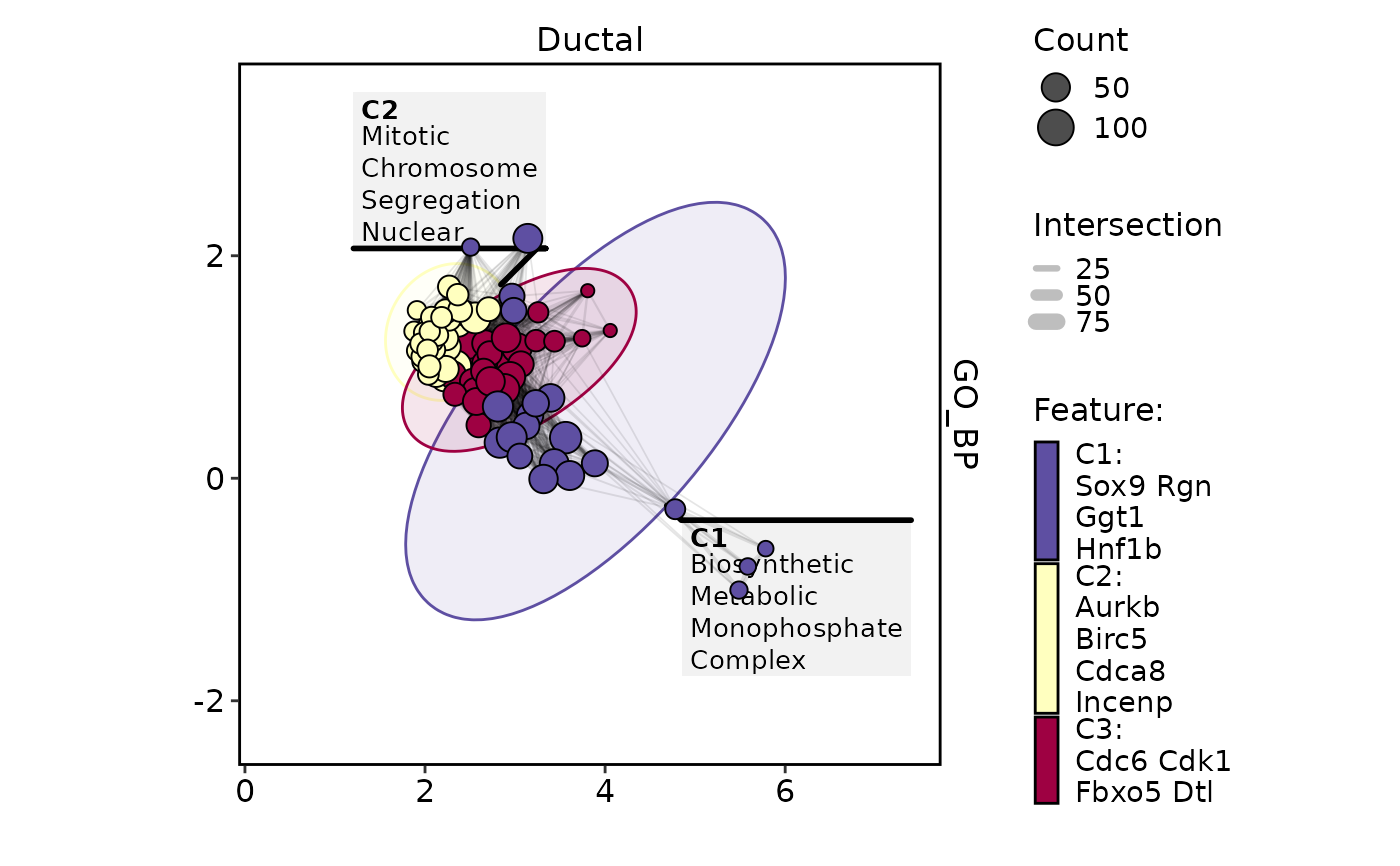
 EnrichmentPlot(
pancreas_sub,
db = "GO_BP",
group.by = "CellType",
group_use = "Ductal",
plot_type = "enrichmap",
enrichmap_expand = c(2, 1)
)
EnrichmentPlot(
pancreas_sub,
db = "GO_BP",
group.by = "CellType",
group_use = "Ductal",
plot_type = "enrichmap",
enrichmap_expand = c(2, 1)
)
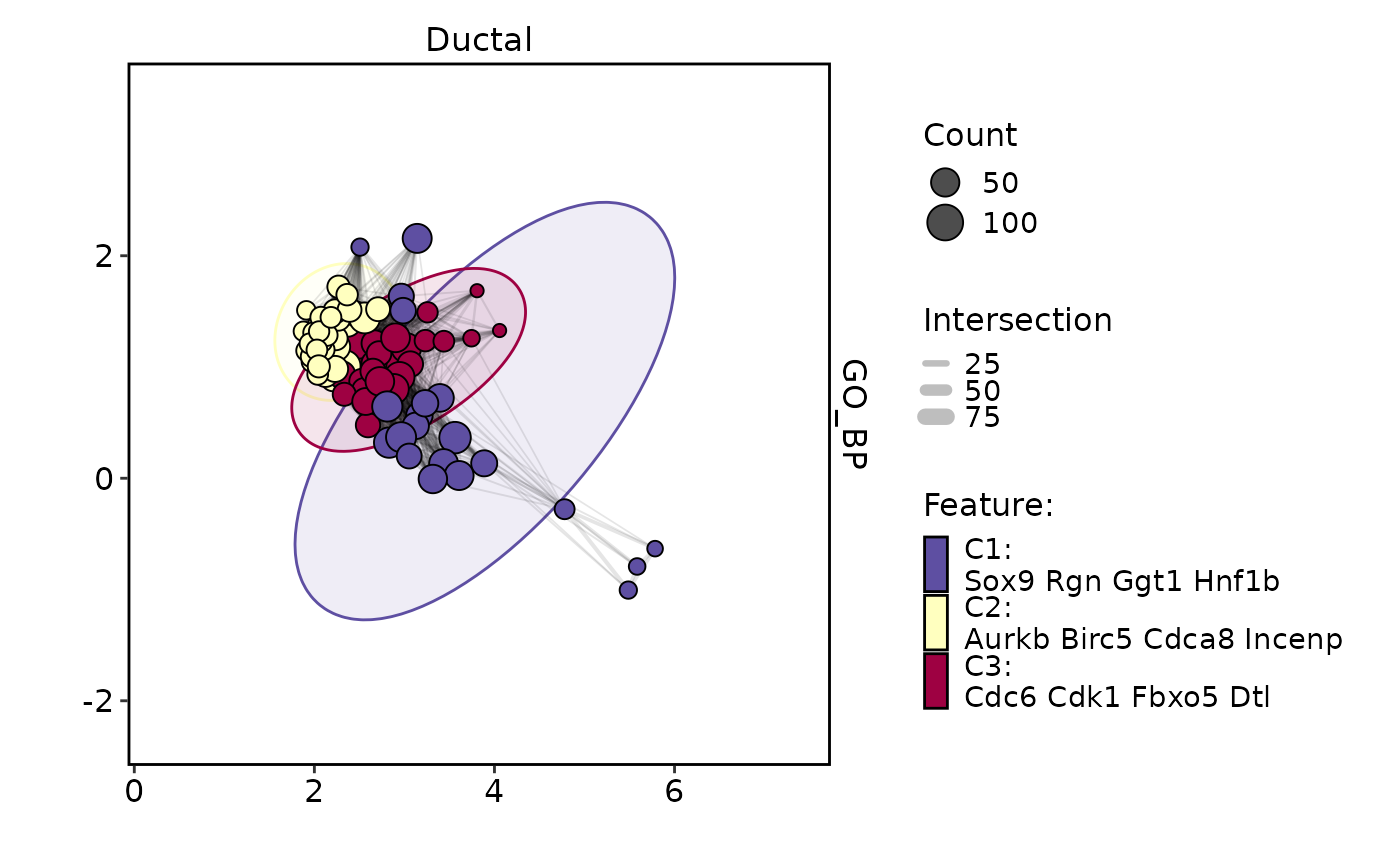 EnrichmentPlot(
pancreas_sub,
db = "GO_BP",
group.by = "CellType",
group_use = "Ductal",
plot_type = "enrichmap",
enrichmap_show_keyword = TRUE,
character_width = 10
)
EnrichmentPlot(
pancreas_sub,
db = "GO_BP",
group.by = "CellType",
group_use = "Ductal",
plot_type = "enrichmap",
enrichmap_show_keyword = TRUE,
character_width = 10
)
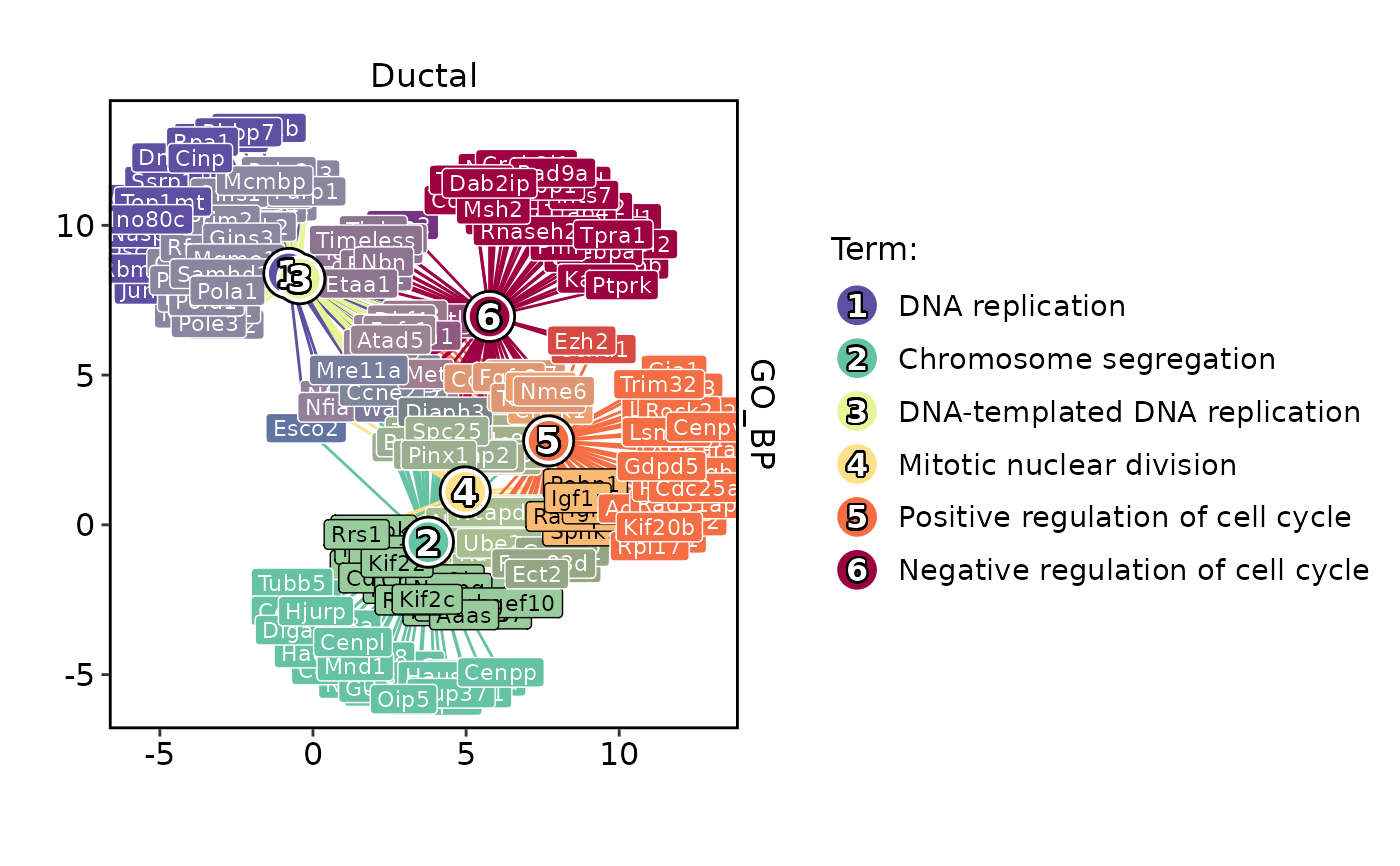
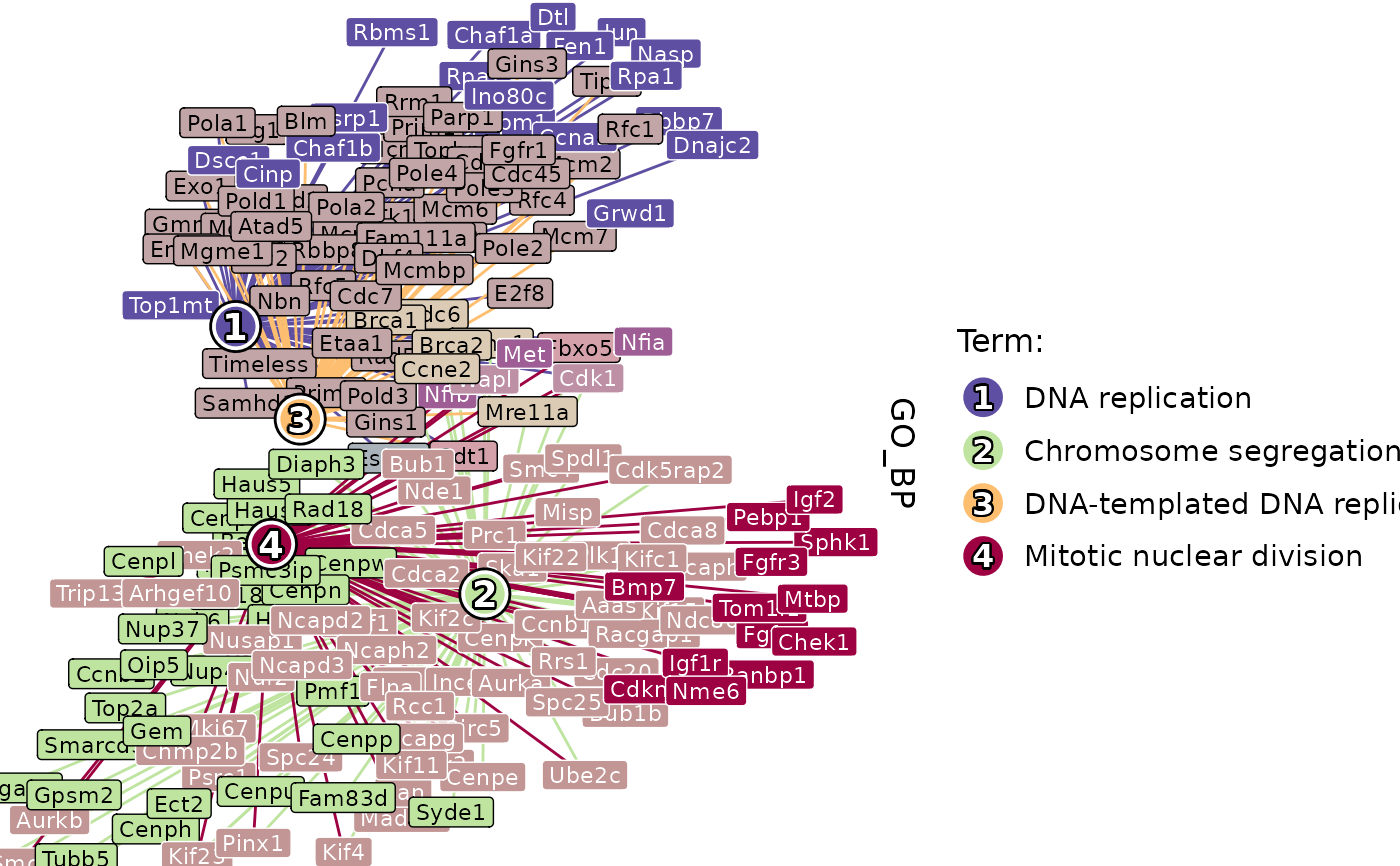
 EnrichmentPlot(
pancreas_sub,
db = "GO_BP",
group.by = "CellType",
group_use = "Ductal",
plot_type = "enrichmap",
topTerm = 200,
enrichmap_mark = "hull",
enrichmap_label = "feature",
enrlichmap_nlabel = 3,
character_width = 10,
theme_use = "theme_blank",
theme_args = list(add_coord = FALSE)
) |> thisplot::panel_fix(height = 4)
EnrichmentPlot(
pancreas_sub,
db = "GO_BP",
group.by = "CellType",
group_use = "Ductal",
plot_type = "enrichmap",
topTerm = 200,
enrichmap_mark = "hull",
enrichmap_label = "feature",
enrlichmap_nlabel = 3,
character_width = 10,
theme_use = "theme_blank",
theme_args = list(add_coord = FALSE)
) |> thisplot::panel_fix(height = 4)
 if (interactive()) {
pancreas_sub <- RunEnrichment(
pancreas_sub,
db = c("MP", "DO"),
group.by = "CellType",
convert_species = TRUE,
species = "Mus_musculus"
)
EnrichmentPlot(
pancreas_sub,
db = c("MP", "DO"),
group.by = "CellType",
group_use = "Ductal",
ncol = 1
)
}
if (interactive()) {
pancreas_sub <- RunEnrichment(
pancreas_sub,
db = c("MP", "DO"),
group.by = "CellType",
convert_species = TRUE,
species = "Mus_musculus"
)
EnrichmentPlot(
pancreas_sub,
db = c("MP", "DO"),
group.by = "CellType",
group_use = "Ductal",
ncol = 1
)
}