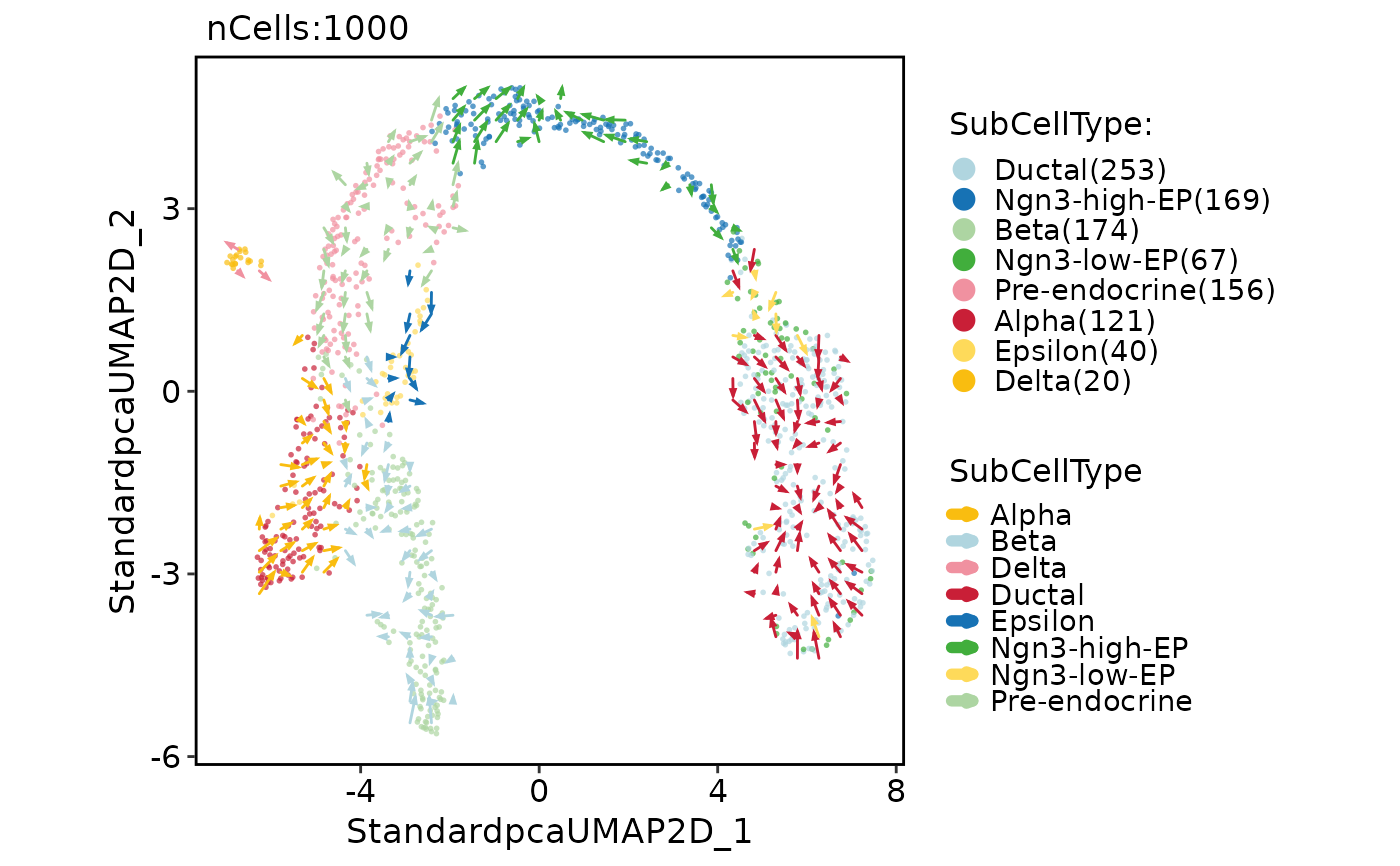
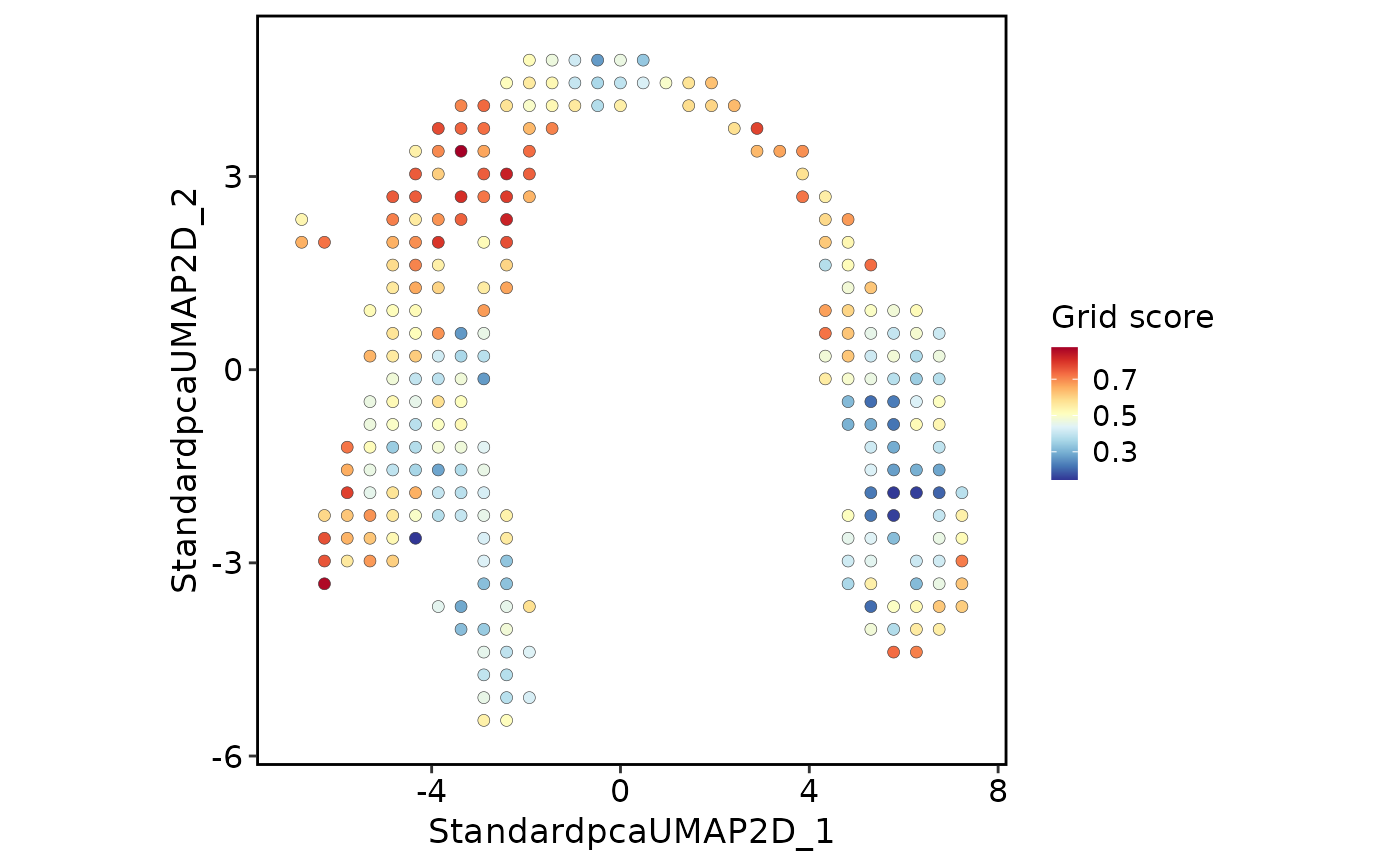
Visualize VECTOR grid-level scores or direction arrows on the embedding used
by RunVECTOR().
Usage
VECTORPlot(
  object,
  plot_type = c("grid", "raw"),
  tool_name = "VECTOR",
  score.name = "VECTOR_Score",
  group.by = NULL,
  background = c("auto", "score", "group", "none"),
  pt.size = NULL,
  point.size = NULL,
  pt.alpha = 0.7,
  point.alpha = NULL,
  grid.size = 2,
  arrow.linewidth = 0.5,
  arrow.length = grid::unit(0.035, "inches"),
  arrow.angle = 20,
  arrow.color = "grey20",
  title = NULL,
  subtitle = NULL,
  xlab = NULL,
  ylab = NULL,
  aspect.ratio = 1,
  legend.position = "right",
  legend.direction = "vertical",
  theme_use = "theme_scop",
  theme_args = list(),
  ...
)
Arguments
- object
A
Seuratobject processed byRunVECTOR().- plot_type
Plot type.
"grid"colors occupied grid centers by grid score, and"raw"draws VelocityPlot-style grid arrows.- tool_name
Name used in
srt@tools.- score.name
Metadata column containing VECTOR scores.
- group.by
Optional metadata column used as the background cell color for direction-field plots.
- background
Background for plots.
"score"usesFeatureDimPlot(),"group"usesCellDimPlot()and requiresgroup.by, and"none"draws the flow field without cell points.- pt.size
Cell point size. If
NULL, uses the same default asFeatureDimPlot().- point.size, point.alpha
Deprecated alias(es) for
pt.size/pt.alpha; supply exactly one of the two. It will be removed in scop 1.0.0.- pt.alpha
Cell point alpha.
- grid.size
Grid-center point size.
- arrow.linewidth
Direction arrow line width.
- arrow.length
Arrow head length passed to
grid::arrow().- arrow.angle
Arrow head angle passed to
grid::arrow().- arrow.color
Direction arrow color.
- title, subtitle, xlab, ylab
Plot labels. By default no title is shown.
- aspect.ratio
Fixed aspect ratio.
- legend.position, legend.direction
Legend position and direction.
- theme_use, theme_args
Theme function and arguments.
- ...
Additional arguments passed to
FeatureDimPlot()orCellDimPlot()when a cell background is requested.
Examples
data(pancreas_sub)
pancreas_sub <- RunStandardWorkflow(pancreas_sub)
#> ℹ [2026-10-11 23:59:57] Start standard processing workflow...
#> ℹ [2026-10-11 23:59:57] Checking a list of <Seurat>...
#> ! [2026-10-11 23:59:57] Data 1/1 of the `srt_list` is "unknown"
#> ℹ [2026-10-11 23:59:57] Perform `NormalizeData()` with `normalization.method = 'LogNormalize'` on 1/1 of `srt_list`...
#> ℹ [2026-10-11 23:59:57] Perform `FindVariableFeatures()` on 1/1 of `srt_list`...
#> ℹ [2026-10-11 23:59:57] Use the separate HVF from `srt_list`
#> ℹ [2026-10-11 23:59:57] Number of available HVF: 2000
#> ℹ [2026-10-11 23:59:57] Finished check
#> ℹ [2026-10-11 23:59:57] Perform `ScaleData()`
#> ℹ [2026-10-11 23:59:57] Perform pca linear dimension reduction
#> ℹ [2026-10-11 23:59:58] Use stored estimated dimensions 1:23 for Standardpca
#> ℹ [2026-10-11 23:59:58] Perform `Seurat::FindClusters()` with `cluster_algorithm = 'louvain'` and `cluster_resolution = 0.6`
#> ℹ [2026-10-11 23:59:58] Reorder clusters...
#> ℹ [2026-10-11 23:59:58] Skip `log1p()` because `layer = data` is not "counts"
#> ℹ [2026-10-11 23:59:58] Perform umap nonlinear dimension reduction
#> ✔ [2026-10-12 00:00:06] Standard processing workflow completed
pancreas_sub <- RunVECTOR(pancreas_sub, verbose = FALSE)
VECTORPlot(pancreas_sub, plot_type = "grid")
 VECTORPlot(pancreas_sub, plot_type = "raw", group.by = "SubCellType")