Benchmark single-cell integration methods
Source:R/RunIntegrationBenchmark.R
RunIntegrationBenchmark.RdRun one or more RunIntegration() methods on the same input, score each
latent embedding with scIB-style batch-correction and bio-conservation
metrics (scaled iLISI/cLISI, ASW, graph connectivity, ARI/NMI), and store
the tables in srt@tools$IntegrationBenchmark. The object itself is
returned so later plotting can reuse the embeddings and per-cell LISI
scores.
Usage
RunIntegrationBenchmark(
  object,
  batch,
  celltype = NULL,
  methods = c("Uncorrected", "Harmony"),
  linear_reduction = "pca",
  nHVF = 2000,
  linear_reduction_dims = 50,
  linear_reduction_dims_use = NULL,
  nonlinear_reduction = "umap",
  perplexity = 30,
  k_graph = 15,
  bio_weight = 0.6,
  batch_weight = 0.4,
  skip_failed = TRUE,
  tool_name = "IntegrationBenchmark",
  verbose = TRUE,
  ...,
  srt = NULL
)
Arguments
- object
A
Seuratobject containing a batch column.- batch
Metadata column used as the technical batch.
- celltype
Optional metadata column used as biological labels.
- methods
Integration methods passed to
RunIntegration().- linear_reduction
Linear reduction (
"pca","svd","ica","nmf","mds","glmpca").- nHVF
Number of highly variable features.
- linear_reduction_dims
Total number of dimensions to compute and store for
linear_reduction.- linear_reduction_dims_use
Dimensions used downstream.
NULLuses estimated dimensions, else the first 50.- nonlinear_reduction
Nonlinear reduction (
"umap","umap-naive","tsne","dm","phate","pacmap","trimap","largevis","fr").- perplexity
Neighborhood size for
RunLISI().- k_graph
Neighbor size for graph connectivity.
- bio_weight, batch_weight
Weights used for the overall score. Defaults follow scIB (
0.6bio conservation,0.4batch correction).- skip_failed
Whether a failed method is recorded and skipped.
- tool_name
Name of the
srt@toolsentry used to store the tables.- verbose
Whether to print the message. Default is
TRUE.- ...
The message to print.
- srt
Deprecated alias for
object; supply exactly one of the two. It will be removed in scop 1.0.0.
Value
The input Seurat object with integration reductions, per-cell
LISI columns, and srt@tools[[tool_name]] containing summary, metrics,
and runs. Print the tables with thisplot::print_colored_table().
Examples
data(panc8_sub)
panc8_sub <- RunIntegrationBenchmark(
panc8_sub,
batch = "tech",
celltype = "celltype",
methods = c("Uncorrected", "Harmony"),
nHVF = 500,
linear_reduction_dims = 20,
linear_reduction_dims_use = 1:10,
perplexity = 10
)
#> ℹ [2026-10-11 23:38:07] Benchmark integration method "Uncorrected"
#> ◌ [2026-10-11 23:38:07] Run integration workflow...
#> ℹ [2026-10-11 23:38:07] Split `srt_merge` into `srt_list` by "tech"
#> ℹ [2026-10-11 23:38:07] Checking a list of <Seurat>...
#> ! [2026-10-11 23:38:07] Data 1/5 of the `srt_list` is "unknown"
#> ℹ [2026-10-11 23:38:07] Perform `NormalizeData()` with `normalization.method = 'LogNormalize'` on 1/5 of `srt_list`...
#> ℹ [2026-10-11 23:38:08] Perform `FindVariableFeatures()` on 1/5 of `srt_list`...
#> ! [2026-10-11 23:38:08] Data 2/5 of the `srt_list` is "unknown"
#> ℹ [2026-10-11 23:38:08] Perform `NormalizeData()` with `normalization.method = 'LogNormalize'` on 2/5 of `srt_list`...
#> ℹ [2026-10-11 23:38:08] Perform `FindVariableFeatures()` on 2/5 of `srt_list`...
#> ! [2026-10-11 23:38:08] Data 3/5 of the `srt_list` is "unknown"
#> ℹ [2026-10-11 23:38:08] Perform `NormalizeData()` with `normalization.method = 'LogNormalize'` on 3/5 of `srt_list`...
#> ℹ [2026-10-11 23:38:08] Perform `FindVariableFeatures()` on 3/5 of `srt_list`...
#> ! [2026-10-11 23:38:08] Data 4/5 of the `srt_list` is "unknown"
#> ℹ [2026-10-11 23:38:08] Perform `NormalizeData()` with `normalization.method = 'LogNormalize'` on 4/5 of `srt_list`...
#> ℹ [2026-10-11 23:38:08] Perform `FindVariableFeatures()` on 4/5 of `srt_list`...
#> ! [2026-10-11 23:38:08] Data 5/5 of the `srt_list` is "unknown"
#> ℹ [2026-10-11 23:38:08] Perform `NormalizeData()` with `normalization.method = 'LogNormalize'` on 5/5 of `srt_list`...
#> ℹ [2026-10-11 23:38:08] Perform `FindVariableFeatures()` on 5/5 of `srt_list`...
#> ℹ [2026-10-11 23:38:08] Use the separate HVF from `srt_list`
#> ℹ [2026-10-11 23:38:08] Number of available HVF: 500
#> ℹ [2026-10-11 23:38:09] Finished check
#> ℹ [2026-10-11 23:38:10] Perform Uncorrected integration
#> ℹ [2026-10-11 23:38:11] Perform `Seurat::ScaleData()`
#> ℹ [2026-10-11 23:38:11] Perform "pca" linear dimension reduction
#> ℹ [2026-10-11 23:38:11] Adjust neighbor k from 20 to 20 for small-sample clustering
#> ℹ [2026-10-11 23:38:12] Perform `Seurat::FindClusters()` with "louvain"
#> ℹ [2026-10-11 23:38:12] Reorder clusters...
#> ℹ [2026-10-11 23:38:12] Skip `log1p()` because `layer = data` is not "counts"
#> ℹ [2026-10-11 23:38:12] Perform umap nonlinear dimension reduction using Uncorrectedpca (1:10)
#> ℹ [2026-10-11 23:38:18] Perform umap nonlinear dimension reduction using Uncorrectedpca (1:10)
#> ℹ [2026-10-11 23:38:24] Perform umap nonlinear dimension reduction using Uncorrectedpca (1:10)
#> ✔ [2026-10-11 23:38:31] Uncorrected integration completed
#> ℹ [2026-10-11 23:38:31] Compute LISI scores from reduction "Uncorrectedpca"
#> ✔ [2026-10-11 23:38:31] Stored LISI scores in metadata: "Uncorrected_tech_LISI" and "Uncorrected_celltype_LISI"
#> ℹ [2026-10-11 23:38:31] Benchmark integration method "Harmony"
#> ◌ [2026-10-11 23:38:31] Run integration workflow...
#> ℹ [2026-10-11 23:38:32] Split `srt_merge` into `srt_list` by "tech"
#> ℹ [2026-10-11 23:38:32] Checking a list of <Seurat>...
#> ℹ [2026-10-11 23:38:33] Data 1/5 of the `srt_list` has been log-normalized
#> ℹ [2026-10-11 23:38:33] Perform `FindVariableFeatures()` on 1/5 of `srt_list`...
#> ℹ [2026-10-11 23:38:33] Data 2/5 of the `srt_list` has been log-normalized
#> ℹ [2026-10-11 23:38:33] Perform `FindVariableFeatures()` on 2/5 of `srt_list`...
#> ℹ [2026-10-11 23:38:33] Data 3/5 of the `srt_list` has been log-normalized
#> ℹ [2026-10-11 23:38:33] Perform `FindVariableFeatures()` on 3/5 of `srt_list`...
#> ℹ [2026-10-11 23:38:33] Data 4/5 of the `srt_list` has been log-normalized
#> ℹ [2026-10-11 23:38:33] Perform `FindVariableFeatures()` on 4/5 of `srt_list`...
#> ℹ [2026-10-11 23:38:34] Data 5/5 of the `srt_list` has been log-normalized
#> ℹ [2026-10-11 23:38:34] Perform `FindVariableFeatures()` on 5/5 of `srt_list`...
#> ℹ [2026-10-11 23:38:34] Use the separate HVF from `srt_list`
#> ℹ [2026-10-11 23:38:34] Number of available HVF: 500
#> ℹ [2026-10-11 23:38:34] Finished check
#> ℹ [2026-10-11 23:38:34] Perform `Seurat::ScaleData()`
#> ℹ [2026-10-11 23:38:34] Perform linear dimension reduction("pca")
#> ℹ [2026-10-11 23:38:34] Perform Harmony integration
#> ℹ [2026-10-11 23:38:34] Using "Harmonypca" (1:10) as input
#> ℹ [2026-10-11 23:38:35] Adjust neighbor k from 20 to 20 for small-sample clustering
#> ℹ [2026-10-11 23:38:35] Perform `Seurat::FindClusters()` with "louvain"
#> ℹ [2026-10-11 23:38:35] Reorder clusters...
#> ℹ [2026-10-11 23:38:35] Skip `log1p()` because `layer = data` is not "counts"
#> ℹ [2026-10-11 23:38:35] Perform umap nonlinear dimension reduction using Harmony (1:10)
#> ℹ [2026-10-11 23:38:41] Perform umap nonlinear dimension reduction using Harmony (1:10)
#> ℹ [2026-10-11 23:38:47] Perform umap nonlinear dimension reduction using Harmonypca (1:10)
#> ✔ [2026-10-11 23:38:53] Harmony integration completed
#> ℹ [2026-10-11 23:38:53] Compute LISI scores from reduction "Harmony"
#> ✔ [2026-10-11 23:38:54] Stored LISI scores in metadata: "Harmony_tech_LISI" and "Harmony_celltype_LISI"
thisplot::print_colored_table(
panc8_sub@tools$IntegrationBenchmark$summary,
by = "row",
palette = "Chinese"
)
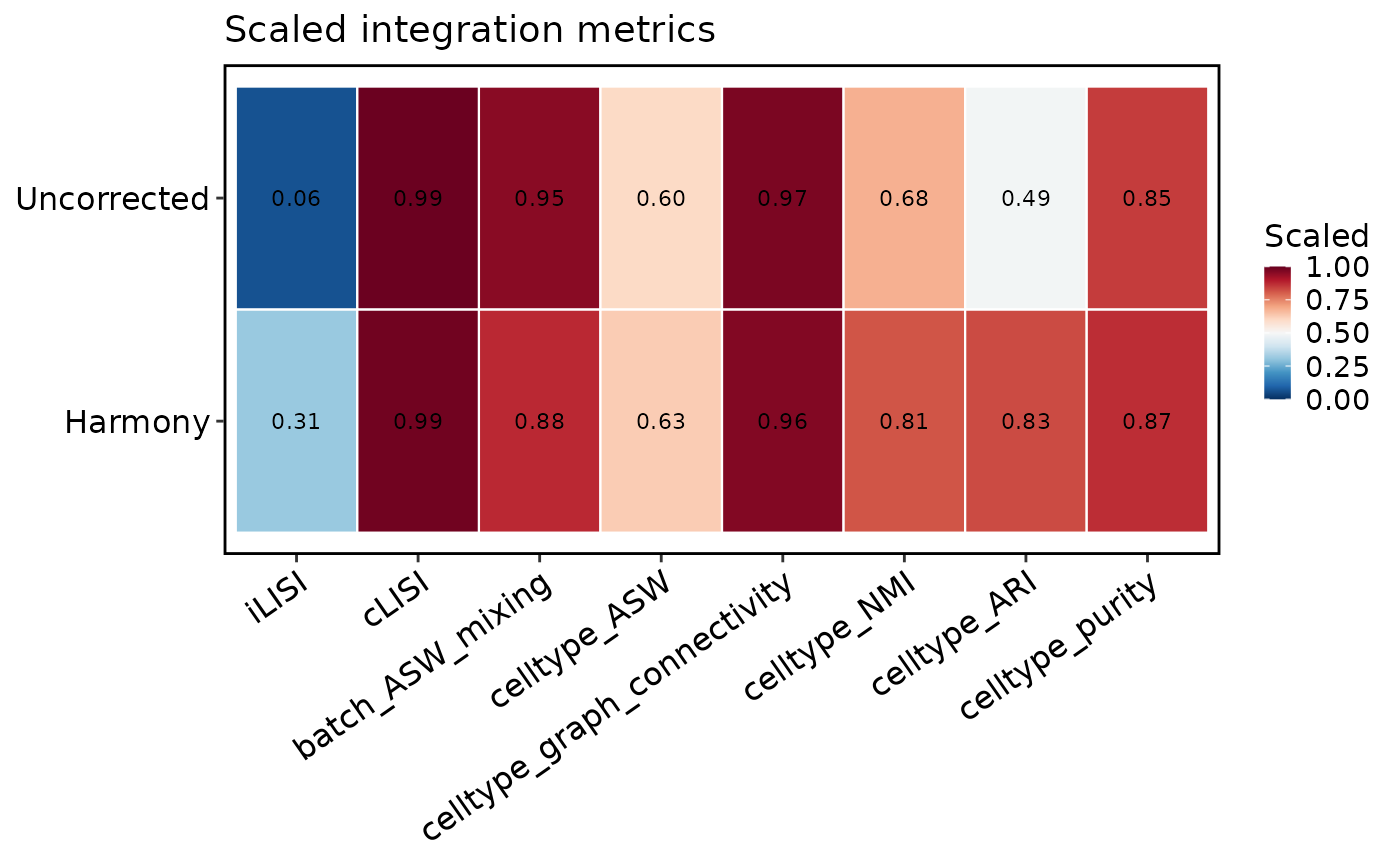
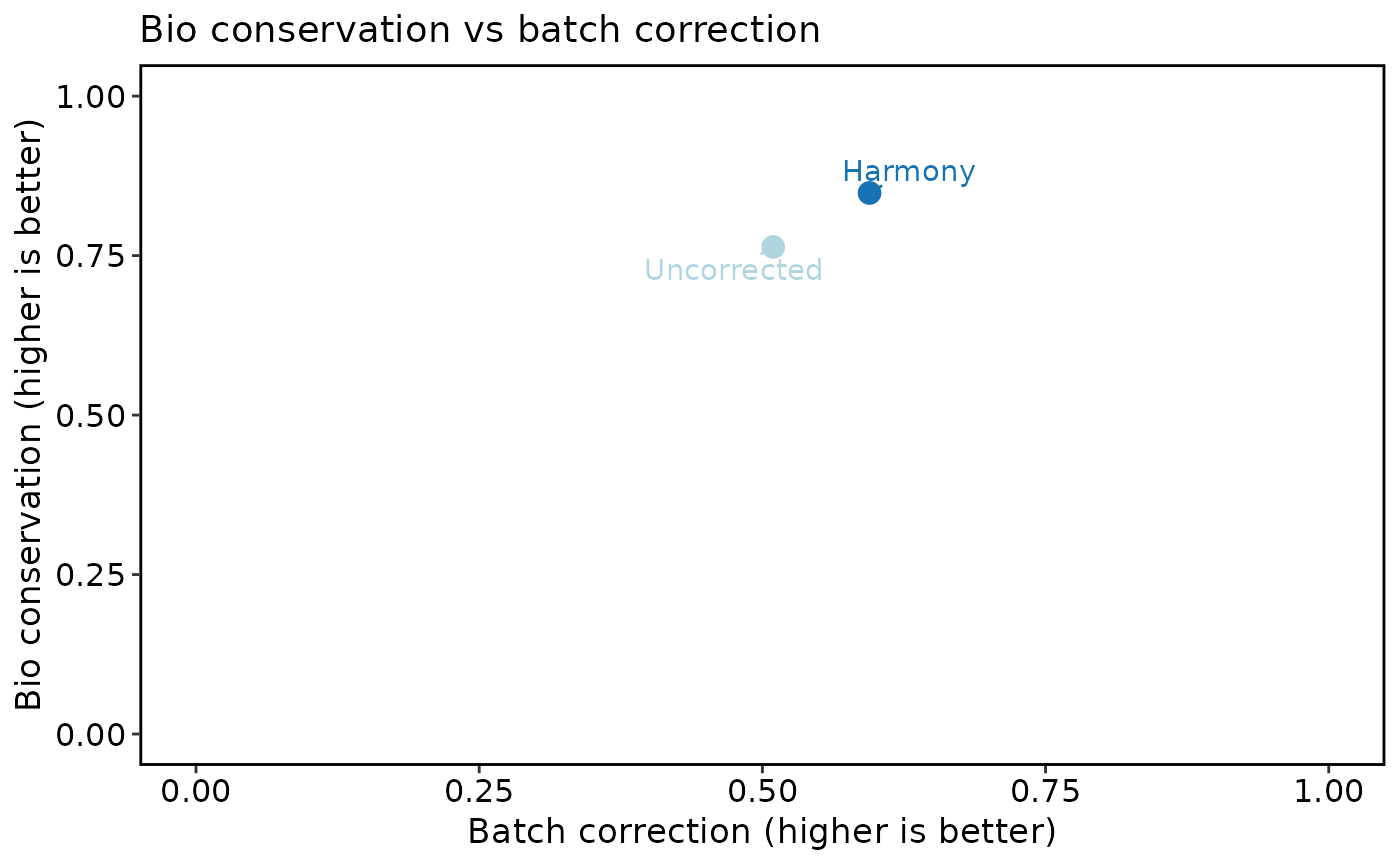
#> method status overall bio batch iLISI cLISI celltype_ASW batch_ASW_mixing celltype_graph_connectivity celltype_ARI celltype_NMI runtime_s latent umap
#> Uncorrected success 0.6619507 0.7635502 0.5095514 0.06465419 0.9940998 0.5987165 0.9544486 0.9724301 0.4879958 0.6786843 24.247 Uncorrectedpca UncorrectedUMAP2D
#> Harmony success 0.7467326 0.8481556 0.5945980 0.31237004 0.9864901 0.6264387 0.8768259 0.9628357 0.8281797 0.8149896 22.641 Harmony HarmonyUMAP2D
thisplot::print_colored_table(
panc8_sub@tools$IntegrationBenchmark$metrics,
by = "col",
palette = "Paired"
)
#> metric category value scaled direction method
#> batch_ASW_mixing batch 0.9544486 0.95444859 higher Uncorrected
#> celltype_ASW bio 0.1974331 0.59871653 higher Uncorrected
#> celltype_graph_connectivity bio 0.9724301 0.97243007 higher Uncorrected
#> celltype_NMI bio 0.6786843 0.67868425 higher Uncorrected
#> celltype_ARI bio 0.4879958 0.48799584 higher Uncorrected
#> celltype_purity bio 0.8493750 0.84937500 higher Uncorrected
#> tech_LISI_mean other 1.2586167 1.25861674 higher Uncorrected
#> celltype_LISI_mean other 1.0708024 1.07080240 higher Uncorrected
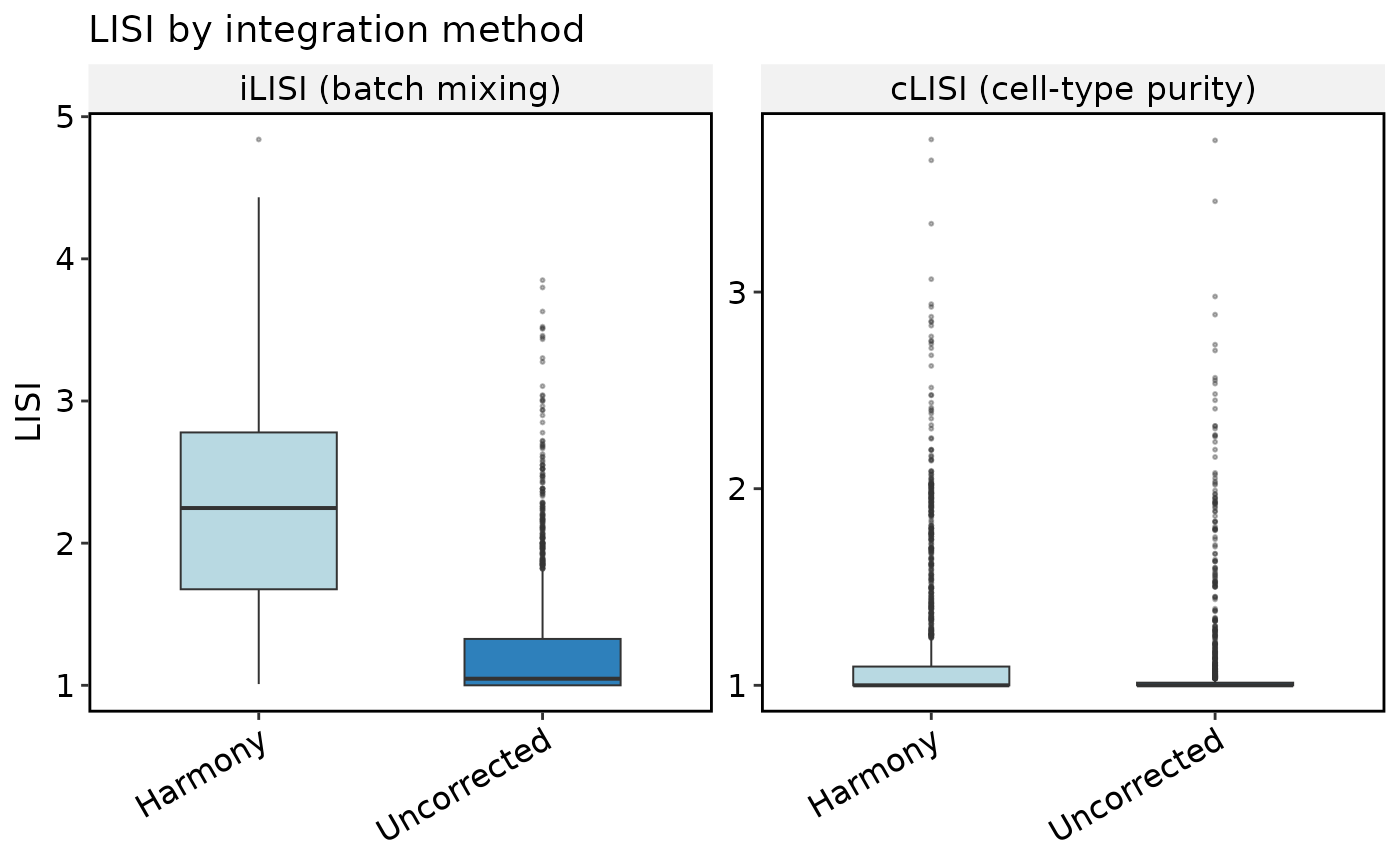
#> iLISI batch 1.2586167 0.06465419 higher Uncorrected
#> cLISI bio 1.0708024 0.99409980 higher Uncorrected
#> batch_ASW_mixing batch 0.8768259 0.87682592 higher Harmony
#> celltype_ASW bio 0.2528773 0.62643867 higher Harmony
#> celltype_graph_connectivity bio 0.9628357 0.96283573 higher Harmony
#> celltype_NMI bio 0.8149896 0.81498959 higher Harmony
#> celltype_ARI bio 0.8281797 0.82817974 higher Harmony
#> celltype_purity bio 0.8700000 0.87000000 higher Harmony
#> tech_LISI_mean other 2.2494802 2.24948016 higher Harmony
#> celltype_LISI_mean other 1.1621187 1.16211874 higher Harmony
#> iLISI batch 2.2494802 0.31237004 higher Harmony
#> cLISI bio 1.1621187 0.98649011 higher Harmony
IntegrationBenchmarkPlot(panc8_sub)
#> $box
 #>
#> $heatmap
#>
#> $heatmap
 #>
#> $scatter
#>
#> $scatter
 #>
#> $umap
#>
#> $umap
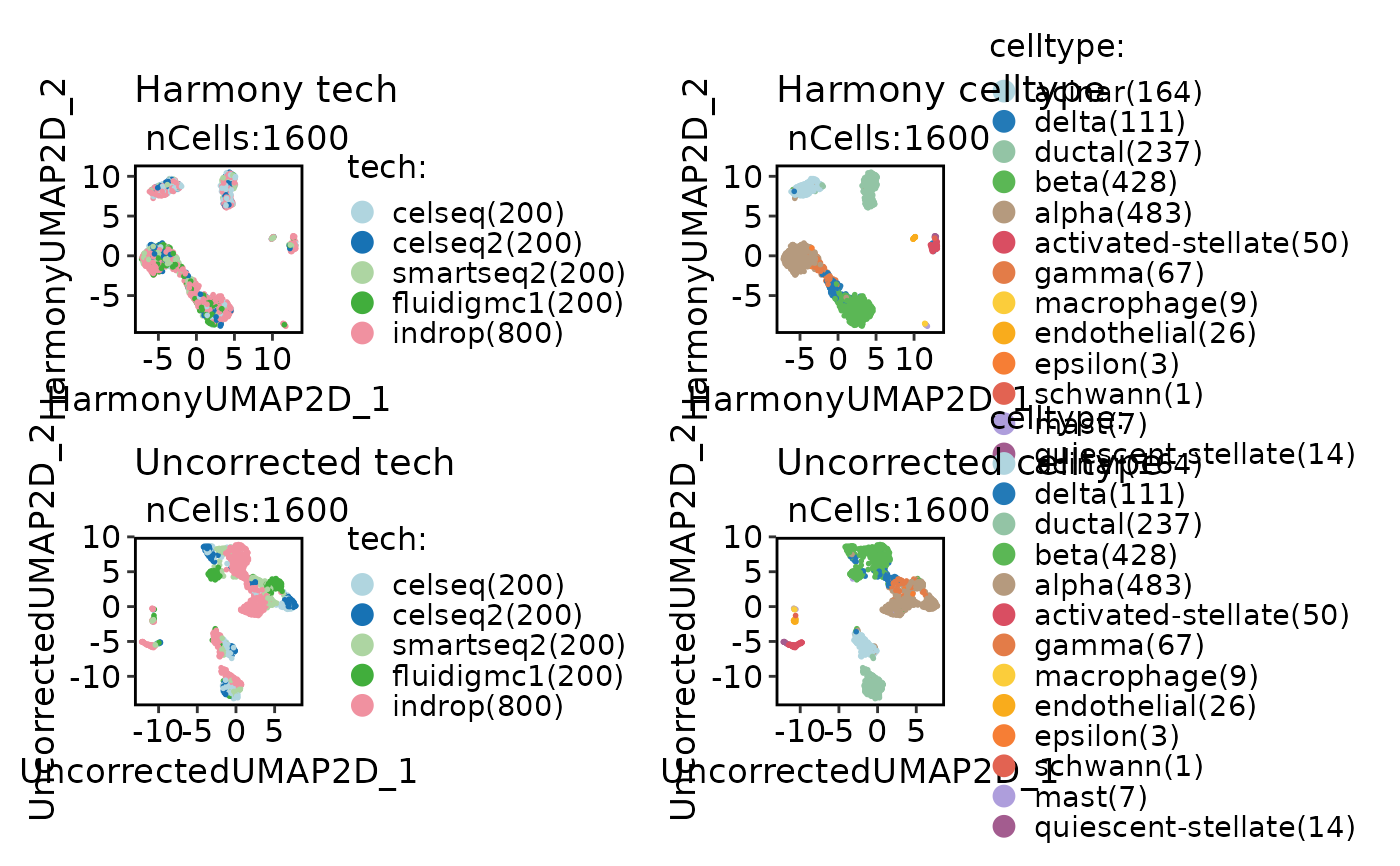 #>
IntegrationBenchmarkPlot(panc8_sub, plot_type = "box")
#>
IntegrationBenchmarkPlot(panc8_sub, plot_type = "box")