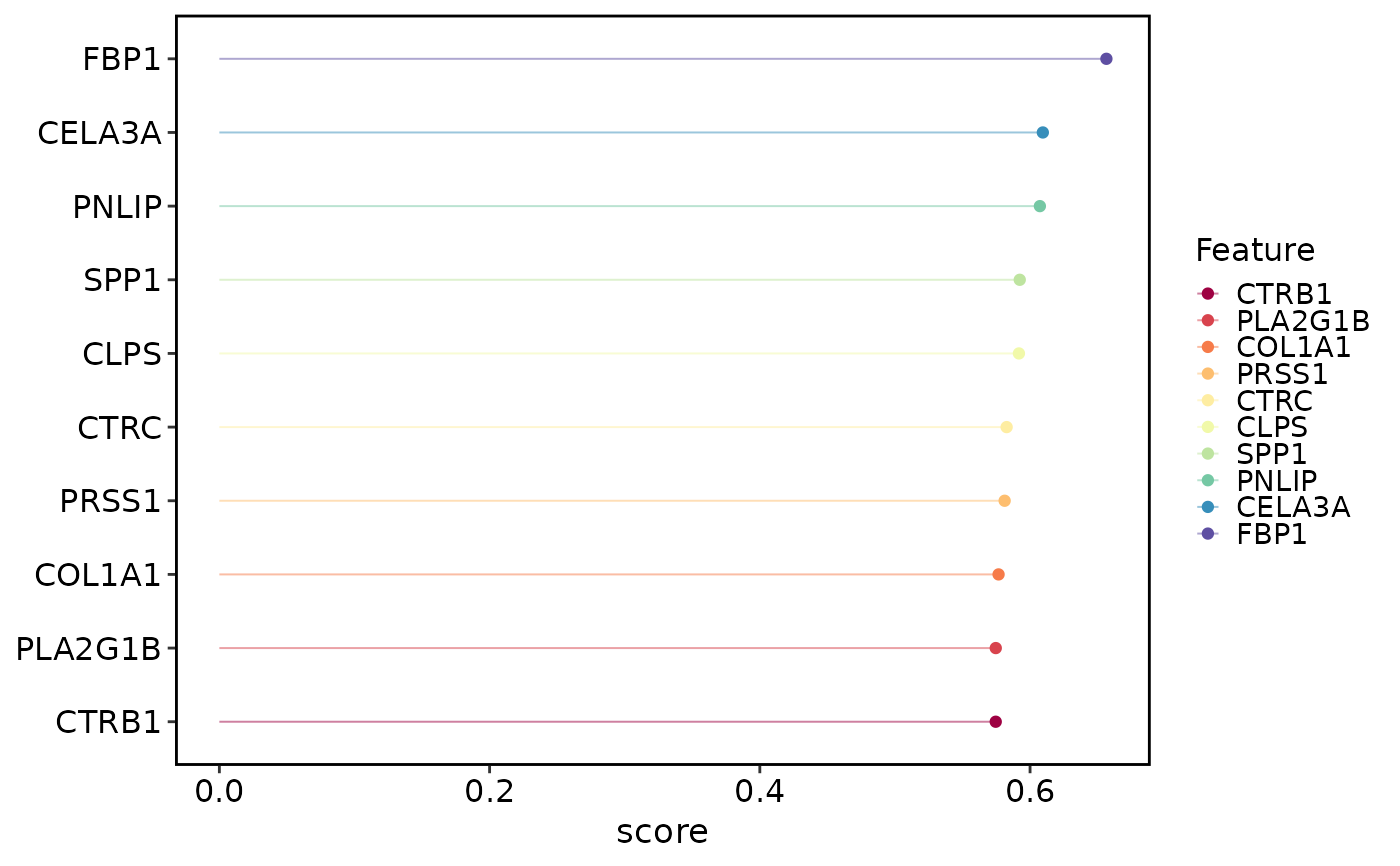
Plot spatial variable feature results
Source:R/RunSpatialVariableFeatures.R
SpatialVariableFeaturePlot.RdVisualize normalized results produced by RunSpatialVariableFeatures(). The
summary view shows feature ranks and, when finite p- or q-values are stored,
significance. Results without permutation statistics are shown without a
significance size mapping or legend. The surface view reuses
SpatialSpotPlot() to draw spatial expression for selected features. Unless
explicitly overridden, surfaces inherit the saved assay, layer, image and
coordinate columns, even if the object's default assay has changed.
Usage
SpatialVariableFeaturePlot(
  object = NULL,
  plot_type = c("summary", "surface", "combined"),
  features = NULL,
  nfeatures = 10,
  score_col = "score",
  assay = NULL,
  layer = NULL,
  image = NULL,
  overlay_image = TRUE,
  image.alpha = 1,
  coord.cols = c("col", "row"),
  flip.y = TRUE,
  pt.size = NULL,
  pt.alpha = 0.9,
  stroke = 0.1,
  palette = "Spectral",
  palcolor = NULL,
  legend.position = "right",
  theme_use = "theme_scop",
  theme_args = list(),
  combine = TRUE,
  nrow = NULL,
  ncol = NULL,
  byrow = TRUE,
  srt = NULL,
  image.scale = c("lowres", "hires")
)
Arguments
- object
A
Seuratobject.- plot_type
Plot type:
"summary","surface", or"combined".- features
Features to plot. If
NULL, top features from the stored spatial variable feature result are used.- nfeatures
Number of top features used when
features = NULL.- score_col
Result column used for the summary x-axis.
- assay, layer
Expression assay and layer for surfaces. When
NULL, use the saved analysis settings; explicit values override them.- image
Image for surfaces. When
NULL, use the saved analysis image.- overlay_image, image.alpha
Draw the spatial image beneath spots.
- coord.cols
Metadata coordinate columns for surfaces. When omitted, use the saved analysis columns.
- flip.y
Reverse the y axis for metadata or FOV coordinates without a raster image. The default
FALSEagrees with spatial networks and cell boundaries. Raster-backed display coordinates already include their flip.- pt.size, pt.alpha
Point size and transparency.
pt.size = NULLscales withsqrt(n)(minimum0.3). Rasterized points keep at least a two-pixel radius atraster.dpi = c(512, 512)and scale withraster.dpi.- stroke
Point border width.
- palette, palcolor
Palette name (thisplot::show_palettes) or custom colors.
- legend.position
Legend position for surface plots.
- theme_use
Theme name or function.
- theme_args
Theme name or function, plus extra theme arguments.
- combine, nrow, ncol, byrow
Combine plots with patchwork::patchwork.
combine = FALSEreturns a list of ggplots.- srt
Deprecated alias for
object; supply exactly one of the two. It will be removed in scop 1.0.0.- image.scale
Image scale factor matching the raster stored in the selected image. Use
"hires"for a hires raster; do not modify Seurat scale-factor slots.
Examples
data(visium_human_pancreas_sub)
spatial <- Seurat::NormalizeData(
  visium_human_pancreas_sub,
  assay = "Spatial",
  verbose = FALSE
)
spatial <- RunSpatialVariableFeatures(
  object = spatial,
  assay = "Spatial",
  nfeatures = 10,
  verbose = FALSE
)
SpatialVariableFeaturePlot(object = spatial, plot_type = "summary")