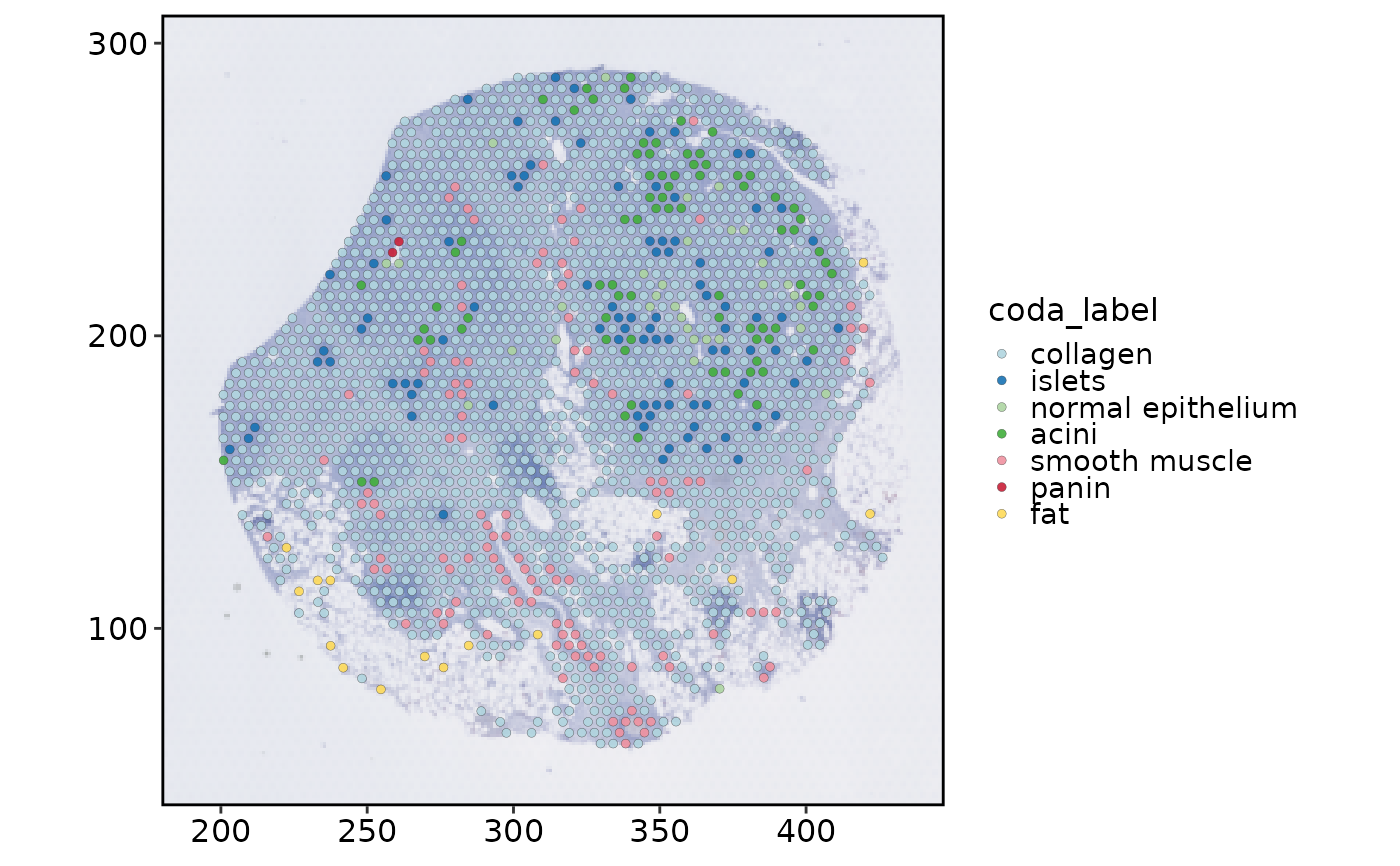
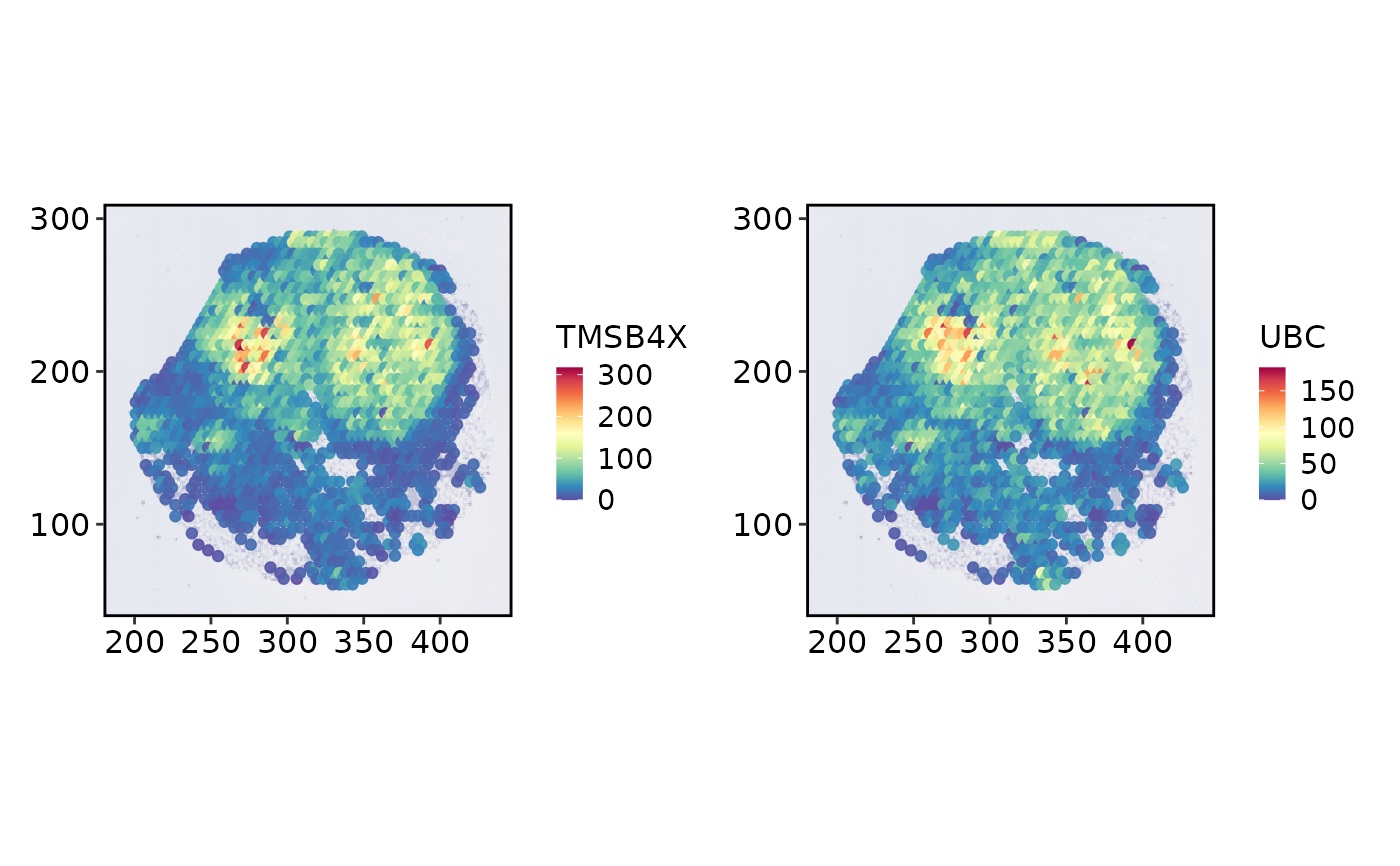
Spatial spot plot
Usage
SpatialSpotPlot(
  srt,
  group.by = NULL,
  features = NULL,
  assay = NULL,
  layer = "data",
  values = NULL,
  plot_type = c("point", "pie"),
  plot.data = NULL,
  spot.by = NULL,
  color.by = NULL,
  geom = c("point", "jitter"),
  image = NULL,
  overlay_image = TRUE,
  image.alpha = 1,
  crop = TRUE,
  coord.cols = c("col", "row"),
  flip.y = TRUE,
  show_axes = FALSE,
  split.by = NULL,
  cells = NULL,
  show_na = FALSE,
  pt.size = NULL,
  pie.radius = NULL,
  pie.radius.scale = 0.45,
  pt.alpha = 0.9,
  stroke = 0.1,
  jitter_width = 0.25,
  jitter_height = 0.25,
  palette = "Spectral",
  palcolor = NULL,
  bg_color = "grey20",
  legend.position = "right",
  legend.direction = "vertical",
  legend.title = NULL,
  theme_use = "theme_scop",
  theme_args = list(),
  combine = TRUE,
  nrow = NULL,
  ncol = NULL,
  byrow = TRUE,
  verbose = TRUE
)
Arguments
- srt
A Seurat object.
- group.by
Metadata columns to color spots by.
- features
Features to color spots by. When provided, expression values are read from
assayandlayer.- assay
Assay used for
features. IfNULL, the default assay is used.- layer
Assay layer used for
features.- values
Optional vector, matrix, or data.frame with spot-level values. Row names or vector names must match spatial spot names.
- plot_type
Plot type.
"point"keeps the default spot plot behavior."pie"draws spot-level pies from numeric metadata columns supplied togroup.byor from a numeric matrix/data.frame supplied tovalues. Whengroup.byis a single"<prefix>_dominant_type"column, matching"<prefix>_prop_*"or"<prefix>_frac_*"numeric metadata columns are used automatically.- plot.data
Optional long-format data.frame for plotting repeated spatial points, such as cell-to-spot assignments.
- spot.by
Column in
plot.datacontaining spot names.- color.by
Column in
plot.dataused to color repeated spatial points.- geom
Geometry used for
plot.data:"point"or"jitter".- image
Name of the Seurat spatial image. If
NULL, the first image is used when present.- overlay_image
Whether to draw the spatial image beneath spots.
- image.alpha
Transparency of the spatial image.
- crop
Whether to crop the panel to plotted spots.
- coord.cols
Metadata coordinate columns used when no image is available.
- flip.y
Whether to reverse the y axis for metadata coordinates.
- show_axes
Whether to keep axis text, ticks, and grid lines. The default
FALSEis intended for polished spatial maps; setTRUEfor coordinate debugging.- split.by
Name of a column in meta.data column to split plot by. Default is
NULL.- cells
A character vector of cell names to use.
- show_na
Whether to assign a color from the color palette to NA group. If
TRUE, cell points with NA level will be colored bybg_color. IfFALSE, cell points with NA level will be removed from the plot.- pt.size
Point size.
- pie.radius, pie.radius.scale
Radius controls for
plot_type = "pie". Ifpie.radiusisNULL, the radius is estimated from spot spacing and multiplied bypie.radius.scale.- pt.alpha
Point alpha.
- stroke
Point border width.
- jitter_width, jitter_height
Jitter size used when
geom = "jitter".- palette
Color palette name. Available palettes can be found in thisplot::show_palettes. Default is
"Chinese".- palcolor
Custom colors used to create a color palette. Default is
NULL.- bg_color
Point border color.
- legend.position
The position of legends, one of
"none","left","right","bottom","top". Default is"right".- legend.direction
The direction of the legend in the plot. Can be one of
"vertical"or"horizontal".- legend.title
Title for the legend. Default is
NULL, which uses the group name.- theme_use
Theme used. Can be a character string or a theme function. Default is
"theme_scop".- theme_args
Other arguments passed to the
theme_use. Default islist().- combine
Combine plots into a single
patchworkobject. IfFALSE, return a list of ggplot objects.- nrow
Number of rows in the combined plot. Default is
NULL, which means determined automatically based on the number of plots.- ncol
Number of columns in the combined plot. Default is
NULL, which means determined automatically based on the number of plots.- byrow
Whether to arrange the plots by row in the combined plot. Default is
TRUE.- verbose
Whether to print the message. Default is
TRUE.