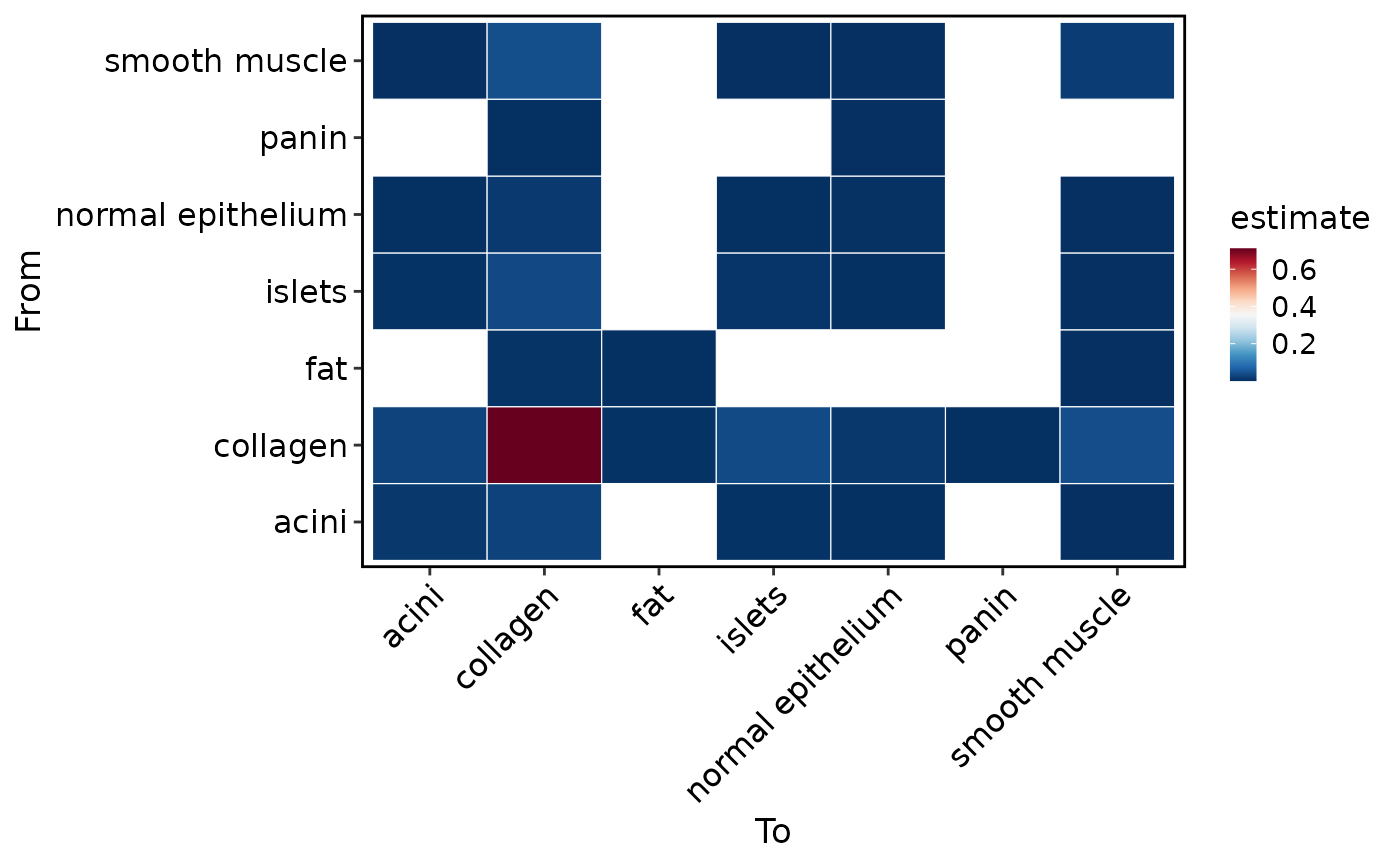
Visualize results produced by RunSpatialNeighborhood() using spatial,
statistical, and network plotting conventions.
Usage
SpatialNeighborhoodPlot(
  object,
  method = NULL,
  plot_type = c("heatmap", "network", "stat", "spatial"),
  comparison = NULL,
  condition = NULL,
  value = c("estimate", "fraction", "count"),
  FDR_threshold = 0.05,
  top_n = 30,
  layout = c("fr", "nicely", "kk", "circle", "mds"),
  edge_size = c(0.4, 2),
  cols.enriched = "#d7301f",
  cols.depleted = "#2b8cbe",
  cols.ns = "grey75",
  pair = NULL,
  image = NULL,
  overlay_image = TRUE,
  coord.cols = c("col", "row"),
  split.by = NULL,
  palette = "RdBu",
  palcolor = NULL,
  legend.position = "right",
  legend.direction = "vertical",
  legend.title = NULL,
  theme_use = "theme_scop",
  theme_args = list(),
  combine = TRUE,
  nrow = NULL,
  ncol = NULL,
  byrow = TRUE,
  seed = 11,
  verbose = TRUE,
  ...,
  image.scale = c("lowres", "hires"),
  srt = NULL,
  sample = NULL
)
Arguments
- object
A
Seuratobject.- method
Stored neighborhood method to plot. If
NULL, the active method is used.- plot_type
Plot type. One of
"heatmap","network","stat", or"spatial".- comparison, condition
Optional filters for stored result tables. Spatial plots support
conditionusing saved source-cell conditions, but rejectcomparison; use statistical plots for differential comparisons.- value
Column used as the plotted effect value. Spatial plots default to and only support
"count": saved observed outgoing edges to the target type, not a spicyR effect. Other plot types retain the"estimate"default.- sample
Optional single sample ID for non-spatial plots. Results from multiple samples require explicit selection; no samples are aggregated. Use
comparisonandconditionto resolve other repeated label pairs.- FDR_threshold
FDR cutoff used to mark significant pairs.
- top_n
Number of pairs to show for network and statistic plots.
- layout
Network layout.
- edge_size
Network edge size range.
- cols.enriched, cols.depleted, cols.ns
Colors for direction categories.
- pair
Pair to visualize for
plot_type = "spatial", either"from|to"or a length-2 character vector. Names must belong to the saved analysis and itsfrom/toscope. Evaluated source cells without matching edges have zero counts; other cells haveNA. Subsetting the object does not recompute saved counts. Valid empty edge results require an explicit pair; incomplete old results require rerunning.- image
Name of the Seurat spatial image. Required when multiple images are present; a single image is selected automatically when
NULL.- overlay_image
Whether to draw the selected spatial image for
plot_type = "spatial".- coord.cols
Metadata coordinate columns used when no Seurat image coordinates are available.
- split.by
Optional metadata column identifying conditions for differential neighborhood statistics.
- palette, palcolor
Palette name (thisplot::show_palettes) or custom colors.
- legend.position, legend.direction, legend.title
Legend placement (
"none","left","right","bottom","top"), direction, and title.legend.title = NULLuses the group name.- theme_use
Theme name or function.
- theme_args
Theme name or function, plus extra theme arguments.
- combine, nrow, ncol, byrow
Combine plots with patchwork.
combine = FALSEreturns a list of ggplots.- seed
Random seed used by layouts and jittered plot layers.
- verbose
Whether to print the message. Default is
TRUE.- ...
Additional arguments passed to the selected backend.
- image.scale
Image scale factor matching the raster stored in the selected image. Use
"hires"for a hires raster; do not modify Seurat scale-factor slots.- srt
Deprecated alias for
object; supply exactly one of the two. It will be removed in scop 1.0.0.
Examples
data(visium_human_pancreas_sub)
spatial <- visium_human_pancreas_sub
spatial <- RunSpatialNeighborhood(
  spatial,
  group.by = "coda_label",
  coord.cols = c("x", "y"),
  k = 4,
  verbose = FALSE
)

SpatialNeighborhoodPlot(
  spatial,
  plot_type = "spatial",
  overlay_image = FALSE,
  coord.cols = c("x", "y")
)