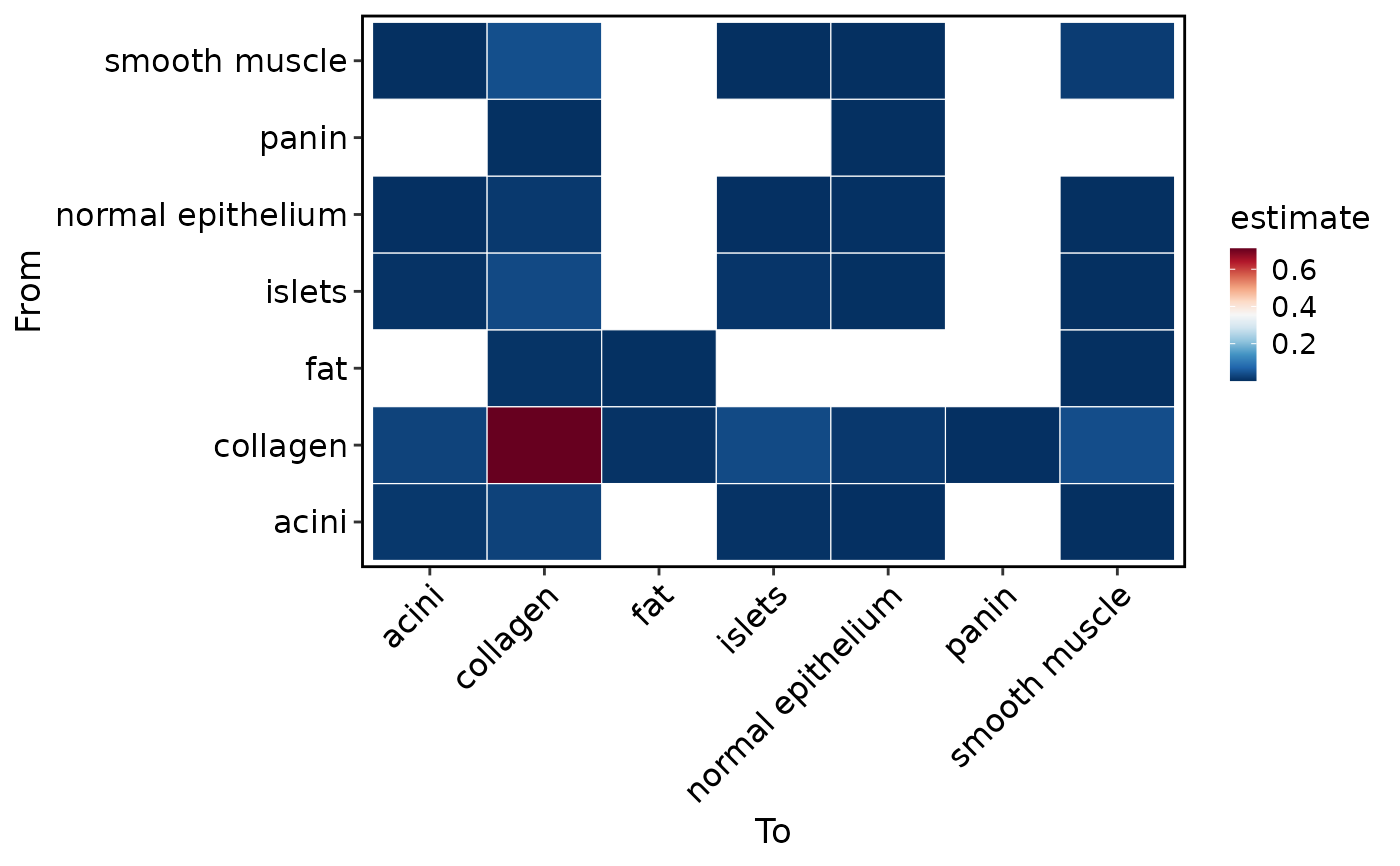
Summarize observed spatial neighborhoods or test differential spatial associations between conditions using spicyR.
Usage
RunSpatialNeighborhood(
  object,
  group.by,
  method = NULL,
  assay = NULL,
  layer = "data",
  coord.cols = c("col", "row"),
  image = NULL,
  sample.by = NULL,
  split.by = NULL,
  subject.by = NULL,
  radius = NULL,
  k = NULL,
  features = NULL,
  from = NULL,
  to = NULL,
  tool_name = "SpatialNeighborhood",
  store_results = TRUE,
  verbose = TRUE,
  coordinate_space = c("raw", "legacy_display"),
  backend = c("cpp", "r"),
  ...,
  srt = NULL
)
Arguments
- object
A
Seuratobject.- group.by
Metadata column containing spatial cell or spot labels.
- method
Neighborhood calculation.
NULLpreserves compatibility by choosing"observed"whensplit.byis absent and"spicyR"when it is supplied."observed"returns package KNN or radius summaries."spicyR"runs differential neighborhood statistics and requiressplit.by.- assay
Assay used when
featuresare requested.- layer
Assay layer used when
featuresare requested.- coord.cols
Metadata coordinate columns used when no Seurat image coordinates are available.
- image
Name of the Seurat spatial image. Required when multiple images are present; a single image is selected automatically when
NULL.- sample.by
Metadata column identifying images or samples. If
NULL, all spots are treated as one sample.- split.by
Optional metadata column identifying conditions for differential neighborhood statistics.
- subject.by
Optional metadata column identifying subjects for backends that support paired or repeated designs.
- radius
Optional spatial radius used for package neighborhood summaries, expressed in the selected coordinate units.
- k
Optional number of nearest neighbors used for package neighborhood summaries. This is a unitless count. When both
radiusandkareNULL,k = 6is used.- features
Optional features to extract into the backend input table.
- from, to
Optional cell or spot label filters.
- tool_name
Name used to store results in
srt@tools.- store_results
Whether to store results in
srt@tools.- verbose
Whether to print the message. Default is
TRUE.- coordinate_space
Coordinate system used to build neighbor distances. The default is raw acquisition coordinates;
"legacy_display"remains an explicit compatibility option.- backend
Backend for observed label-pair aggregation.
"cpp"avoids repeated data-frame aggregation;"r"retains the reference implementation. This does not alter the external"spicyR"method.- ...
Additional arguments passed to the selected backend.
- srt
Deprecated alias for
object; supply exactly one of the two. It will be removed in scop 1.0.0.
Examples
data(visium_human_pancreas_sub)
spatial <- visium_human_pancreas_sub
spatial <- RunSpatialNeighborhood(
  spatial,
  group.by = "coda_label",
  coord.cols = c("x", "y"),
  k = 4,
  verbose = FALSE
)

SpatialNeighborhoodPlot(
  spatial,
  plot_type = "spatial",
  overlay_image = FALSE,
  coord.cols = c("x", "y")
)