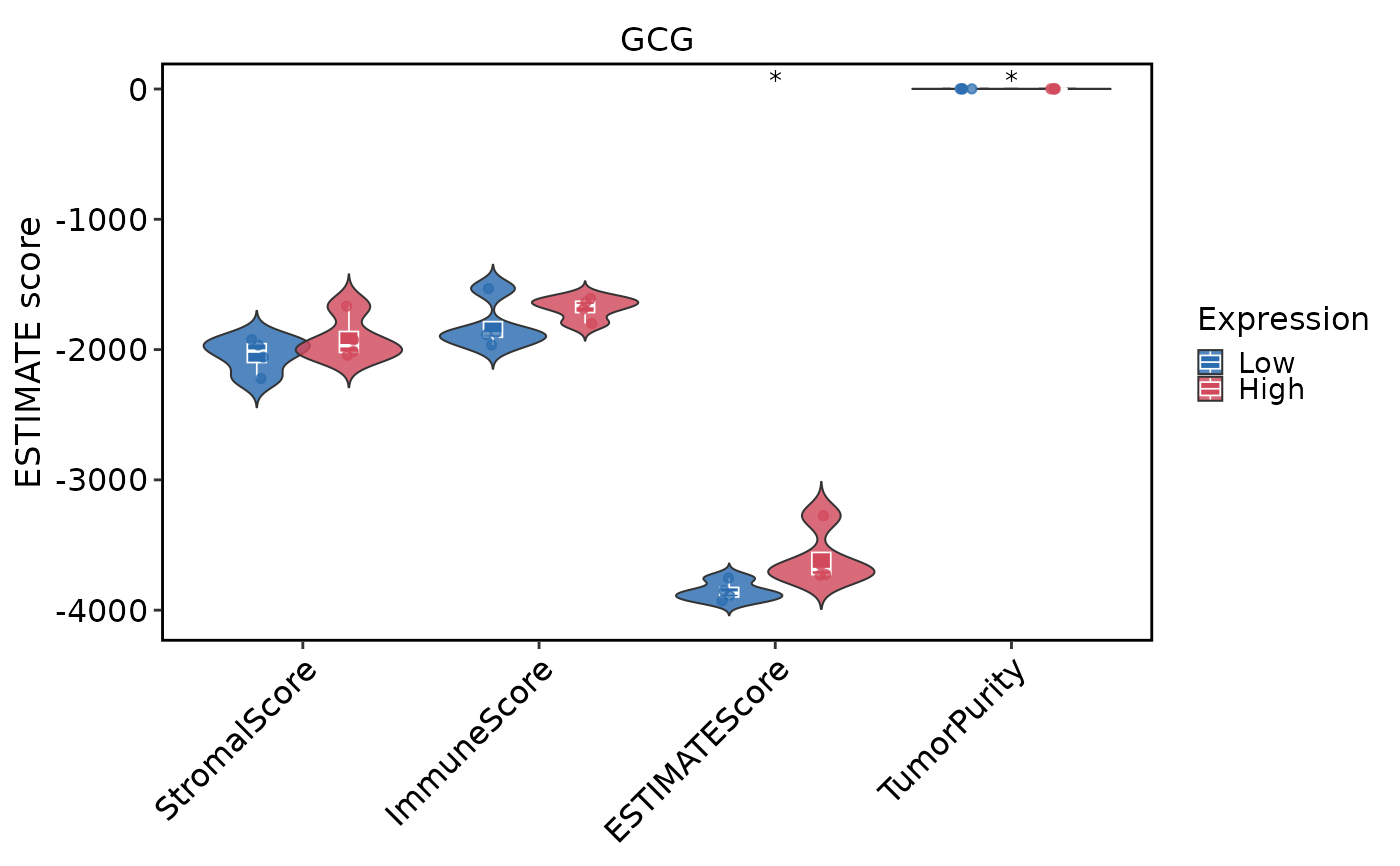
Compare ESTIMATE scores between target-gene high and low expression groups, or draw continuous gene-expression correlations with ESTIMATE scores.
Arguments
- object
Optional
RunESTIMATE()bundle,SummarizedExperiment, orSeuratobject containing ESTIMATE results.- score.data
Optional score matrix or data frame with samples in rows.
- gene.data
Optional gene expression matrix with genes in rows and samples in columns.
- features
Target genes to plot.
- assay
Assay used for `Seurat` or `SummarizedExperiment` expression.
- layer
Assay layer used for `Seurat` expression.
- plot_type
Plot type.
- split
Split method for high/low groups in violin plots.
- quantile
Quantile cutoff used when `split = "quantile"`.
- cor_method
Correlation method for scatter plots.
- add_stat
Whether to add group comparison labels to violin or box plots. Requires
ggpubr.- ...
Additional plotting arguments.
Examples
data(pancreas_sub)
pancreas_sub <- RunStandardWorkflow(pancreas_sub)
#> ℹ [2026-10-11 22:49:58] Start standard processing workflow...
#> ℹ [2026-10-11 22:49:58] Checking a list of <Seurat>...
#> ! [2026-10-11 22:49:58] Data 1/1 of the `srt_list` is "unknown"
#> ℹ [2026-10-11 22:49:58] Perform `NormalizeData()` with `normalization.method = 'LogNormalize'` on 1/1 of `srt_list`...
#> ℹ [2026-10-11 22:49:58] Perform `FindVariableFeatures()` on 1/1 of `srt_list`...
#> ℹ [2026-10-11 22:49:58] Use the separate HVF from `srt_list`
#> ℹ [2026-10-11 22:49:58] Number of available HVF: 2000
#> ℹ [2026-10-11 22:49:58] Finished check
#> ℹ [2026-10-11 22:49:58] Perform `ScaleData()`
#> ℹ [2026-10-11 22:49:58] Perform pca linear dimension reduction
#> ℹ [2026-10-11 22:49:59] Use stored estimated dimensions 1:23 for Standardpca
#> ℹ [2026-10-11 22:49:59] Perform `Seurat::FindClusters()` with `cluster_algorithm = 'louvain'` and `cluster_resolution = 0.6`
#> ℹ [2026-10-11 22:49:59] Reorder clusters...
#> ℹ [2026-10-11 22:49:59] Skip `log1p()` because `layer = data` is not "counts"
#> ℹ [2026-10-11 22:49:59] Perform umap nonlinear dimension reduction
#> ✔ [2026-10-11 22:50:06] Standard processing workflow completed
pancreas_sub <- RunESTIMATE(pancreas_sub, group.by = "SubCellType")
#> ℹ [2026-10-11 22:50:06] ESTIMATE input: 15997 genes x 8 samples
#> ℹ [2026-10-11 22:50:06] Use 8011 ESTIMATE common genes for scoring
#> ℹ [2026-10-11 22:50:06] ESTIMATE signature overlap: stromal 79, immune 77
EstimateGenePlot(
  pancreas_sub,
  features = c("GCG", "INS"),
  group.by = "SubCellType"
)