Plot deconvolution results
Usage
DeconvolutionPlot(
  object = NULL,
  res = NULL,
  plot_type = c("bar", "heatmap", "box"),
  sample_order = NULL,
  cell_type_order = NULL,
  palette = "Chinese",
  palcolor = NULL,
  heatmap_palette = "YlGnBu",
  heatmap_palcolor = NULL,
  sample_annotation = NULL,
  sample_annotation_palette = "Chinese",
  sample_annotation_palcolor = NULL,
  sample_split = NULL,
  cluster_rows = FALSE,
  cluster_columns = FALSE,
  show_row_names = TRUE,
  show_column_names = FALSE,
  theme_use = "theme_scop",
  theme_args = list(),
  legend.position = "right",
  legend.direction = "vertical",
  grid_major = FALSE,
  verbose = TRUE,
  ...
)
Arguments
- object
A
SummarizedExperimentobject containing deconvolution results inmetadata(object)[["Deconvolution"]].- res
A deconvolution result data frame. When provided,
objectis ignored.- plot_type
Plot type. One of
"bar","heatmap", or"box".- sample_order
Optional sample order.
- cell_type_order
Optional cell-type order.
- palette
Palette used for discrete cell-type colors in
"bar"and"box"modes.- palcolor
Optional custom colors for
palette.- heatmap_palette
Palette used for continuous proportions in
"heatmap"mode.- heatmap_palcolor
Optional custom colors for
heatmap_palette.- sample_annotation
Character vector of
colData(object)columns used as top annotations in"heatmap"mode.- sample_annotation_palette
Palette(s) used for
sample_annotation.- sample_annotation_palcolor
Optional custom colors for
sample_annotation_palette. Use a list when multiple annotations are provided.- sample_split
Optional
colData(object)column used to split heatmap columns for grouped comparison.- cluster_rows, cluster_columns
Whether to cluster rows or columns in
"heatmap"mode.- show_row_names, show_column_names
Whether to show row or column names in
"heatmap"mode.- theme_use, theme_args
Theme name or function, plus extra theme arguments.
- legend.position
Legend placement (
"none","left","right","bottom","top"), direction, and title.legend.title = NULLuses the group name.- legend.direction
Legend direction:
"horizontal"or"vertical".- grid_major
Whether to show major grid lines for
"bar"and"box"plots.- verbose
Whether to print the message. Default is
TRUE.- ...
Reserved for future use.
Value
A ggplot object.
For plot_type = "heatmap", returns a ComplexHeatmap::Heatmap object.
Examples
data(islet_bulk)
islet_bulk <- RunDeconvolution(
islet_bulk,
method = "CIBERSORT",
backend = "cpp",
perm = 0
)
#> ℹ [2026-10-11 22:44:25] Use 400 shared genes for CIBERSORT
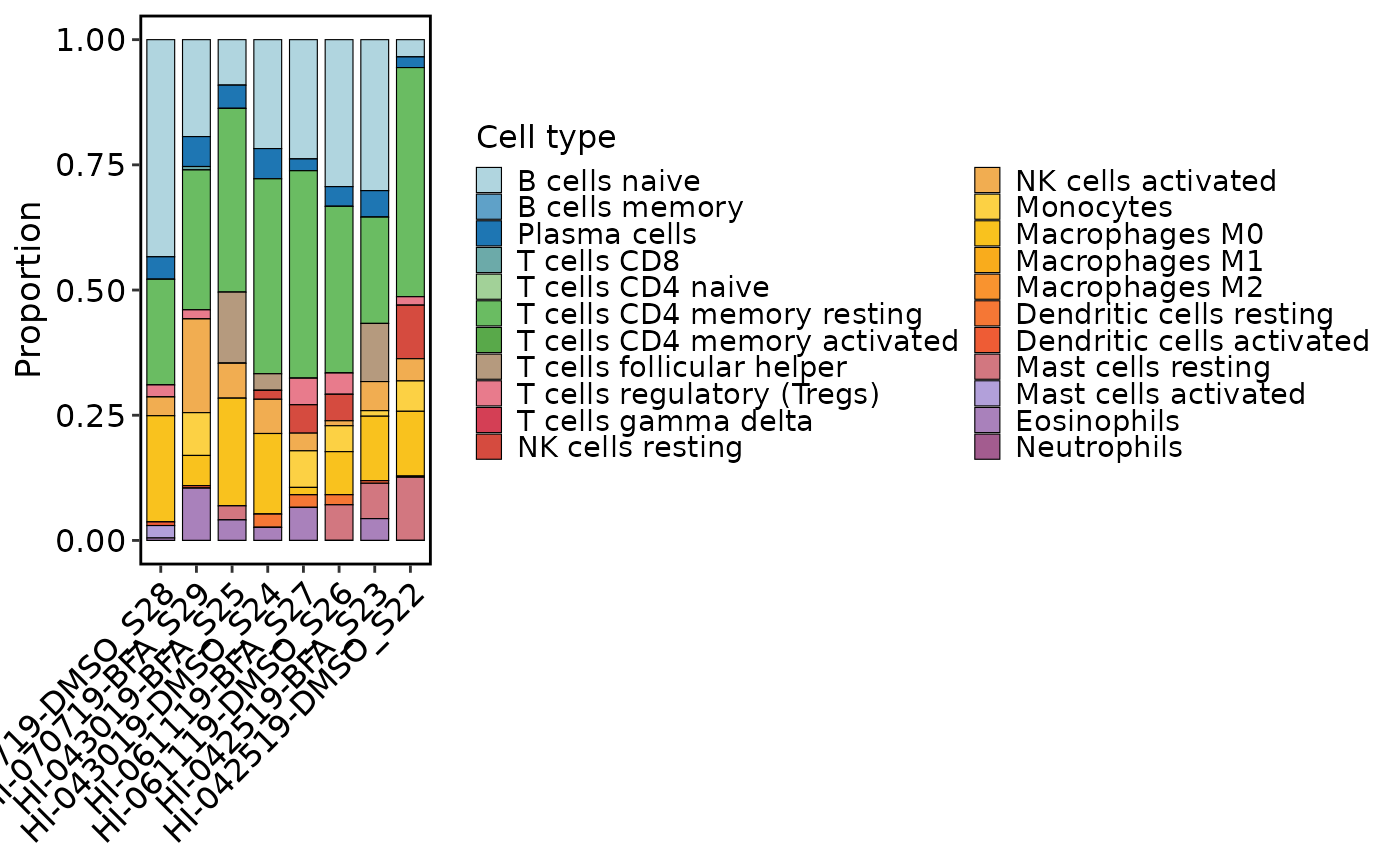
DeconvolutionPlot(islet_bulk, plot_type = "bar")
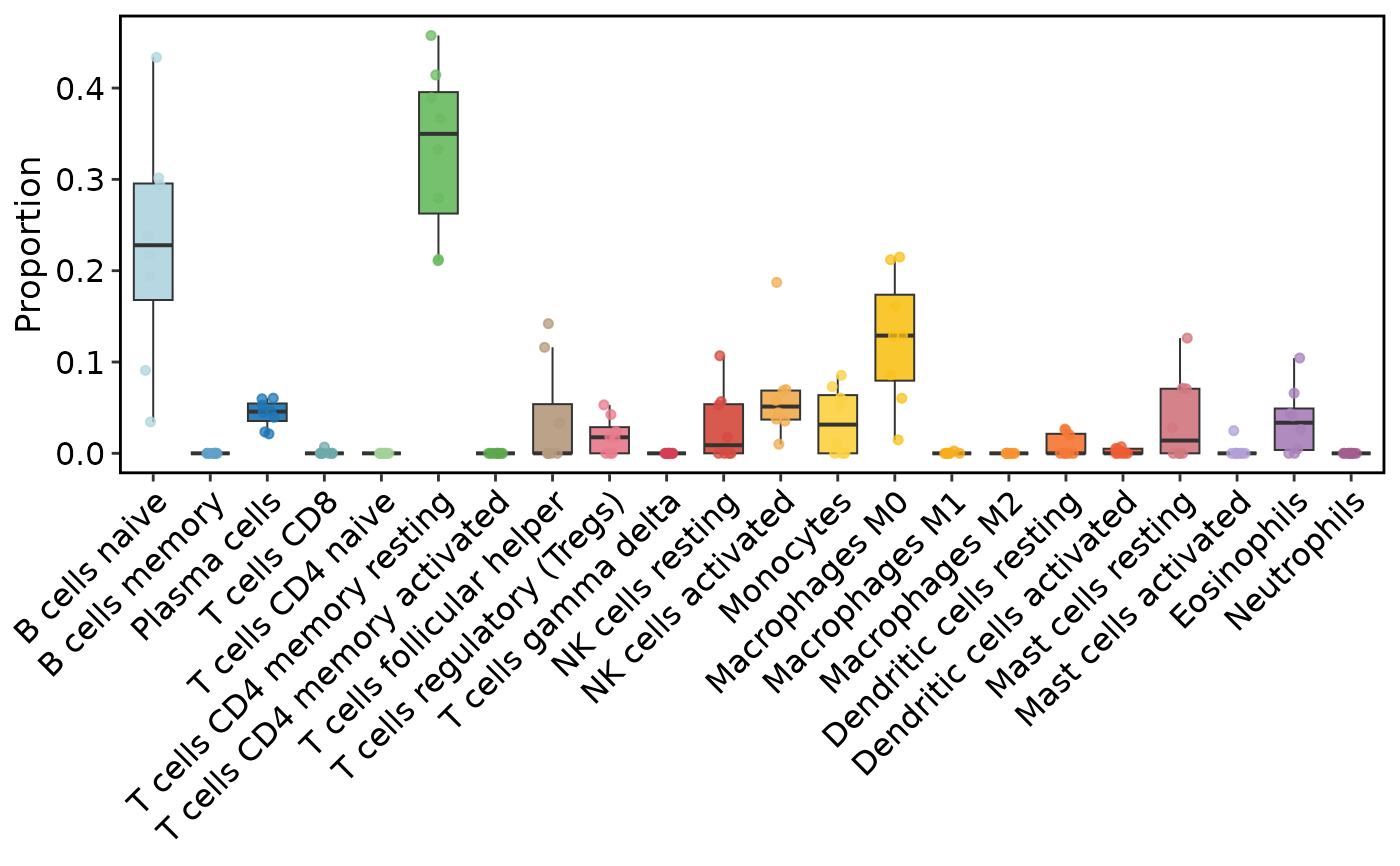
 DeconvolutionPlot(islet_bulk, plot_type = "box")
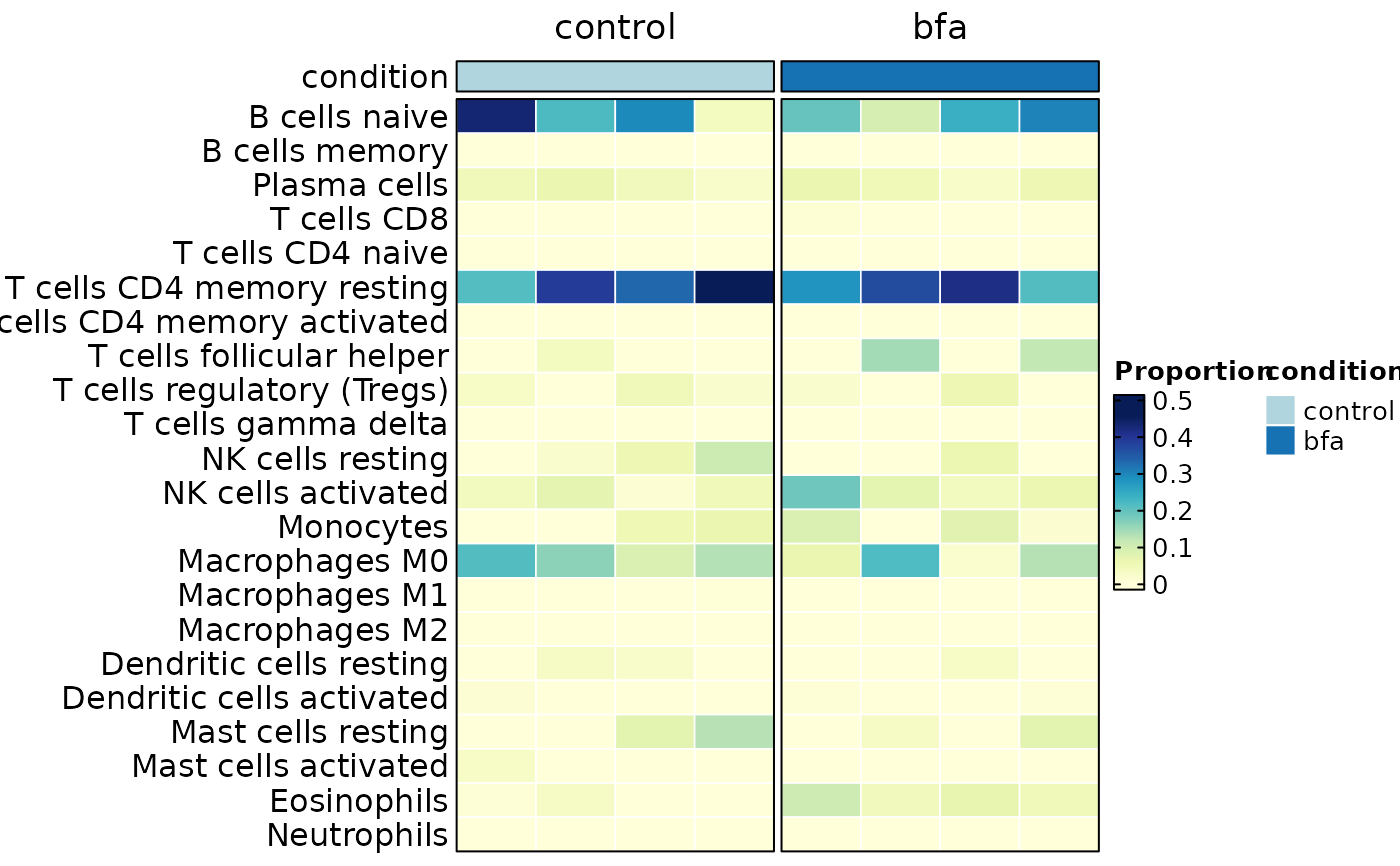
 ht <- DeconvolutionPlot(
islet_bulk,
plot_type = "heatmap",
sample_annotation = "condition",
sample_split = "condition"
)
ComplexHeatmap::draw(ht)
ht <- DeconvolutionPlot(
islet_bulk,
plot_type = "heatmap",
sample_annotation = "condition",
sample_split = "condition"
)
ComplexHeatmap::draw(ht)