Statistical plot of features
Usage
FeatureStatPlot(
  srt,
  stat.by,
  group.by = NULL,
  split.by = NULL,
  bg.by = NULL,
  plot.by = c("group", "feature"),
  fill.by = c("group", "feature", "expression"),
  cells = NULL,
  layer = "data",
  assay = NULL,
  keep_empty = FALSE,
  individual = FALSE,
  plot_type = c("violin", "box", "bar", "dot", "col"),
  palette = "Chinese",
  palcolor = NULL,
  alpha = 1,
  bg_palette = "Chinese",
  bg_palcolor = NULL,
  bg_alpha = 0.2,
  add_box = FALSE,
  box_color = "black",
  box_width = 0.1,
  box_ptsize = 2,
  add_point = FALSE,
  pt.color = "grey30",
  pt.size = NULL,
  pt.alpha = 1,
  jitter.width = 0.4,
  jitter.height = 0.1,
  add_trend = FALSE,
  trend_color = "black",
  trend_linewidth = 1,
  trend_ptsize = 2,
  add_stat = c("none", "mean", "median"),
  stat_color = "black",
  stat_size = 1,
  stat_stroke = 1,
  stat_shape = 25,
  add_line = NULL,
  line_color = "red",
  line_size = 1,
  line_type = 1,
  cells.highlight = NULL,
  cols.highlight = "red",
  sizes.highlight = 1,
  alpha.highlight = 1,
  calculate_coexp = FALSE,
  same.y.lims = FALSE,
  y.min = NULL,
  y.max = NULL,
  y.trans = "identity",
  y.nbreaks = 5,
  sort = FALSE,
  stack = FALSE,
  flip = FALSE,
  comparisons = NULL,
  ref_group = NULL,
  auto_comparison = FALSE,
  pairwise_method = "wilcox.test",
  multiplegroup_comparisons = FALSE,
  multiple_method = "kruskal.test",
  sig_label = c("p.signif", "p.format"),
  sig_labelsize = 3.5,
  aspect.ratio = NULL,
  title = NULL,
  subtitle = NULL,
  xlab = NULL,
  ylab = "Expression level",
  legend.position = "right",
  legend.direction = "vertical",
  legend.title = NULL,
  theme_use = "theme_scop",
  theme_args = list(),
  grid_major = TRUE,
  grid_major_colour = "grey80",
  grid_major_linetype = 2,
  grid_major_linewidth = 0.3,
  combine = TRUE,
  nrow = NULL,
  ncol = NULL,
  byrow = TRUE,
  force = FALSE,
  seed = 11,
  ...,
  x_text_angle = 45,
  verbose = TRUE
)
Arguments
- srt
A Seurat object.
- stat.by
A character vector specifying the features to plot.
- group.by
Name of one or more meta.data columns to group (color) cells by.
- split.by
Name of a column in meta.data column to split plot by. Default is
NULL.- bg.by
A character vector specifying the variable to use as the background color. Default is
NULL.- plot.by
A character vector specifying how to plot the data, by group or feature. Possible values are
"group"or"feature". Default is"group".- fill.by
A string specifying what to fill the plot by. Possible values are
"group","feature", or"expression". Default is"group".- cells
A character vector of cell names to use. Default is
NULL.- layer
Which layer to use. Default is
data.- assay
Which assay to use. If
NULL, the default assay of the Seurat object will be used. When the object also containsChromatinAssay, the default assay and additionalChromatinAssaywill be preprocessed sequentially.- keep_empty
Whether to keep empty levels in the plot. Default is
FALSE.- individual
Whether to create individual plots for each group. Default is
FALSE.- plot_type
A string specifying the type of plot to create. Possible values are
"violin","box","bar","dot", or"col". Default is"violin".- palette
Color palette name. Available palettes can be found in thisplot::show_palettes. Default is
"Chinese".- palcolor
Custom colors used to create a color palette. Default is
NULL.- alpha
The transparency of the plot. Default is
1.- bg_palette
A string specifying the color palette to use for the background. Default is
"Chinese".- bg_palcolor
A character vector specifying specific colors to use for the background. Default is
NULL.- bg_alpha
The transparency of the background. Default is
0.2.- add_box
Whether to add a box plot to the plot. Default is
FALSE.- box_color
A string specifying the color of the box plot. Default is
"black".- box_width
The width of the box plot. Default is
0.1.- box_ptsize
The size of the points of the box plot. Default is
2.- add_point
Whether to add individual data points to the plot. Default is
FALSE.- pt.color
A string specifying the color of the data points. Default is
"grey30".- pt.size
The size of the points in the plot.
- pt.alpha
The transparency of the data points. Default is
1.- jitter.width
The width of the jitter. Default is
0.5.- jitter.height
The height of the jitter. Default is
0.1.- add_trend
Whether to add a trend line to the plot. Default is
FALSE.- trend_color
A string specifying the color of the trend line. Default is
"black".- trend_linewidth
The width of the trend line. Default is
1.- trend_ptsize
The size of the points of the trend line. Default is
2.- add_stat
A string specifying which statistical summary to add to the plot. Possible values are
"none","mean", or"median". Default is"none".- stat_color
A string specifying the color of the statistical summary. Default is
"black".- stat_size
The size of the statistical summary. Default is
1.- stat_stroke
The stroke width of the statistical summary. Default is
1.- stat_shape
The shape of the statistical summary. Default is
25.- add_line
The y-intercept for adding a horizontal line. Default is
NULL.- line_color
A string specifying the color of the horizontal line. Default is
"red".- line_size
The width of the horizontal line. Default is
1.- line_type
The type of the horizontal line. Default is
1.- cells.highlight
A logical or character vector specifying the cells to highlight in the plot. If
TRUE, all cells are highlighted. IfFALSE, no cells are highlighted. Default isNULL.- cols.highlight
A string specifying the color of the highlighted cells. Default is
"red".- sizes.highlight
The size of the highlighted cells. Default is
1.- alpha.highlight
The transparency of the highlighted cells. Default is
1.- calculate_coexp
Whether to calculate co-expression values. Default is
FALSE.- same.y.lims
Whether to use the same y-axis limits for all plots. Default is
FALSE.- y.min
A numeric or character value specifying the minimum y-axis limit. If a character value is provided, it must be of the form "qN" where N is a number between 0 and 100 (inclusive) representing the quantile to use for the limit. Default is
NULL.- y.max
A numeric or character value specifying the maximum y-axis limit. If a character value is provided, it must be of the form "qN" where N is a number between 0 and 100 (inclusive) representing the quantile to use for the limit. Default is
NULL.- y.trans
A string specifying the transformation to apply to the y-axis. Possible values are
"identity"or"log2". Default is"identity".- y.nbreaks
A number of breaks to use for the y-axis. Default is
5.- sort
A logical or character value specifying whether to sort the groups on the x-axis. If
TRUE, groups are sorted in increasing order. If FALSE, groups are not sorted. If"increasing", groups are sorted in increasing order. If"decreasing", groups are sorted in decreasing order. Default isFALSE.- stack
A logical specifying whether to stack the plots on top of each other. Default is
FALSE.- flip
A logical specifying whether to flip the plot vertically. Default is
FALSE.- comparisons
A list of length-2 vectors. The entries in the vector are either the names of 2 values on the x-axis or the 2 integers that correspond to the index of the groups of interest, to be compared.
- ref_group
A string specifying the reference group for pairwise comparisons. Default is
NULL.- auto_comparison
Whether to automatically compare the group with the highest median
stat.byvalue against the other groups. Ifref_groupis provided, that group is used as the reference instead. Only supported whensplit.byisNULL. Default isFALSE.- pairwise_method
Method to use for pairwise comparisons. Default is
"wilcox.test".- multiplegroup_comparisons
Whether to add multiple group comparisons to the plot. Default is
FALSE.- multiple_method
Method to use for multiple group comparisons. Default is
"kruskal.test".- sig_label
A string specifying the label to use for significant comparisons. Possible values are
"p.signif"or"p.format". Default is"p.format".- sig_labelsize
The size of the significant comparison labels. Default is
3.5.- aspect.ratio
Aspect ratio of the panel. Default is
NULL.- title
The text for the title. Default is
NULL.- subtitle
The text for the subtitle for the plot which will be displayed below the title. Default is
NULL.- xlab
The x-axis label of the plot. Default is
NULL.- ylab
A string specifying the label of the y-axis. Default is
"Expression level".- legend.position
The position of legends, one of
"none","left","right","bottom","top". Default is"right".- legend.direction
The direction of the legend in the plot. Can be one of
"vertical"or"horizontal".- legend.title
Title for the legend. Default is
NULL, which uses the group name.- theme_use
Theme used. Can be a character string or a theme function. Default is
"theme_scop".- theme_args
Other arguments passed to the
theme_use. Default islist().- grid_major
Whether to show major panel grid lines. Default is
TRUE.- grid_major_colour
Color of major panel grid lines.
- grid_major_linetype
Linetype of major panel grid lines.
- grid_major_linewidth
Line width of major panel grid lines.
- combine
Combine plots into a single
patchworkobject. IfFALSE, return a list of ggplot objects.- nrow
Number of rows in the combined plot. Default is
NULL, which means determined automatically based on the number of plots.- ncol
Number of columns in the combined plot. Default is
NULL, which means determined automatically based on the number of plots.- byrow
Whether to arrange the plots by row in the combined plot. Default is
TRUE.- force
Whether to force drawing regardless of maximum levels in any cell group is greater than 100. Default is
FALSE.- seed
Random seed for reproducibility. Default is
11.- ...
Additional arguments passed to the other functions.
- x_text_angle
Rotation angle for x-axis labels. Default is
45.- verbose
Whether to print the message. Default is
TRUE.
Examples
data(pancreas_sub)
pancreas_sub <- standard_scop(pancreas_sub)
#> ℹ [2026-07-02 09:04:26] Start standard processing workflow...
#> ℹ [2026-07-02 09:04:27] Checking a list of <Seurat>...
#> ! [2026-07-02 09:04:27] Data 1/1 of the `srt_list` is "unknown"
#> ℹ [2026-07-02 09:04:27] Perform `NormalizeData()` with `normalization.method = 'LogNormalize'` on 1/1 of `srt_list`...
#> ℹ [2026-07-02 09:04:27] Perform `FindVariableFeatures()` on 1/1 of `srt_list`...
#> ℹ [2026-07-02 09:04:27] Use the separate HVF from `srt_list`
#> ℹ [2026-07-02 09:04:27] Number of available HVF: 2000
#> ℹ [2026-07-02 09:04:27] Finished check
#> ℹ [2026-07-02 09:04:27] Perform `ScaleData()`
#> ℹ [2026-07-02 09:04:27] Perform pca linear dimension reduction
#> ℹ [2026-07-02 09:04:28] Use stored estimated dimensions 1:23 for Standardpca
#> ℹ [2026-07-02 09:04:28] Perform `Seurat::FindClusters()` with `cluster_algorithm = 'louvain'` and `cluster_resolution = 0.6`
#> ℹ [2026-07-02 09:04:28] Reorder clusters...
#> ℹ [2026-07-02 09:04:28] Skip `log1p()` because `layer = data` is not "counts"
#> ℹ [2026-07-02 09:04:28] Perform umap nonlinear dimension reduction
#> ✔ [2026-07-02 09:04:34] Standard processing workflow completed
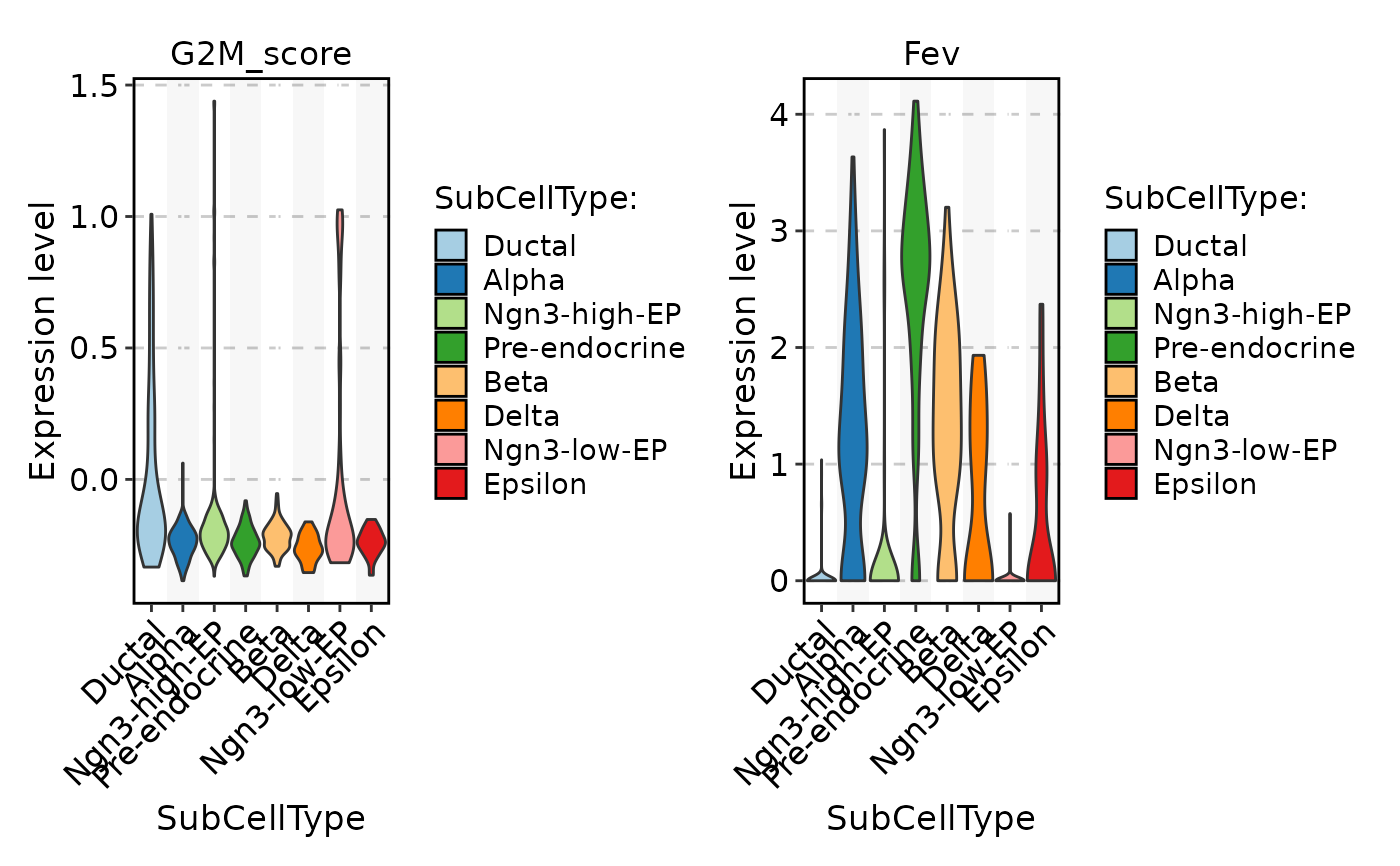
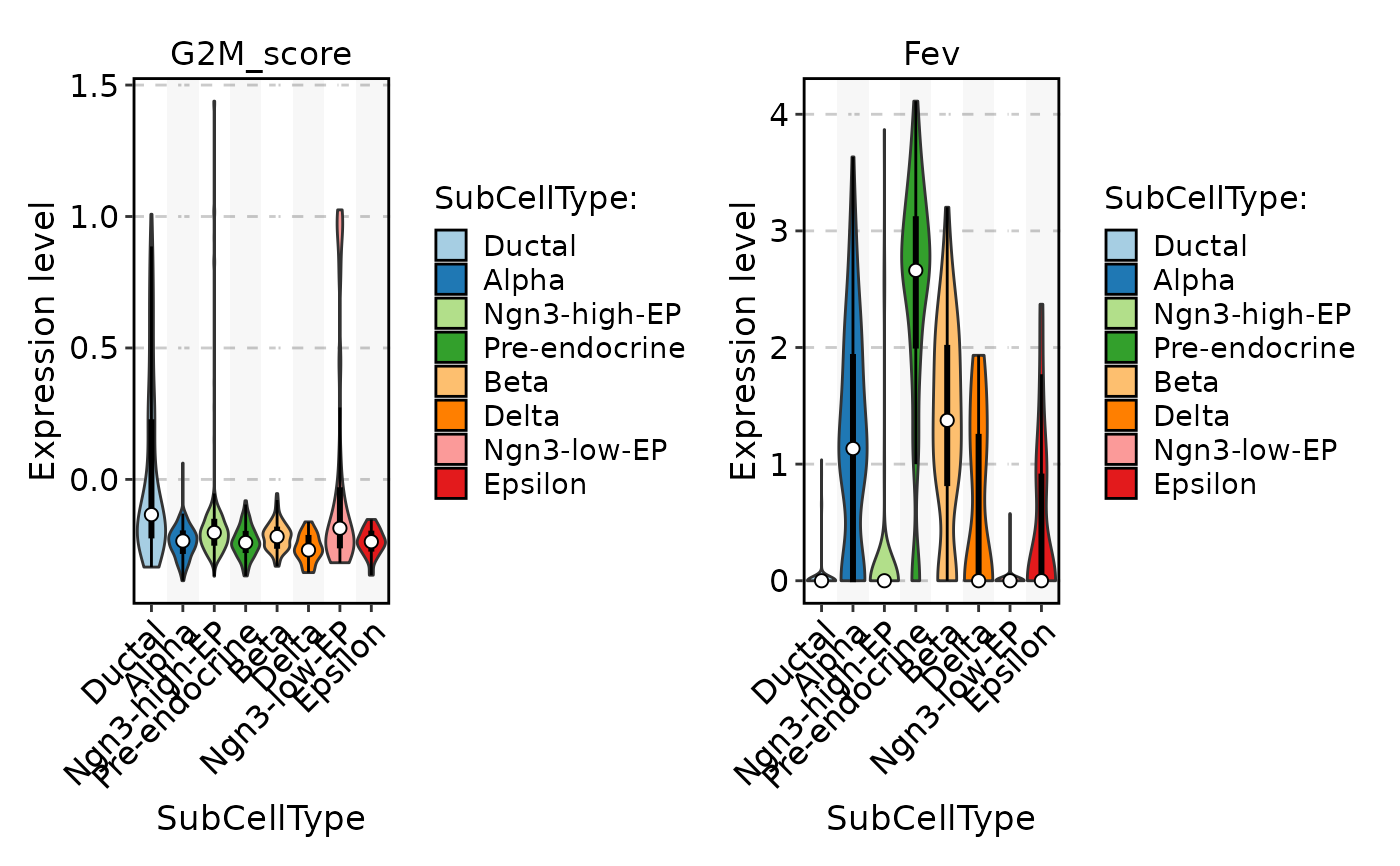
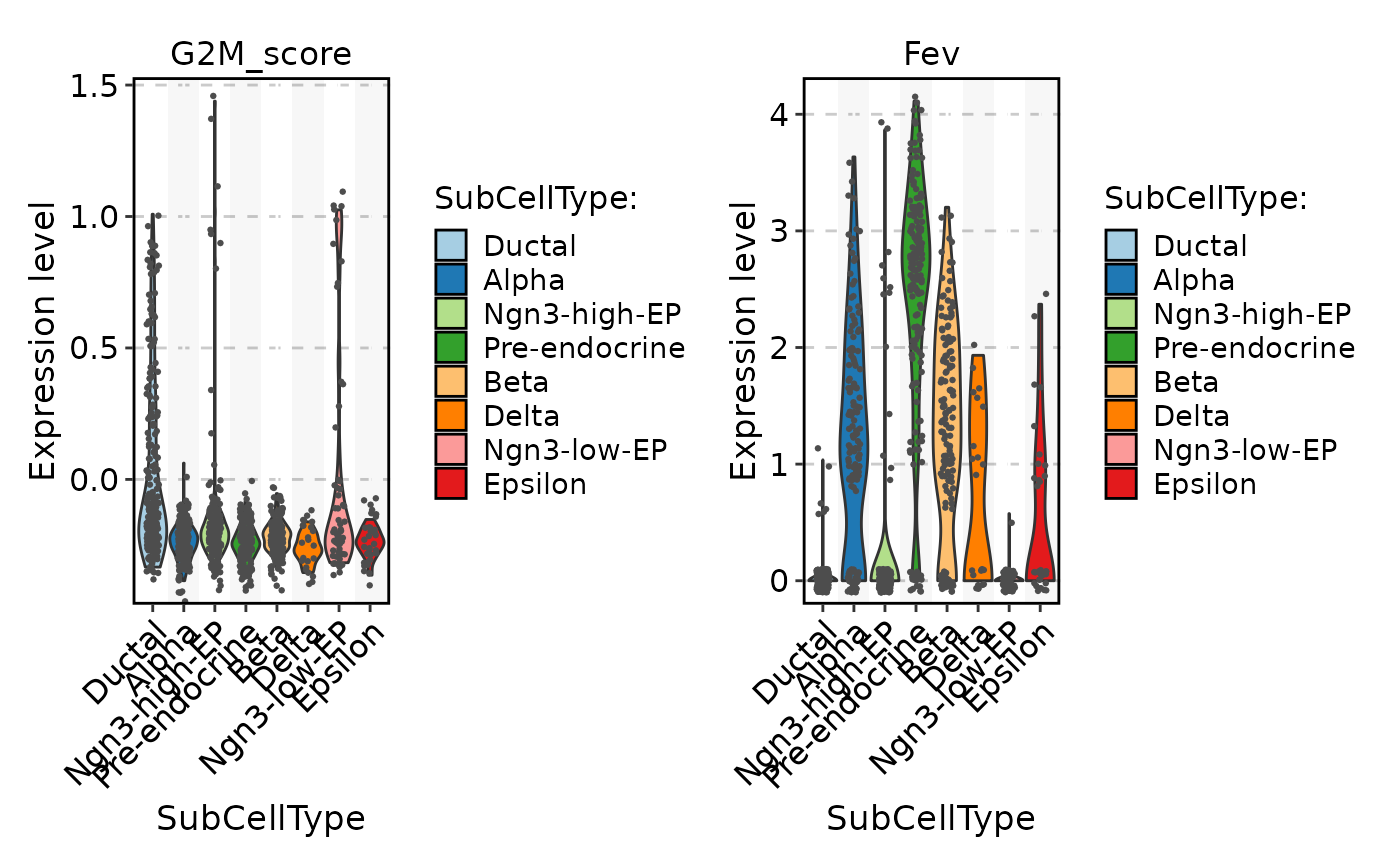
FeatureStatPlot(
pancreas_sub,
stat.by = c("G2M_score", "Fev"),
group.by = "SubCellType"
)
#> Warning: No shared levels found between `names(values)` of the manual scale and the
#> data's colour values.
#> Warning: No shared levels found between `names(values)` of the manual scale and the
#> data's colour values.
 FeatureStatPlot(
pancreas_sub,
stat.by = c("G2M_score", "Fev"),
group.by = "SubCellType"
) |> thisplot::panel_fix(height = 1, width = 2)
#> Warning: No shared levels found between `names(values)` of the manual scale and the
#> data's colour values.
#> Warning: No shared levels found between `names(values)` of the manual scale and the
#> data's colour values.
FeatureStatPlot(
pancreas_sub,
stat.by = c("G2M_score", "Fev"),
group.by = "SubCellType"
) |> thisplot::panel_fix(height = 1, width = 2)
#> Warning: No shared levels found between `names(values)` of the manual scale and the
#> data's colour values.
#> Warning: No shared levels found between `names(values)` of the manual scale and the
#> data's colour values.
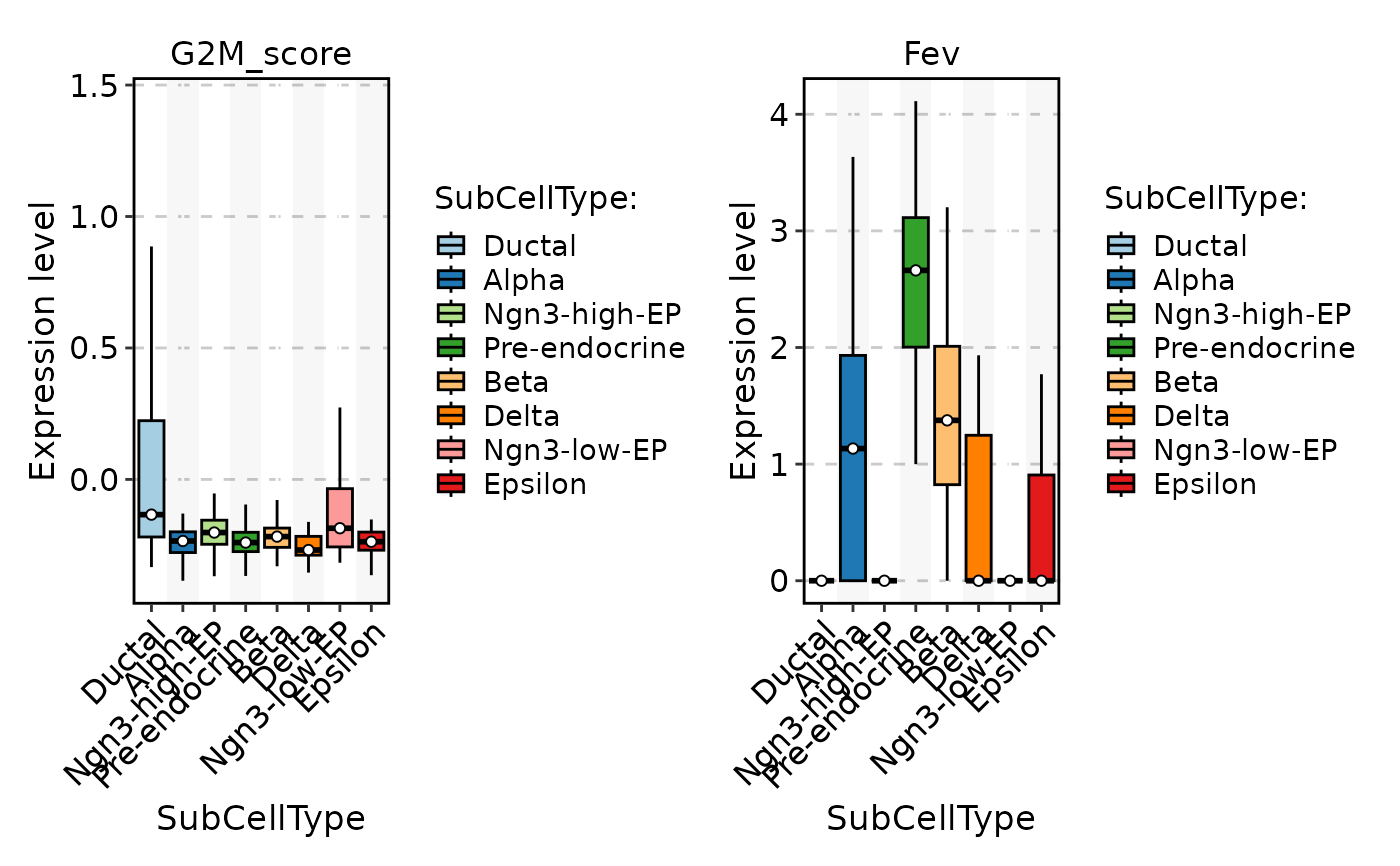
 FeatureStatPlot(
pancreas_sub,
stat.by = c("G2M_score", "Fev"),
group.by = "SubCellType",
plot_type = "box"
)
#> Warning: No shared levels found between `names(values)` of the manual scale and the
#> data's colour values.
#> Warning: No shared levels found between `names(values)` of the manual scale and the
#> data's colour values.
FeatureStatPlot(
pancreas_sub,
stat.by = c("G2M_score", "Fev"),
group.by = "SubCellType",
plot_type = "box"
)
#> Warning: No shared levels found between `names(values)` of the manual scale and the
#> data's colour values.
#> Warning: No shared levels found between `names(values)` of the manual scale and the
#> data's colour values.
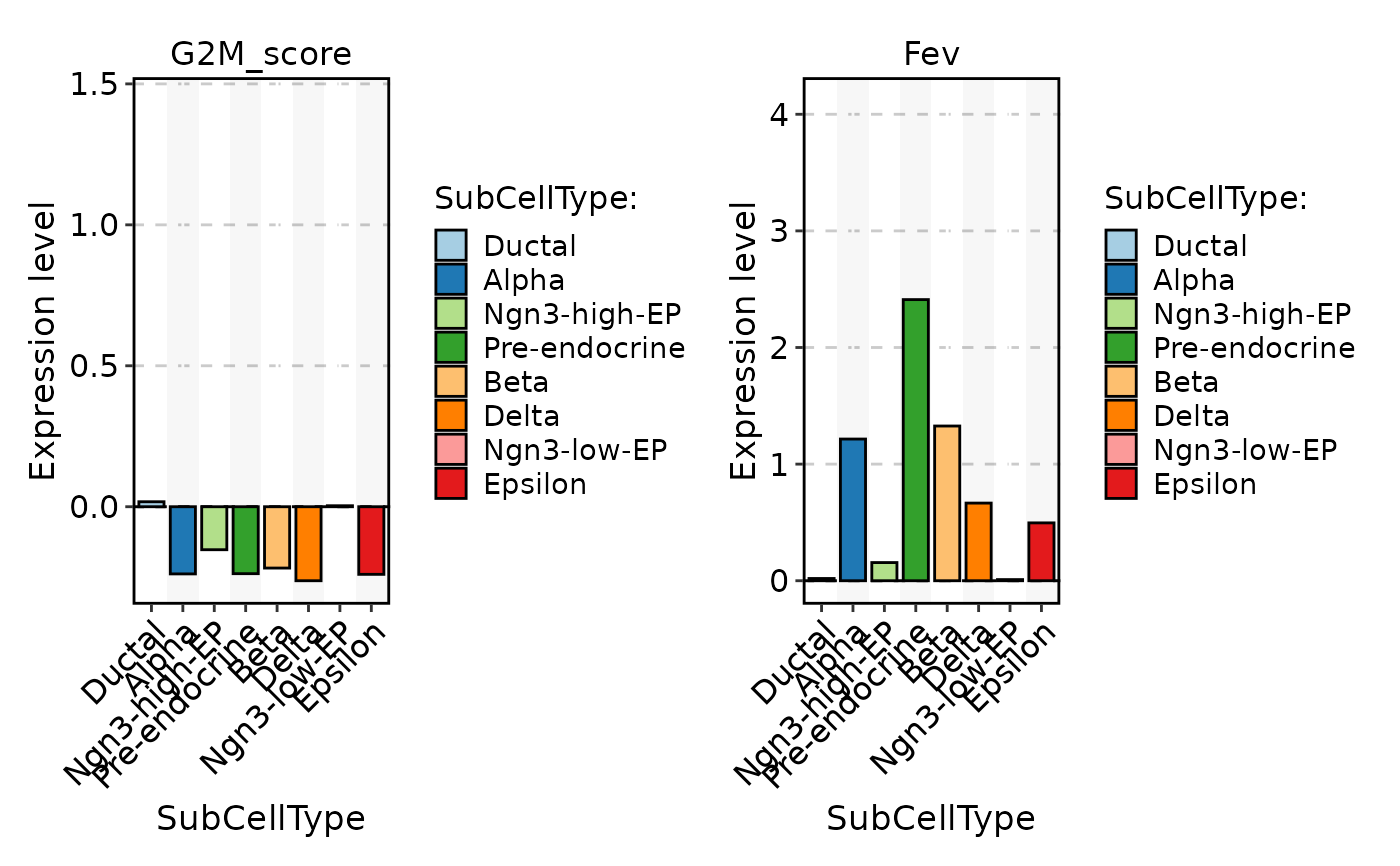
 FeatureStatPlot(
pancreas_sub,
stat.by = c("G2M_score", "Fev"),
group.by = "SubCellType",
plot_type = "bar"
)
#> Warning: Computation failed in `stat_summary()`.
#> Caused by error in `fun.data()`:
#> ! The package "Hmisc" is required.
#> Warning: Computation failed in `stat_summary()`.
#> Caused by error in `fun.data()`:
#> ! The package "Hmisc" is required.
#> Warning: Computation failed in `stat_summary()`.
#> Caused by error in `fun.data()`:
#> ! The package "Hmisc" is required.
#> Warning: No shared levels found between `names(values)` of the manual scale and the
#> data's colour values.
#> Warning: Computation failed in `stat_summary()`.
#> Caused by error in `fun.data()`:
#> ! The package "Hmisc" is required.
#> Warning: No shared levels found between `names(values)` of the manual scale and the
#> data's colour values.
FeatureStatPlot(
pancreas_sub,
stat.by = c("G2M_score", "Fev"),
group.by = "SubCellType",
plot_type = "bar"
)
#> Warning: Computation failed in `stat_summary()`.
#> Caused by error in `fun.data()`:
#> ! The package "Hmisc" is required.
#> Warning: Computation failed in `stat_summary()`.
#> Caused by error in `fun.data()`:
#> ! The package "Hmisc" is required.
#> Warning: Computation failed in `stat_summary()`.
#> Caused by error in `fun.data()`:
#> ! The package "Hmisc" is required.
#> Warning: No shared levels found between `names(values)` of the manual scale and the
#> data's colour values.
#> Warning: Computation failed in `stat_summary()`.
#> Caused by error in `fun.data()`:
#> ! The package "Hmisc" is required.
#> Warning: No shared levels found between `names(values)` of the manual scale and the
#> data's colour values.
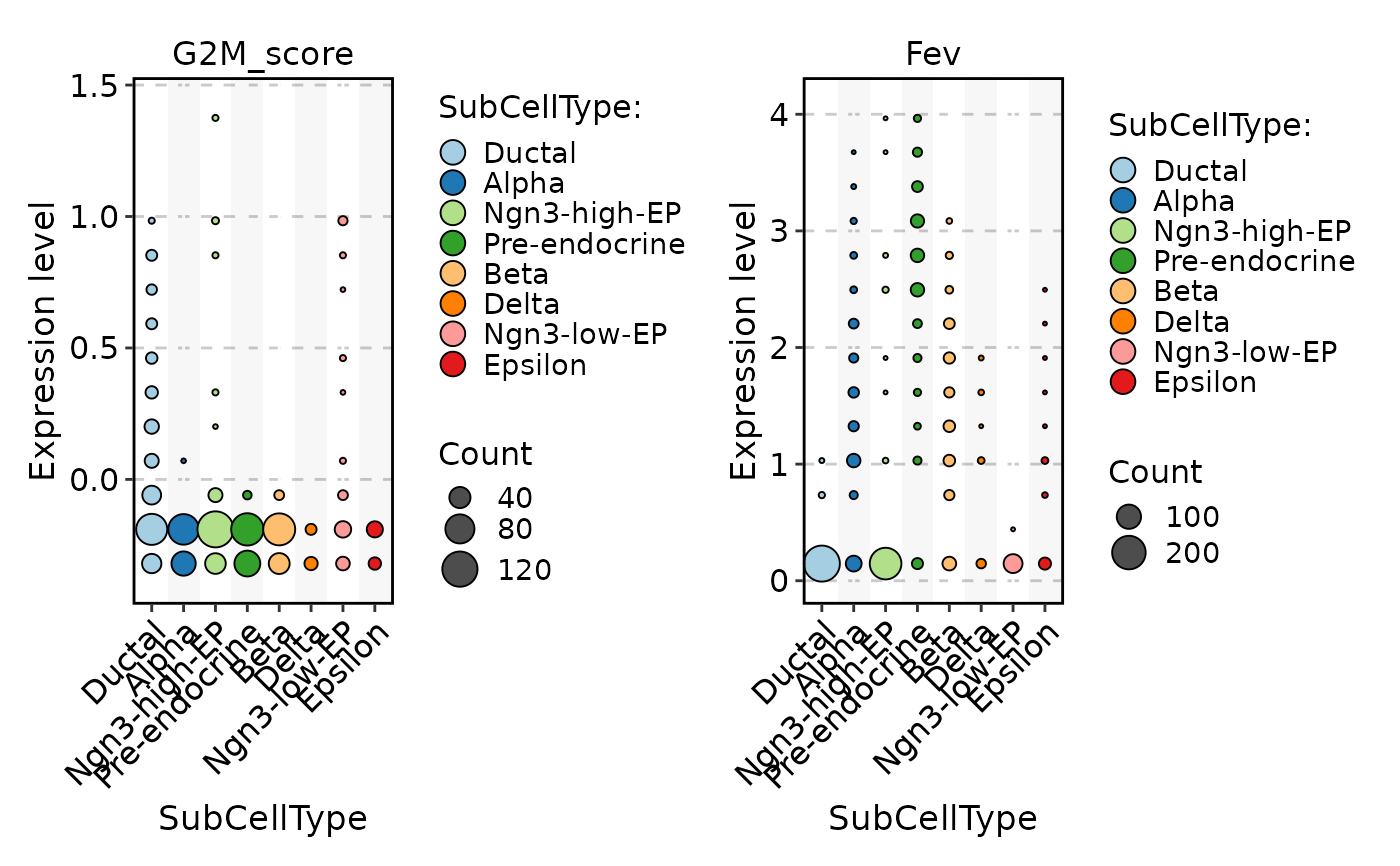
 FeatureStatPlot(
pancreas_sub,
stat.by = c("G2M_score", "Fev"),
group.by = "SubCellType",
plot_type = "dot"
)
#> Warning: No shared levels found between `names(values)` of the manual scale and the
#> data's colour values.
#> Warning: No shared levels found between `names(values)` of the manual scale and the
#> data's colour values.
FeatureStatPlot(
pancreas_sub,
stat.by = c("G2M_score", "Fev"),
group.by = "SubCellType",
plot_type = "dot"
)
#> Warning: No shared levels found between `names(values)` of the manual scale and the
#> data's colour values.
#> Warning: No shared levels found between `names(values)` of the manual scale and the
#> data's colour values.
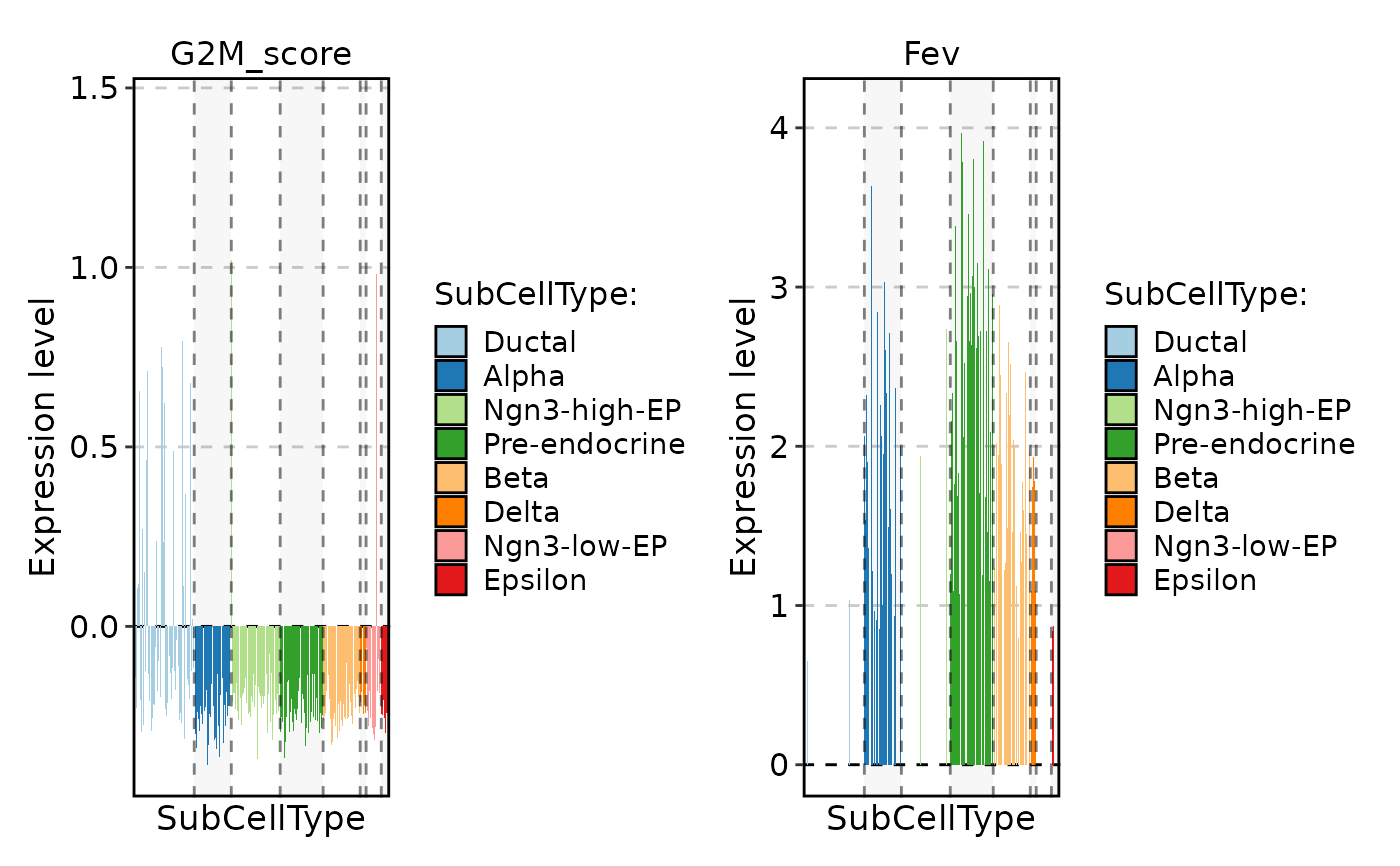
 FeatureStatPlot(
pancreas_sub,
stat.by = c("G2M_score", "Fev"),
group.by = "SubCellType",
plot_type = "col"
)
#> Warning: No shared levels found between `names(values)` of the manual scale and the
#> data's colour values.
#> Warning: No shared levels found between `names(values)` of the manual scale and the
#> data's colour values.
FeatureStatPlot(
pancreas_sub,
stat.by = c("G2M_score", "Fev"),
group.by = "SubCellType",
plot_type = "col"
)
#> Warning: No shared levels found between `names(values)` of the manual scale and the
#> data's colour values.
#> Warning: No shared levels found between `names(values)` of the manual scale and the
#> data's colour values.
 FeatureStatPlot(
pancreas_sub,
stat.by = c("G2M_score", "Fev"),
group.by = "SubCellType",
add_box = TRUE
)
#> Warning: No shared levels found between `names(values)` of the manual scale and the
#> data's colour values.
#> Warning: No shared levels found between `names(values)` of the manual scale and the
#> data's colour values.
FeatureStatPlot(
pancreas_sub,
stat.by = c("G2M_score", "Fev"),
group.by = "SubCellType",
add_box = TRUE
)
#> Warning: No shared levels found between `names(values)` of the manual scale and the
#> data's colour values.
#> Warning: No shared levels found between `names(values)` of the manual scale and the
#> data's colour values.
 FeatureStatPlot(
pancreas_sub,
stat.by = c("G2M_score", "Fev"),
group.by = "SubCellType",
add_point = TRUE
)
#> Warning: No shared levels found between `names(values)` of the manual scale and the
#> data's colour values.
#> Warning: No shared levels found between `names(values)` of the manual scale and the
#> data's colour values.
FeatureStatPlot(
pancreas_sub,
stat.by = c("G2M_score", "Fev"),
group.by = "SubCellType",
add_point = TRUE
)
#> Warning: No shared levels found between `names(values)` of the manual scale and the
#> data's colour values.
#> Warning: No shared levels found between `names(values)` of the manual scale and the
#> data's colour values.
 FeatureStatPlot(
pancreas_sub,
stat.by = c("G2M_score", "Fev"),
group.by = "SubCellType",
add_trend = TRUE
)
#> Warning: No shared levels found between `names(values)` of the manual scale and the
#> data's colour values.
#> Warning: No shared levels found between `names(values)` of the manual scale and the
#> data's colour values.
FeatureStatPlot(
pancreas_sub,
stat.by = c("G2M_score", "Fev"),
group.by = "SubCellType",
add_trend = TRUE
)
#> Warning: No shared levels found between `names(values)` of the manual scale and the
#> data's colour values.
#> Warning: No shared levels found between `names(values)` of the manual scale and the
#> data's colour values.
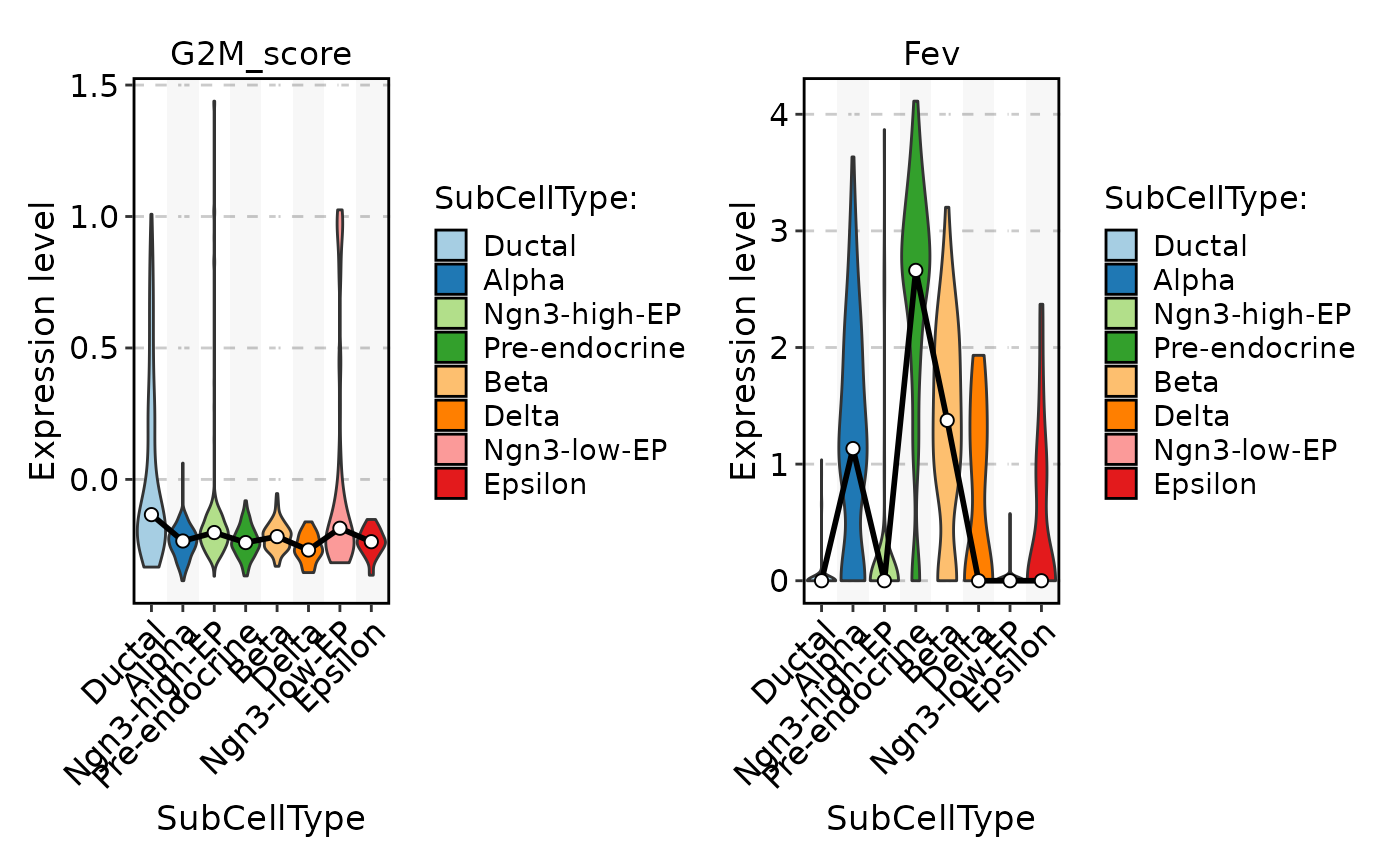 FeatureStatPlot(
pancreas_sub,
stat.by = c("G2M_score", "Fev"),
group.by = "SubCellType",
add_stat = "mean"
)
#> Warning: No shared levels found between `names(values)` of the manual scale and the
#> data's colour values.
#> Warning: No shared levels found between `names(values)` of the manual scale and the
#> data's colour values.
FeatureStatPlot(
pancreas_sub,
stat.by = c("G2M_score", "Fev"),
group.by = "SubCellType",
add_stat = "mean"
)
#> Warning: No shared levels found between `names(values)` of the manual scale and the
#> data's colour values.
#> Warning: No shared levels found between `names(values)` of the manual scale and the
#> data's colour values.
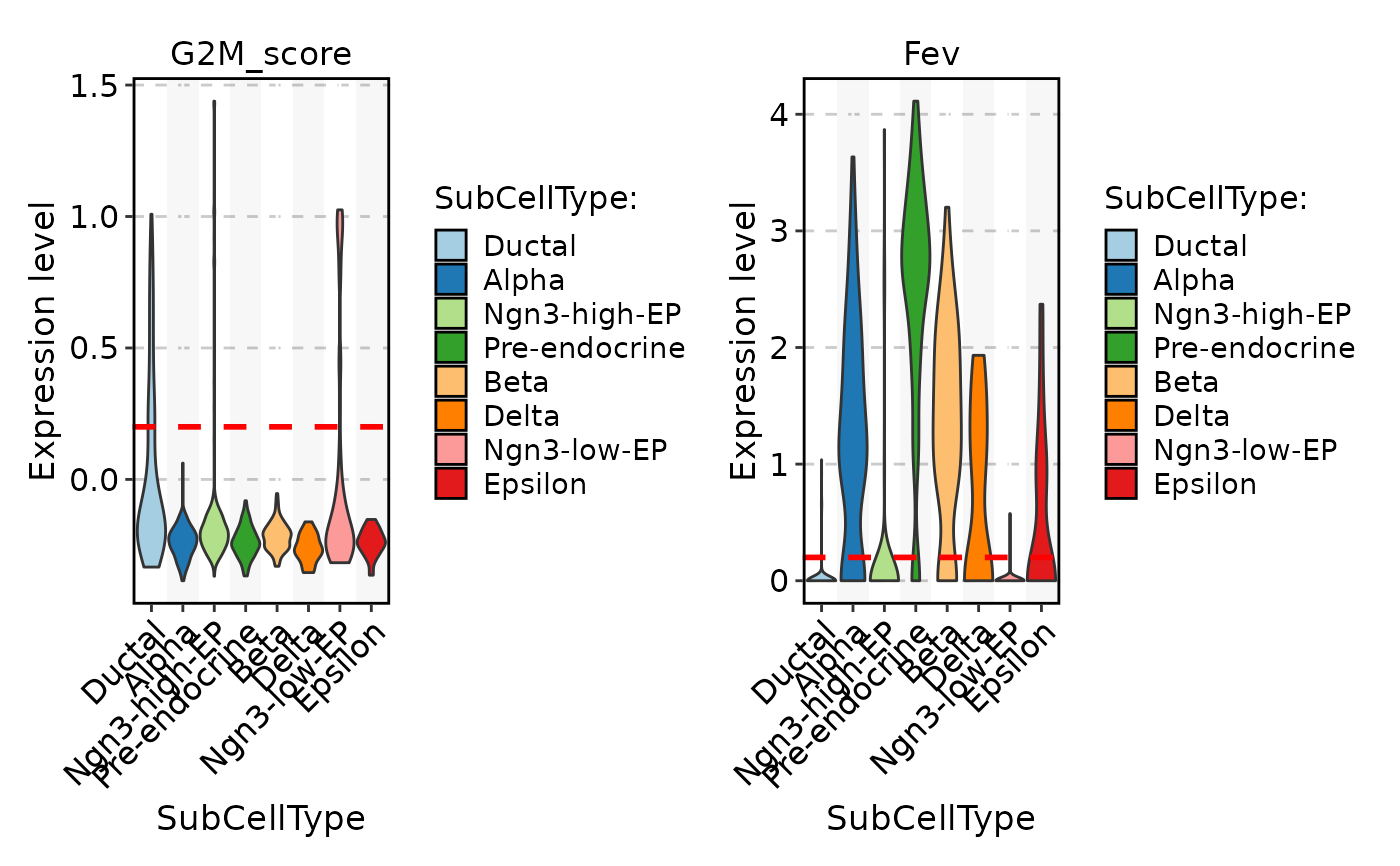
 FeatureStatPlot(
pancreas_sub,
stat.by = c("G2M_score", "Fev"),
group.by = "SubCellType",
add_line = 0.2,
line_type = 2
)
#> Warning: No shared levels found between `names(values)` of the manual scale and the
#> data's colour values.
#> Warning: No shared levels found between `names(values)` of the manual scale and the
#> data's colour values.
FeatureStatPlot(
pancreas_sub,
stat.by = c("G2M_score", "Fev"),
group.by = "SubCellType",
add_line = 0.2,
line_type = 2
)
#> Warning: No shared levels found between `names(values)` of the manual scale and the
#> data's colour values.
#> Warning: No shared levels found between `names(values)` of the manual scale and the
#> data's colour values.
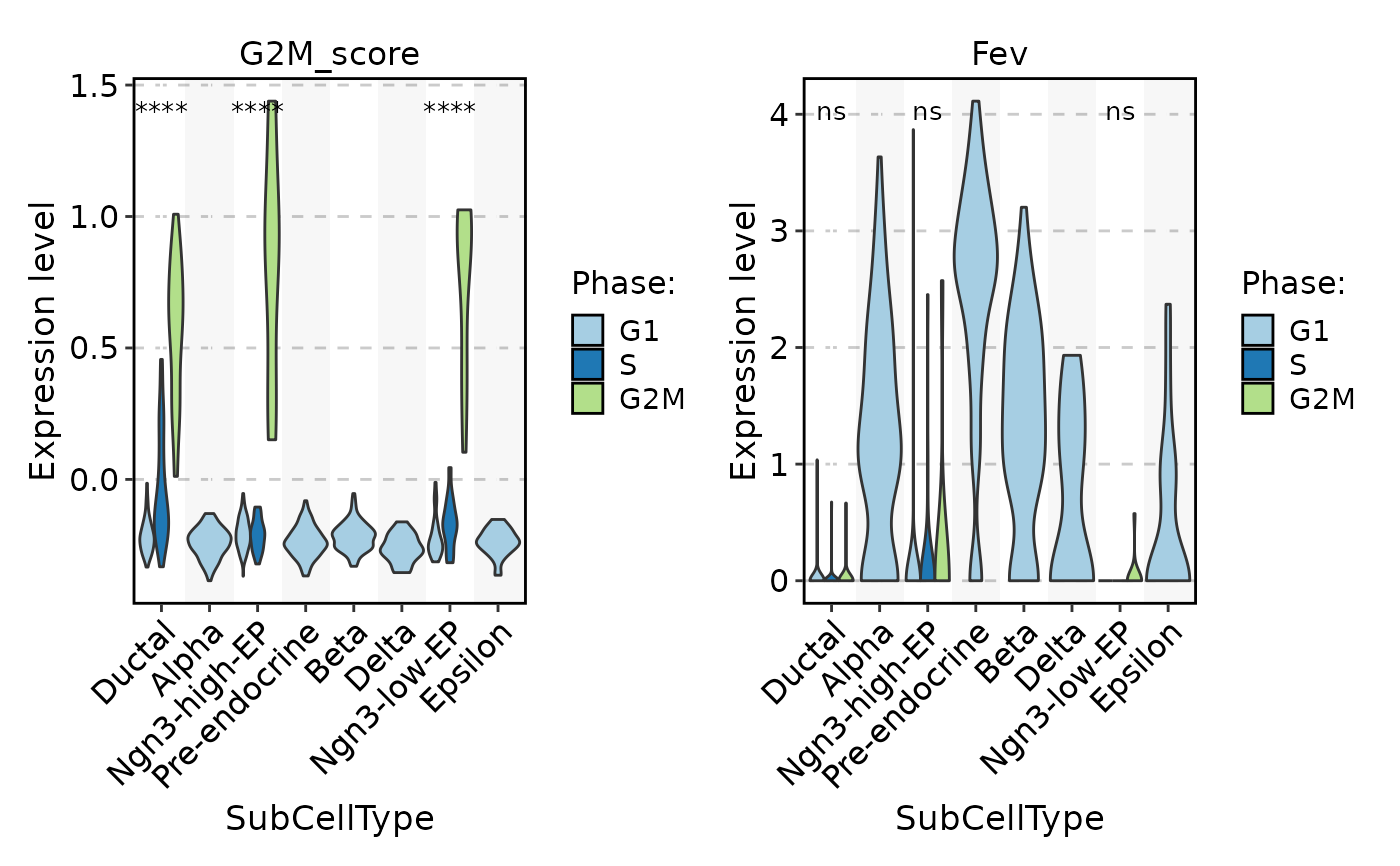
 FeatureStatPlot(
pancreas_sub,
stat.by = c("G2M_score", "Fev"),
group.by = "SubCellType",
split.by = "Phase"
)
#> ! [2026-07-02 09:04:44] Removed 10 groups with < 2 observations for violin plot: "sp-S-gp-Beta", "sp-G2M-gp-Beta", "sp-S-gp-Pre-endocrine", "sp-G2M-gp-Pre-endocrine", "sp-S-gp-Alpha", "sp-G2M-gp-Alpha", "sp-S-gp-Epsilon", "sp-G2M-gp-Epsilon", "sp-S-gp-Delta", and "sp-G2M-gp-Delta"
#> ! [2026-07-02 09:04:44] Removed 10 groups with < 2 observations for violin plot: "sp-S-gp-Beta", "sp-G2M-gp-Beta", "sp-S-gp-Pre-endocrine", "sp-G2M-gp-Pre-endocrine", "sp-S-gp-Alpha", "sp-G2M-gp-Alpha", "sp-S-gp-Epsilon", "sp-G2M-gp-Epsilon", "sp-S-gp-Delta", and "sp-G2M-gp-Delta"
#> Warning: No shared levels found between `names(values)` of the manual scale and the
#> data's colour values.
#> Warning: No shared levels found between `names(values)` of the manual scale and the
#> data's colour values.
FeatureStatPlot(
pancreas_sub,
stat.by = c("G2M_score", "Fev"),
group.by = "SubCellType",
split.by = "Phase"
)
#> ! [2026-07-02 09:04:44] Removed 10 groups with < 2 observations for violin plot: "sp-S-gp-Beta", "sp-G2M-gp-Beta", "sp-S-gp-Pre-endocrine", "sp-G2M-gp-Pre-endocrine", "sp-S-gp-Alpha", "sp-G2M-gp-Alpha", "sp-S-gp-Epsilon", "sp-G2M-gp-Epsilon", "sp-S-gp-Delta", and "sp-G2M-gp-Delta"
#> ! [2026-07-02 09:04:44] Removed 10 groups with < 2 observations for violin plot: "sp-S-gp-Beta", "sp-G2M-gp-Beta", "sp-S-gp-Pre-endocrine", "sp-G2M-gp-Pre-endocrine", "sp-S-gp-Alpha", "sp-G2M-gp-Alpha", "sp-S-gp-Epsilon", "sp-G2M-gp-Epsilon", "sp-S-gp-Delta", and "sp-G2M-gp-Delta"
#> Warning: No shared levels found between `names(values)` of the manual scale and the
#> data's colour values.
#> Warning: No shared levels found between `names(values)` of the manual scale and the
#> data's colour values.
 FeatureStatPlot(
pancreas_sub,
stat.by = c("G2M_score", "Fev"),
group.by = "SubCellType",
split.by = "Phase",
add_box = TRUE,
add_trend = TRUE
)
#> ! [2026-07-02 09:04:45] Removed 10 groups with < 2 observations for violin plot: "sp-S-gp-Beta", "sp-G2M-gp-Beta", "sp-S-gp-Pre-endocrine", "sp-G2M-gp-Pre-endocrine", "sp-S-gp-Alpha", "sp-G2M-gp-Alpha", "sp-S-gp-Epsilon", "sp-G2M-gp-Epsilon", "sp-S-gp-Delta", and "sp-G2M-gp-Delta"
#> ! [2026-07-02 09:04:45] Removed 10 groups with < 2 observations for violin plot: "sp-S-gp-Beta", "sp-G2M-gp-Beta", "sp-S-gp-Pre-endocrine", "sp-G2M-gp-Pre-endocrine", "sp-S-gp-Alpha", "sp-G2M-gp-Alpha", "sp-S-gp-Epsilon", "sp-G2M-gp-Epsilon", "sp-S-gp-Delta", and "sp-G2M-gp-Delta"
#> Warning: No shared levels found between `names(values)` of the manual scale and the
#> data's colour values.
#> Warning: No shared levels found between `names(values)` of the manual scale and the
#> data's colour values.
FeatureStatPlot(
pancreas_sub,
stat.by = c("G2M_score", "Fev"),
group.by = "SubCellType",
split.by = "Phase",
add_box = TRUE,
add_trend = TRUE
)
#> ! [2026-07-02 09:04:45] Removed 10 groups with < 2 observations for violin plot: "sp-S-gp-Beta", "sp-G2M-gp-Beta", "sp-S-gp-Pre-endocrine", "sp-G2M-gp-Pre-endocrine", "sp-S-gp-Alpha", "sp-G2M-gp-Alpha", "sp-S-gp-Epsilon", "sp-G2M-gp-Epsilon", "sp-S-gp-Delta", and "sp-G2M-gp-Delta"
#> ! [2026-07-02 09:04:45] Removed 10 groups with < 2 observations for violin plot: "sp-S-gp-Beta", "sp-G2M-gp-Beta", "sp-S-gp-Pre-endocrine", "sp-G2M-gp-Pre-endocrine", "sp-S-gp-Alpha", "sp-G2M-gp-Alpha", "sp-S-gp-Epsilon", "sp-G2M-gp-Epsilon", "sp-S-gp-Delta", and "sp-G2M-gp-Delta"
#> Warning: No shared levels found between `names(values)` of the manual scale and the
#> data's colour values.
#> Warning: No shared levels found between `names(values)` of the manual scale and the
#> data's colour values.
 FeatureStatPlot(
pancreas_sub,
stat.by = c("G2M_score", "Fev"),
group.by = "SubCellType",
split.by = "Phase",
comparisons = TRUE
)
#> ! [2026-07-02 09:04:55] Removed 10 groups with < 2 observations for violin plot: "sp-S-gp-Beta", "sp-G2M-gp-Beta", "sp-S-gp-Pre-endocrine", "sp-G2M-gp-Pre-endocrine", "sp-S-gp-Alpha", "sp-G2M-gp-Alpha", "sp-S-gp-Epsilon", "sp-G2M-gp-Epsilon", "sp-S-gp-Delta", and "sp-G2M-gp-Delta"
#> ℹ [2026-07-02 09:04:55] Detected more than 2 groups. Use "kruskal.test" for comparison
#> Warning: No shared levels found between `names(values)` of the manual scale and the
#> data's colour values.
#> Warning: No shared levels found between `names(values)` of the manual scale and the
#> data's colour values.
FeatureStatPlot(
pancreas_sub,
stat.by = c("G2M_score", "Fev"),
group.by = "SubCellType",
split.by = "Phase",
comparisons = TRUE
)
#> ! [2026-07-02 09:04:55] Removed 10 groups with < 2 observations for violin plot: "sp-S-gp-Beta", "sp-G2M-gp-Beta", "sp-S-gp-Pre-endocrine", "sp-G2M-gp-Pre-endocrine", "sp-S-gp-Alpha", "sp-G2M-gp-Alpha", "sp-S-gp-Epsilon", "sp-G2M-gp-Epsilon", "sp-S-gp-Delta", and "sp-G2M-gp-Delta"
#> ℹ [2026-07-02 09:04:55] Detected more than 2 groups. Use "kruskal.test" for comparison
#> ! [2026-07-02 09:04:55] Removed 10 groups with < 2 observations for violin plot: "sp-S-gp-Beta", "sp-G2M-gp-Beta", "sp-S-gp-Pre-endocrine", "sp-G2M-gp-Pre-endocrine", "sp-S-gp-Alpha", "sp-G2M-gp-Alpha", "sp-S-gp-Epsilon", "sp-G2M-gp-Epsilon", "sp-S-gp-Delta", and "sp-G2M-gp-Delta"
#> ℹ [2026-07-02 09:04:55] Detected more than 2 groups. Use "kruskal.test" for comparison
#> Warning: No shared levels found between `names(values)` of the manual scale and the
#> data's colour values.
#> Warning: No shared levels found between `names(values)` of the manual scale and the
#> data's colour values.
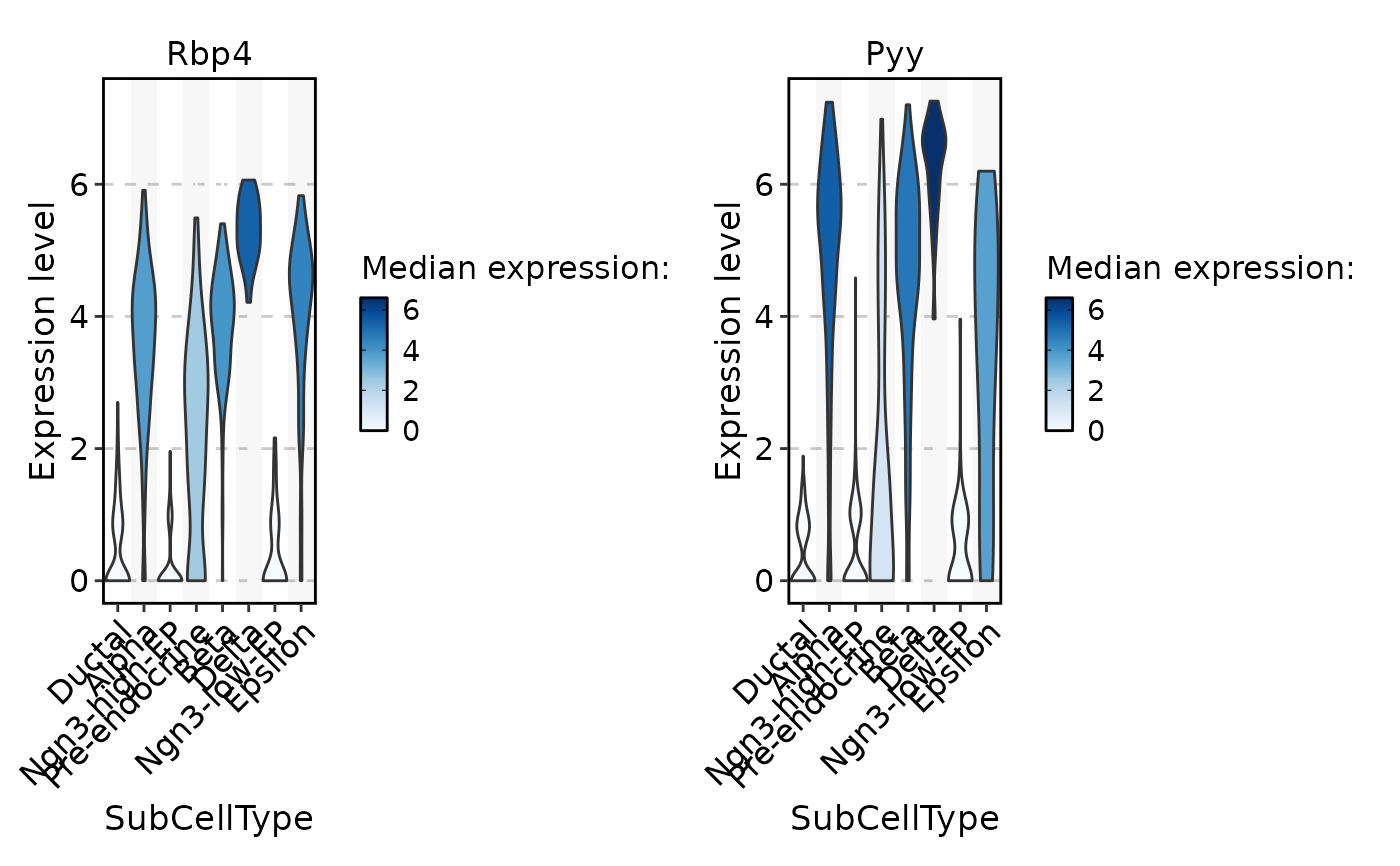
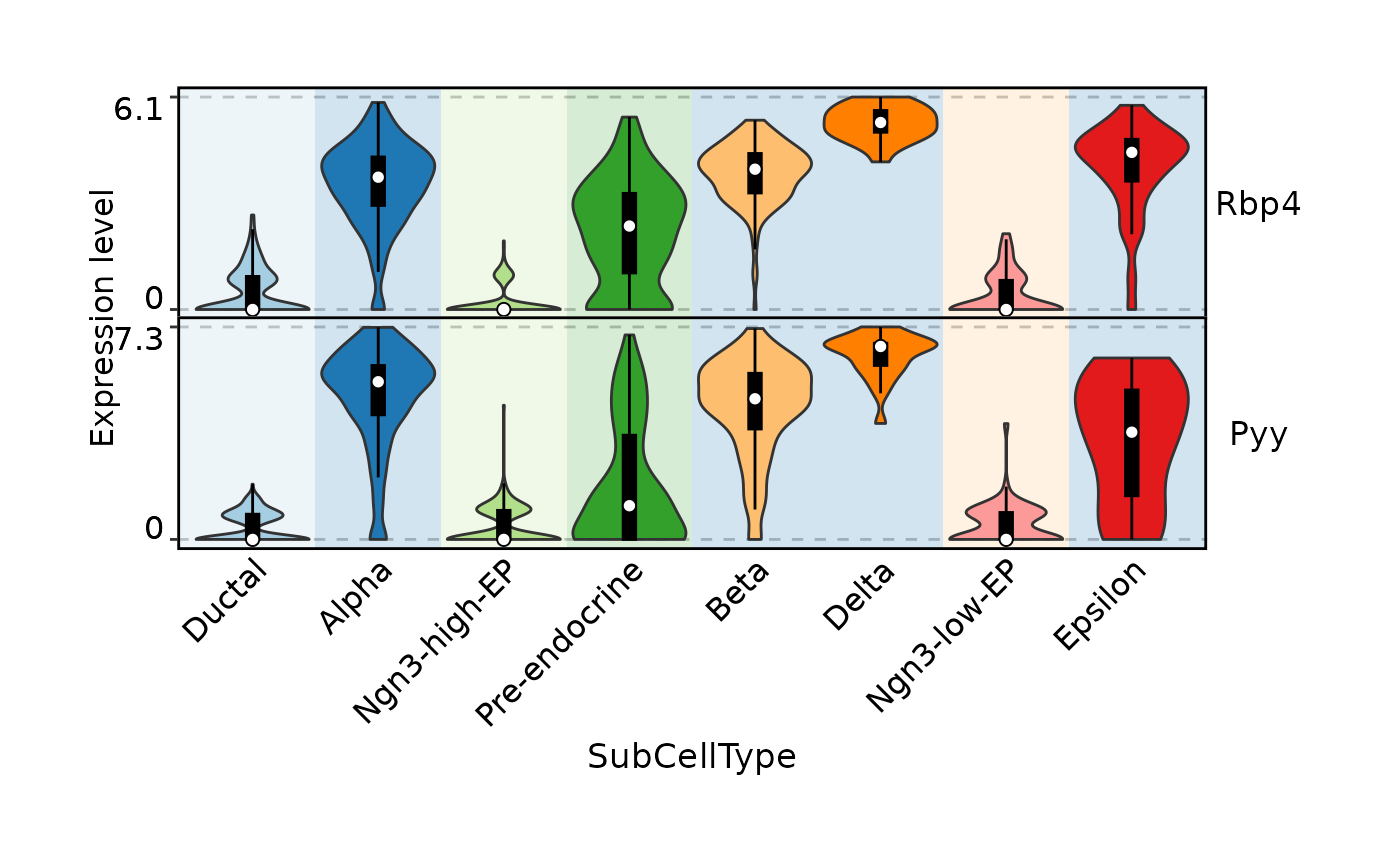
 FeatureStatPlot(
pancreas_sub,
stat.by = c("Rbp4", "Pyy"),
group.by = "SubCellType",
fill.by = "expression",
palette = "Blues",
same.y.lims = TRUE
)
FeatureStatPlot(
pancreas_sub,
stat.by = c("Rbp4", "Pyy"),
group.by = "SubCellType",
fill.by = "expression",
palette = "Blues",
same.y.lims = TRUE
)
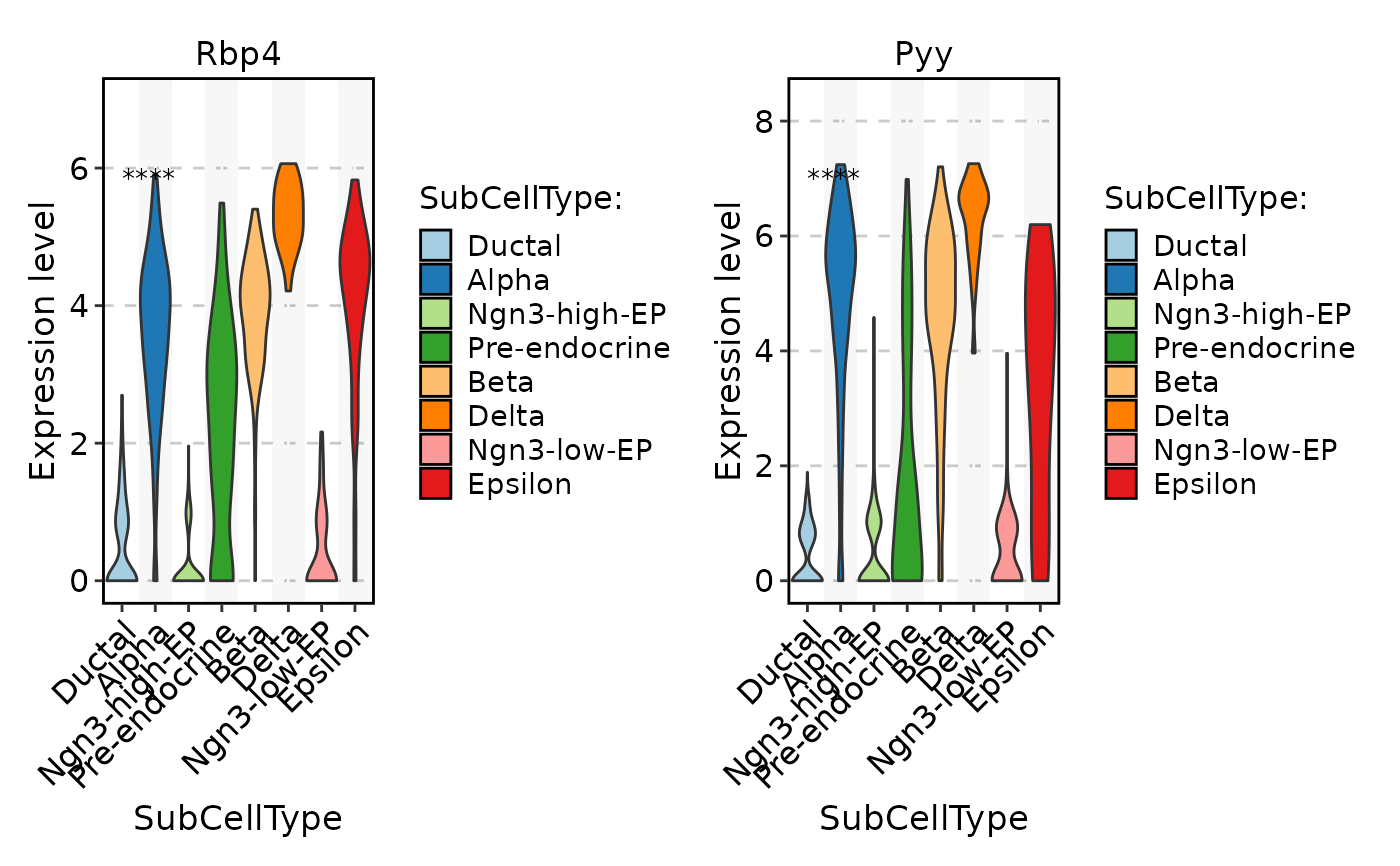
 FeatureStatPlot(
pancreas_sub,
stat.by = c("Rbp4", "Pyy"),
group.by = "SubCellType",
multiplegroup_comparisons = TRUE
)
#> Warning: No shared levels found between `names(values)` of the manual scale and the
#> data's colour values.
#> Warning: No shared levels found between `names(values)` of the manual scale and the
#> data's colour values.
FeatureStatPlot(
pancreas_sub,
stat.by = c("Rbp4", "Pyy"),
group.by = "SubCellType",
multiplegroup_comparisons = TRUE
)
#> Warning: No shared levels found between `names(values)` of the manual scale and the
#> data's colour values.
#> Warning: No shared levels found between `names(values)` of the manual scale and the
#> data's colour values.
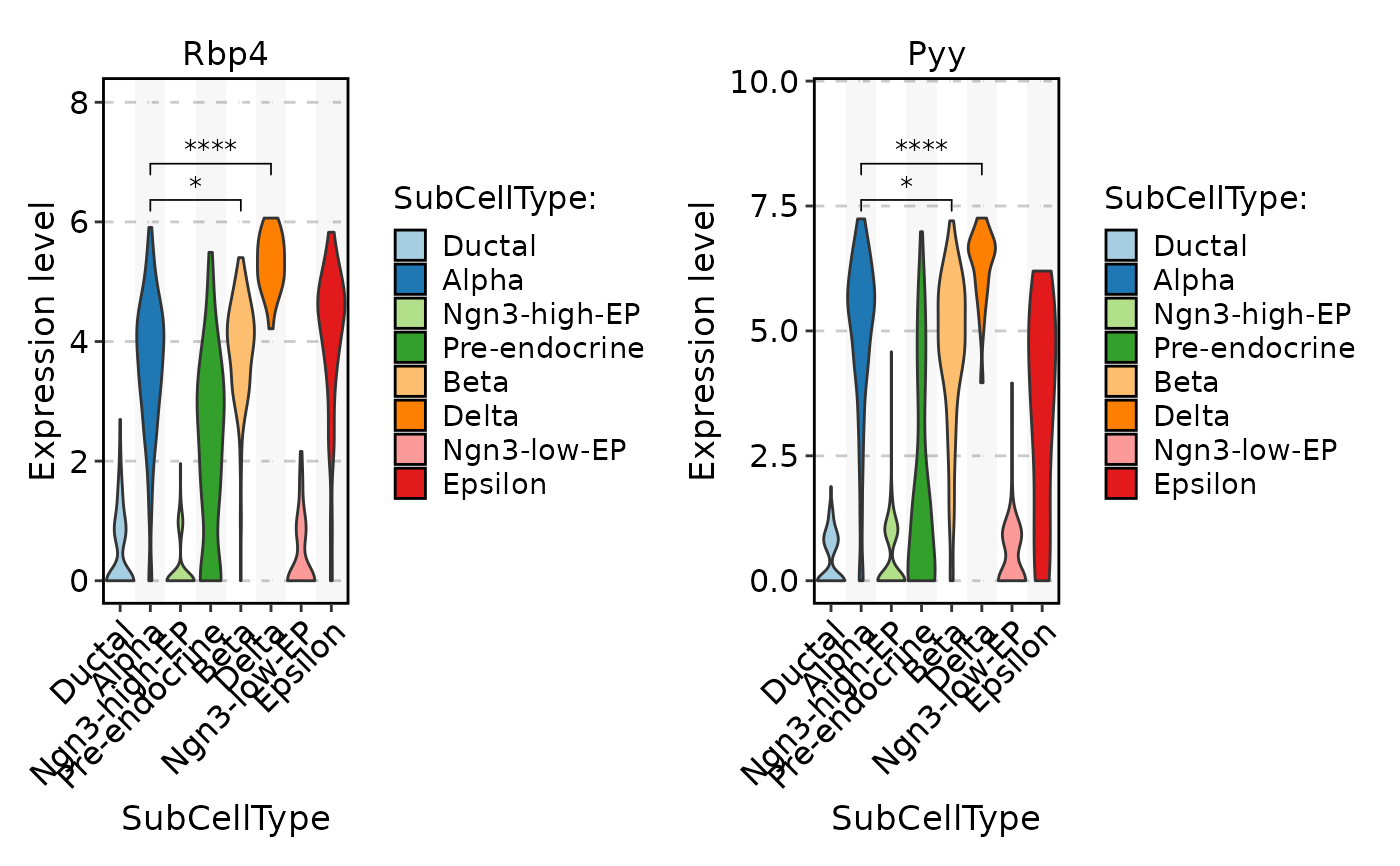
 FeatureStatPlot(
pancreas_sub,
stat.by = c("Rbp4", "Pyy"),
group.by = "SubCellType",
auto_comparison = TRUE,
sig_label = "p.signif"
)
#> Warning: No shared levels found between `names(values)` of the manual scale and the
#> data's colour values.
#> Warning: No shared levels found between `names(values)` of the manual scale and the
#> data's colour values.
FeatureStatPlot(
pancreas_sub,
stat.by = c("Rbp4", "Pyy"),
group.by = "SubCellType",
auto_comparison = TRUE,
sig_label = "p.signif"
)
#> Warning: No shared levels found between `names(values)` of the manual scale and the
#> data's colour values.
#> Warning: No shared levels found between `names(values)` of the manual scale and the
#> data's colour values.
 FeatureStatPlot(
pancreas_sub,
stat.by = c("Rbp4", "Pyy"),
group.by = "SubCellType",
comparisons = list(c("Alpha", "Beta"), c("Alpha", "Delta"))
)
#> Warning: No shared levels found between `names(values)` of the manual scale and the
#> data's colour values.
#> Warning: No shared levels found between `names(values)` of the manual scale and the
#> data's colour values.
FeatureStatPlot(
pancreas_sub,
stat.by = c("Rbp4", "Pyy"),
group.by = "SubCellType",
comparisons = list(c("Alpha", "Beta"), c("Alpha", "Delta"))
)
#> Warning: No shared levels found between `names(values)` of the manual scale and the
#> data's colour values.
#> Warning: No shared levels found between `names(values)` of the manual scale and the
#> data's colour values.
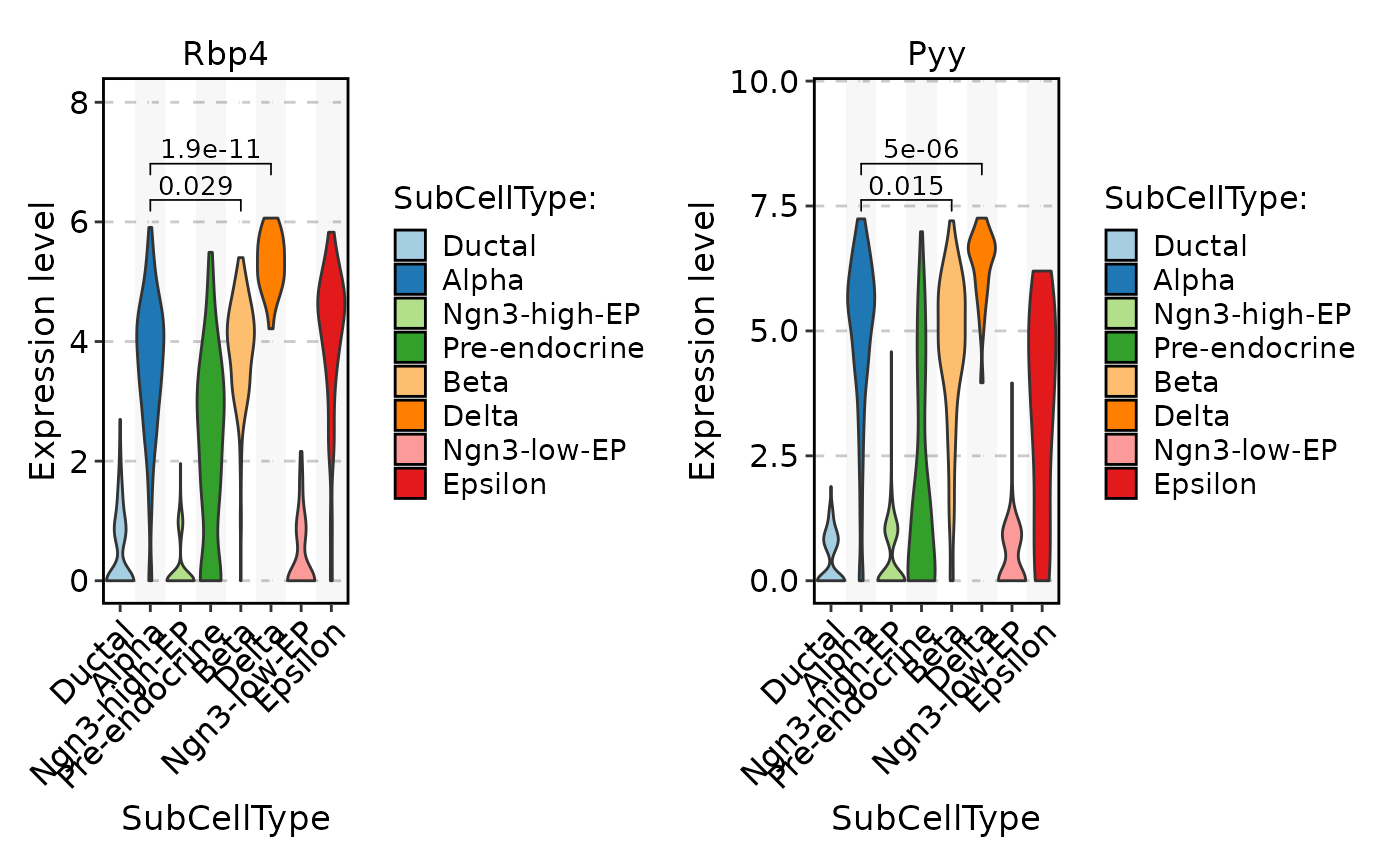 FeatureStatPlot(
pancreas_sub,
stat.by = c("Rbp4", "Pyy"),
group.by = "SubCellType",
comparisons = list(c("Alpha", "Beta"), c("Alpha", "Delta")),
sig_label = "p.format"
)
#> Warning: No shared levels found between `names(values)` of the manual scale and the
#> data's colour values.
#> Warning: No shared levels found between `names(values)` of the manual scale and the
#> data's colour values.
FeatureStatPlot(
pancreas_sub,
stat.by = c("Rbp4", "Pyy"),
group.by = "SubCellType",
comparisons = list(c("Alpha", "Beta"), c("Alpha", "Delta")),
sig_label = "p.format"
)
#> Warning: No shared levels found between `names(values)` of the manual scale and the
#> data's colour values.
#> Warning: No shared levels found between `names(values)` of the manual scale and the
#> data's colour values.
 FeatureStatPlot(
pancreas_sub,
stat.by = "Fev",
group.by = "SubCellType",
split.by = "Phase",
comparisons = TRUE
) + FeatureStatPlot(
pancreas_sub,
stat.by = "Fev",
group.by = "SubCellType",
split.by = "Phase",
comparisons = TRUE,
y.max = 5
)
#> ! [2026-07-02 09:05:03] Removed 10 groups with < 2 observations for violin plot: "sp-S-gp-Beta", "sp-G2M-gp-Beta", "sp-S-gp-Pre-endocrine", "sp-G2M-gp-Pre-endocrine", "sp-S-gp-Alpha", "sp-G2M-gp-Alpha", "sp-S-gp-Epsilon", "sp-G2M-gp-Epsilon", "sp-S-gp-Delta", and "sp-G2M-gp-Delta"
#> ℹ [2026-07-02 09:05:03] Detected more than 2 groups. Use "kruskal.test" for comparison
#> Warning: No shared levels found between `names(values)` of the manual scale and the
#> data's colour values.
#> Warning: No shared levels found between `names(values)` of the manual scale and the
#> data's colour values.
FeatureStatPlot(
pancreas_sub,
stat.by = "Fev",
group.by = "SubCellType",
split.by = "Phase",
comparisons = TRUE
) + FeatureStatPlot(
pancreas_sub,
stat.by = "Fev",
group.by = "SubCellType",
split.by = "Phase",
comparisons = TRUE,
y.max = 5
)
#> ! [2026-07-02 09:05:03] Removed 10 groups with < 2 observations for violin plot: "sp-S-gp-Beta", "sp-G2M-gp-Beta", "sp-S-gp-Pre-endocrine", "sp-G2M-gp-Pre-endocrine", "sp-S-gp-Alpha", "sp-G2M-gp-Alpha", "sp-S-gp-Epsilon", "sp-G2M-gp-Epsilon", "sp-S-gp-Delta", and "sp-G2M-gp-Delta"
#> ℹ [2026-07-02 09:05:03] Detected more than 2 groups. Use "kruskal.test" for comparison
#> ! [2026-07-02 09:05:03] Removed 10 groups with < 2 observations for violin plot: "sp-S-gp-Beta", "sp-G2M-gp-Beta", "sp-S-gp-Pre-endocrine", "sp-G2M-gp-Pre-endocrine", "sp-S-gp-Alpha", "sp-G2M-gp-Alpha", "sp-S-gp-Epsilon", "sp-G2M-gp-Epsilon", "sp-S-gp-Delta", and "sp-G2M-gp-Delta"
#> ℹ [2026-07-02 09:05:03] Detected more than 2 groups. Use "kruskal.test" for comparison
#> Warning: No shared levels found between `names(values)` of the manual scale and the
#> data's colour values.
#> Warning: No shared levels found between `names(values)` of the manual scale and the
#> data's colour values.
 FeatureStatPlot(
pancreas_sub,
stat.by = c("Rbp4", "Pyy"),
group.by = "SubCellType",
bg.by = "CellType",
add_box = TRUE, stack = TRUE
)
FeatureStatPlot(
pancreas_sub,
stat.by = c("Rbp4", "Pyy"),
group.by = "SubCellType",
bg.by = "CellType",
add_box = TRUE, stack = TRUE
)
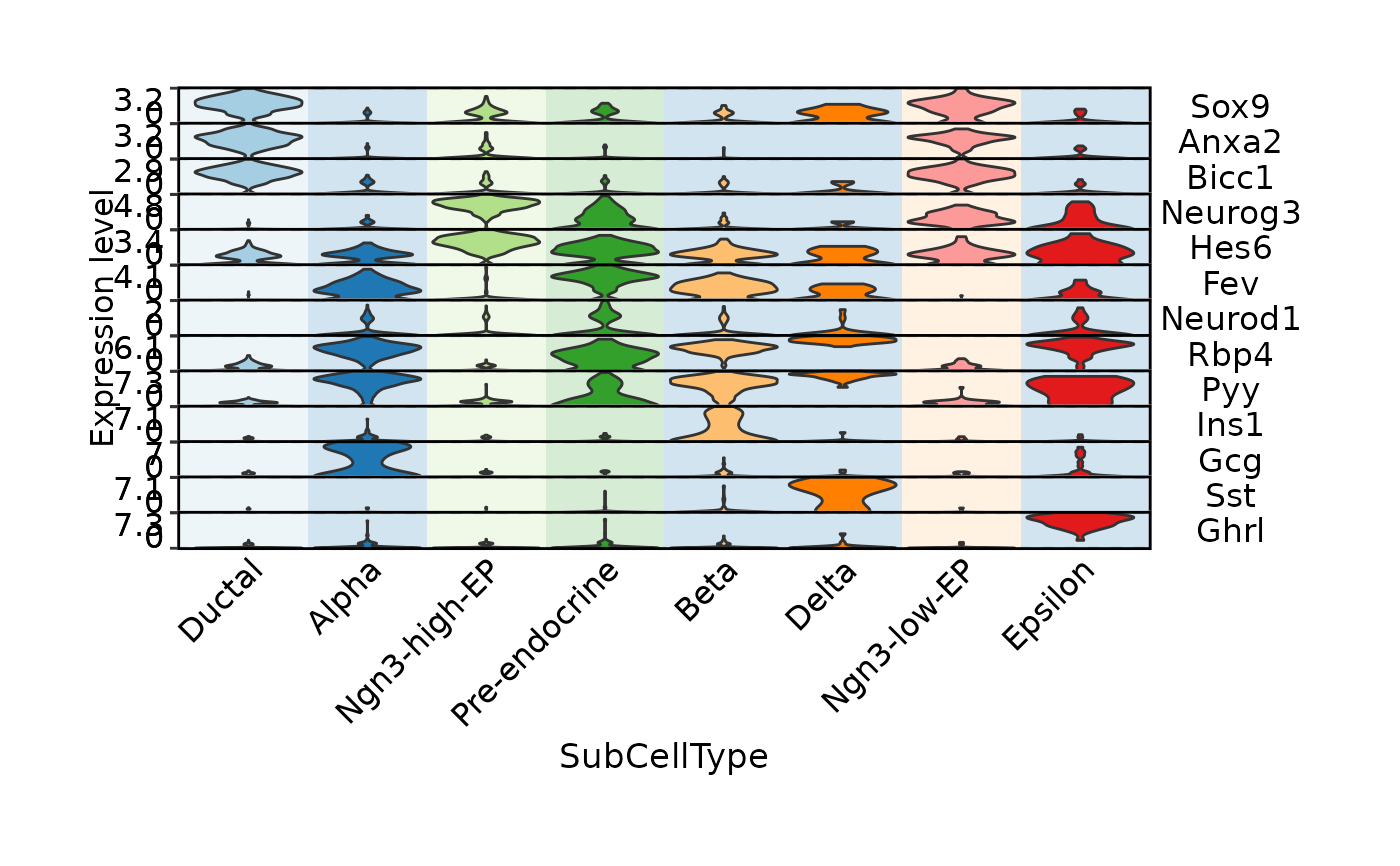
 FeatureStatPlot(
pancreas_sub,
stat.by = c(
# Ductal
"Sox9", "Anxa2", "Bicc1",
# EPs
"Neurog3", "Hes6",
# Pre-endocrine
"Fev", "Neurod1",
# Endocrine
"Rbp4", "Pyy",
# Beta, Alpha, Delta, Epsilon
"Ins1", "Gcg", "Sst", "Ghrl"
),
legend.position = "top",
legend.direction = "horizontal",
group.by = "SubCellType",
bg.by = "CellType",
stack = TRUE
)
FeatureStatPlot(
pancreas_sub,
stat.by = c(
# Ductal
"Sox9", "Anxa2", "Bicc1",
# EPs
"Neurog3", "Hes6",
# Pre-endocrine
"Fev", "Neurod1",
# Endocrine
"Rbp4", "Pyy",
# Beta, Alpha, Delta, Epsilon
"Ins1", "Gcg", "Sst", "Ghrl"
),
legend.position = "top",
legend.direction = "horizontal",
group.by = "SubCellType",
bg.by = "CellType",
stack = TRUE
)
 FeatureStatPlot(
pancreas_sub,
stat.by = c(
# Ductal
"Sox9", "Anxa2", "Bicc1",
# EPs
"Neurog3", "Hes6",
# Pre-endocrine
"Fev", "Neurod1",
# Endocrine
"Rbp4", "Pyy",
# Beta, Alpha, Delta, Epsilon
"Ins1", "Gcg", "Sst", "Ghrl"
),
fill.by = "feature",
plot_type = "box",
group.by = "SubCellType",
bg.by = "CellType", stack = TRUE, flip = TRUE
) |> thisplot::panel_fix_overall(
width = 8, height = 5
)
FeatureStatPlot(
pancreas_sub,
stat.by = c(
# Ductal
"Sox9", "Anxa2", "Bicc1",
# EPs
"Neurog3", "Hes6",
# Pre-endocrine
"Fev", "Neurod1",
# Endocrine
"Rbp4", "Pyy",
# Beta, Alpha, Delta, Epsilon
"Ins1", "Gcg", "Sst", "Ghrl"
),
fill.by = "feature",
plot_type = "box",
group.by = "SubCellType",
bg.by = "CellType", stack = TRUE, flip = TRUE
) |> thisplot::panel_fix_overall(
width = 8, height = 5
)
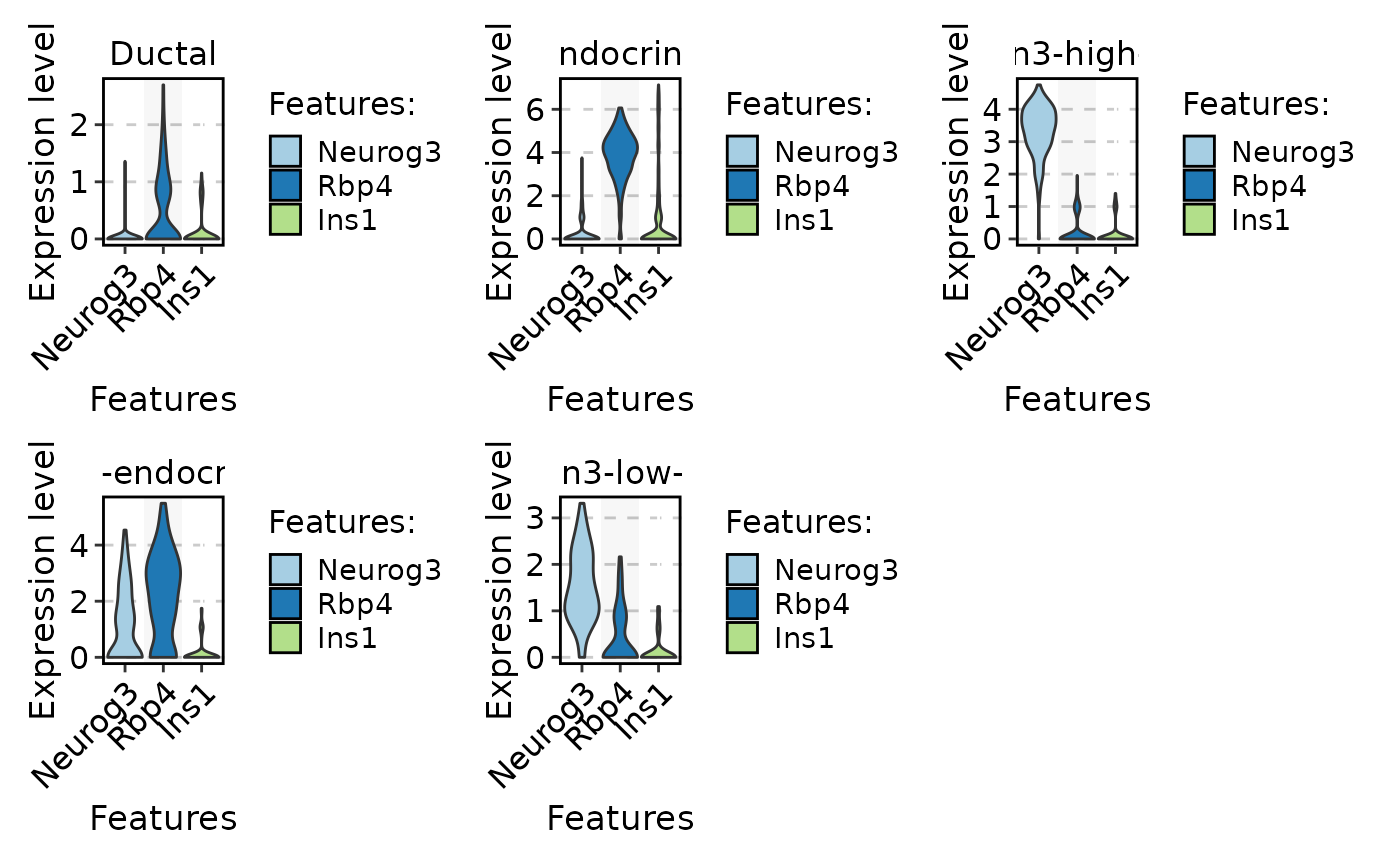 FeatureStatPlot(
pancreas_sub,
stat.by = c("Neurog3", "Rbp4", "Ins1"),
group.by = "CellType",
plot.by = "group"
)
#> Warning: No shared levels found between `names(values)` of the manual scale and the
#> data's colour values.
#> Warning: No shared levels found between `names(values)` of the manual scale and the
#> data's colour values.
#> Warning: No shared levels found between `names(values)` of the manual scale and the
#> data's colour values.
FeatureStatPlot(
pancreas_sub,
stat.by = c("Neurog3", "Rbp4", "Ins1"),
group.by = "CellType",
plot.by = "group"
)
#> Warning: No shared levels found between `names(values)` of the manual scale and the
#> data's colour values.
#> Warning: No shared levels found between `names(values)` of the manual scale and the
#> data's colour values.
#> Warning: No shared levels found between `names(values)` of the manual scale and the
#> data's colour values.
 FeatureStatPlot(
pancreas_sub,
stat.by = c("Neurog3", "Rbp4", "Ins1"),
group.by = "CellType",
plot.by = "feature"
)
#> ℹ [2026-07-02 09:05:16] Setting `group.by` to "Features" as `plot.by` is set to "feature"
#> Warning: No shared levels found between `names(values)` of the manual scale and the
#> data's colour values.
#> Warning: No shared levels found between `names(values)` of the manual scale and the
#> data's colour values.
#> Warning: No shared levels found between `names(values)` of the manual scale and the
#> data's colour values.
#> Warning: No shared levels found between `names(values)` of the manual scale and the
#> data's colour values.
#> Warning: No shared levels found between `names(values)` of the manual scale and the
#> data's colour values.
FeatureStatPlot(
pancreas_sub,
stat.by = c("Neurog3", "Rbp4", "Ins1"),
group.by = "CellType",
plot.by = "feature"
)
#> ℹ [2026-07-02 09:05:16] Setting `group.by` to "Features" as `plot.by` is set to "feature"
#> Warning: No shared levels found between `names(values)` of the manual scale and the
#> data's colour values.
#> Warning: No shared levels found between `names(values)` of the manual scale and the
#> data's colour values.
#> Warning: No shared levels found between `names(values)` of the manual scale and the
#> data's colour values.
#> Warning: No shared levels found between `names(values)` of the manual scale and the
#> data's colour values.
#> Warning: No shared levels found between `names(values)` of the manual scale and the
#> data's colour values.
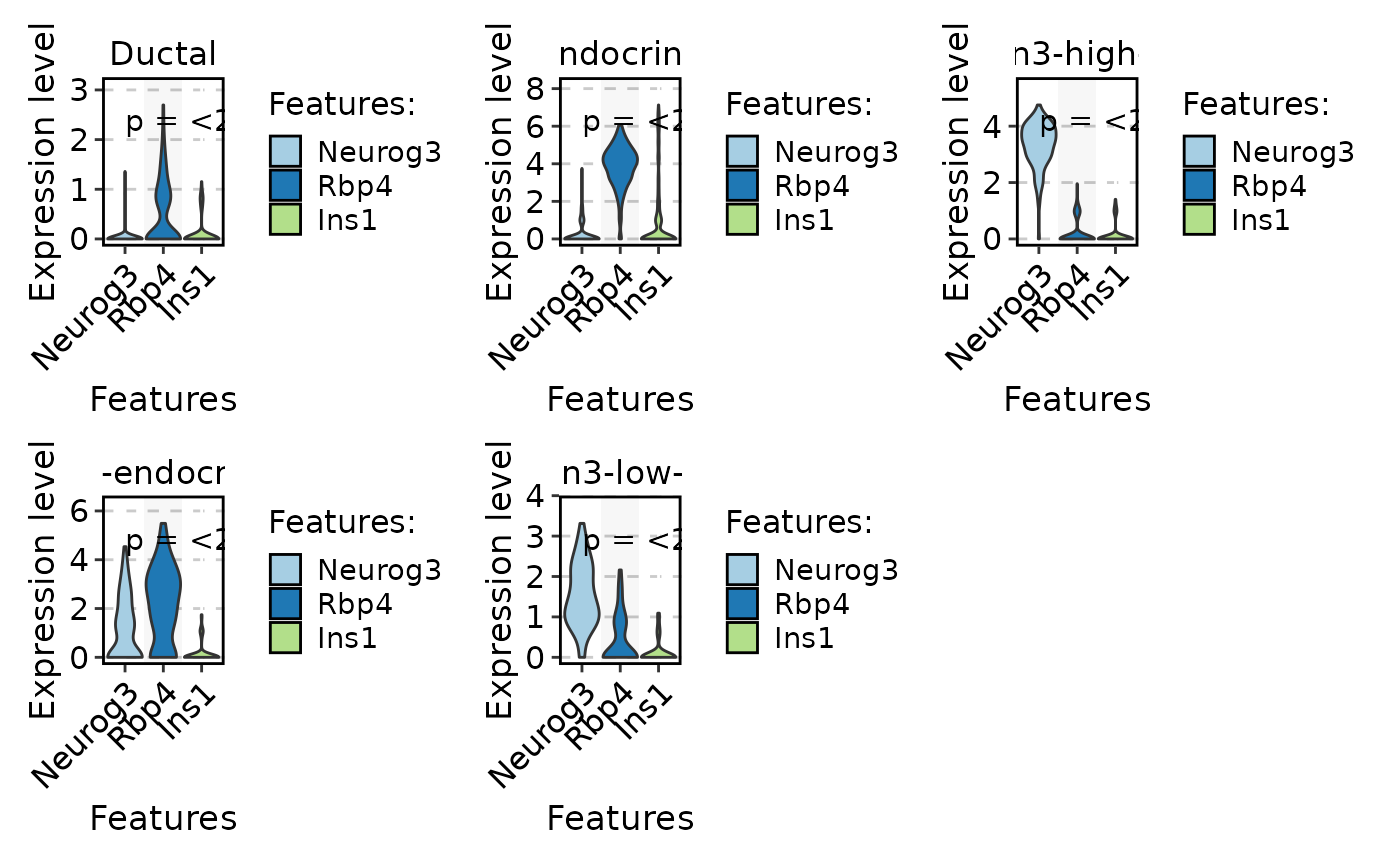
 FeatureStatPlot(
pancreas_sub,
stat.by = c("Neurog3", "Rbp4", "Ins1"),
group.by = "CellType",
plot.by = "feature",
multiplegroup_comparisons = TRUE,
sig_label = "p.format",
sig_labelsize = 4
)
#> ℹ [2026-07-02 09:05:17] Setting `group.by` to "Features" as `plot.by` is set to "feature"
#> Warning: No shared levels found between `names(values)` of the manual scale and the
#> data's colour values.
#> Warning: No shared levels found between `names(values)` of the manual scale and the
#> data's colour values.
#> Warning: No shared levels found between `names(values)` of the manual scale and the
#> data's colour values.
#> Warning: No shared levels found between `names(values)` of the manual scale and the
#> data's colour values.
#> Warning: No shared levels found between `names(values)` of the manual scale and the
#> data's colour values.
FeatureStatPlot(
pancreas_sub,
stat.by = c("Neurog3", "Rbp4", "Ins1"),
group.by = "CellType",
plot.by = "feature",
multiplegroup_comparisons = TRUE,
sig_label = "p.format",
sig_labelsize = 4
)
#> ℹ [2026-07-02 09:05:17] Setting `group.by` to "Features" as `plot.by` is set to "feature"
#> Warning: No shared levels found between `names(values)` of the manual scale and the
#> data's colour values.
#> Warning: No shared levels found between `names(values)` of the manual scale and the
#> data's colour values.
#> Warning: No shared levels found between `names(values)` of the manual scale and the
#> data's colour values.
#> Warning: No shared levels found between `names(values)` of the manual scale and the
#> data's colour values.
#> Warning: No shared levels found between `names(values)` of the manual scale and the
#> data's colour values.
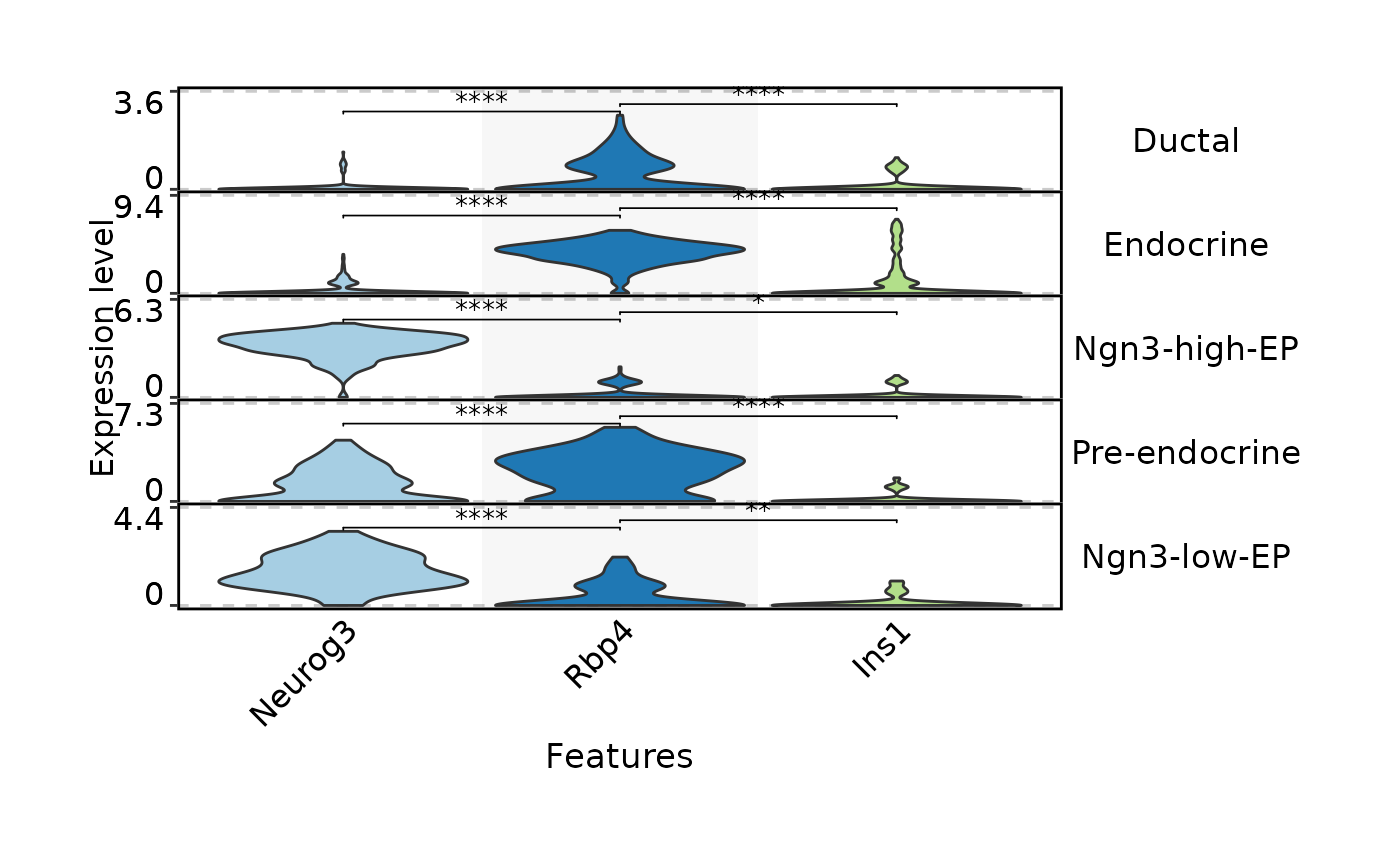
 FeatureStatPlot(
pancreas_sub,
stat.by = c("Neurog3", "Rbp4", "Ins1"),
group.by = "CellType",
plot.by = "feature",
comparisons = list(
c("Neurog3", "Rbp4"),
c("Rbp4", "Ins1")
),
stack = TRUE
)
#> ℹ [2026-07-02 09:05:20] Setting `group.by` to "Features" as `plot.by` is set to "feature"
FeatureStatPlot(
pancreas_sub,
stat.by = c("Neurog3", "Rbp4", "Ins1"),
group.by = "CellType",
plot.by = "feature",
comparisons = list(
c("Neurog3", "Rbp4"),
c("Rbp4", "Ins1")
),
stack = TRUE
)
#> ℹ [2026-07-02 09:05:20] Setting `group.by` to "Features" as `plot.by` is set to "feature"
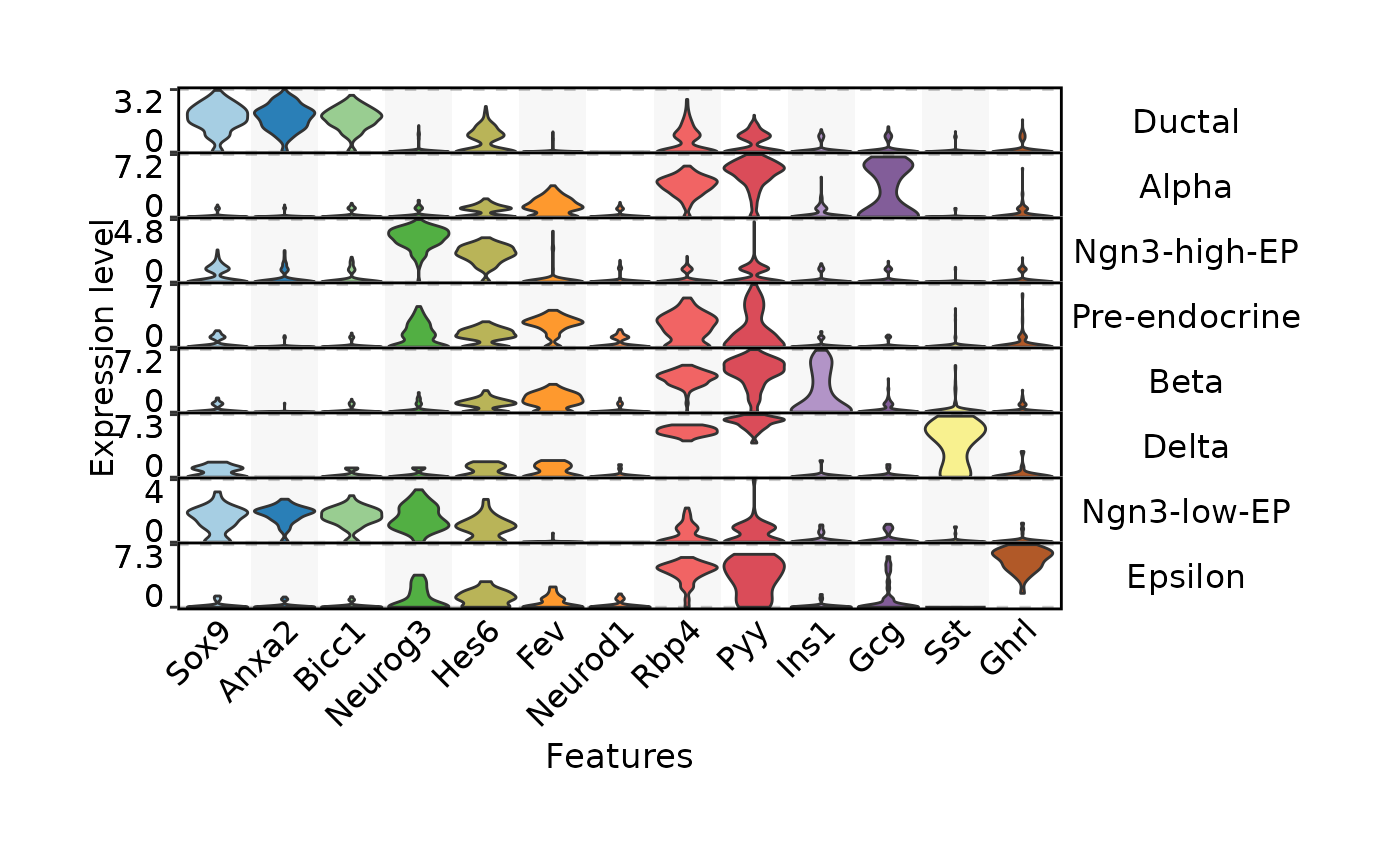
 FeatureStatPlot(pancreas_sub,
stat.by = c(
# Ductal
"Sox9", "Anxa2", "Bicc1",
# EPs
"Neurog3", "Hes6",
# Pre-endocrine
"Fev", "Neurod1",
# Endocrine
"Rbp4", "Pyy",
# Beta, Alpha, Delta, Epsilon
"Ins1", "Gcg", "Sst", "Ghrl"
),
group.by = "SubCellType",
plot.by = "feature",
stack = TRUE
)
#> ℹ [2026-07-02 09:05:23] Setting `group.by` to "Features" as `plot.by` is set to "feature"
FeatureStatPlot(pancreas_sub,
stat.by = c(
# Ductal
"Sox9", "Anxa2", "Bicc1",
# EPs
"Neurog3", "Hes6",
# Pre-endocrine
"Fev", "Neurod1",
# Endocrine
"Rbp4", "Pyy",
# Beta, Alpha, Delta, Epsilon
"Ins1", "Gcg", "Sst", "Ghrl"
),
group.by = "SubCellType",
plot.by = "feature",
stack = TRUE
)
#> ℹ [2026-07-02 09:05:23] Setting `group.by` to "Features" as `plot.by` is set to "feature"
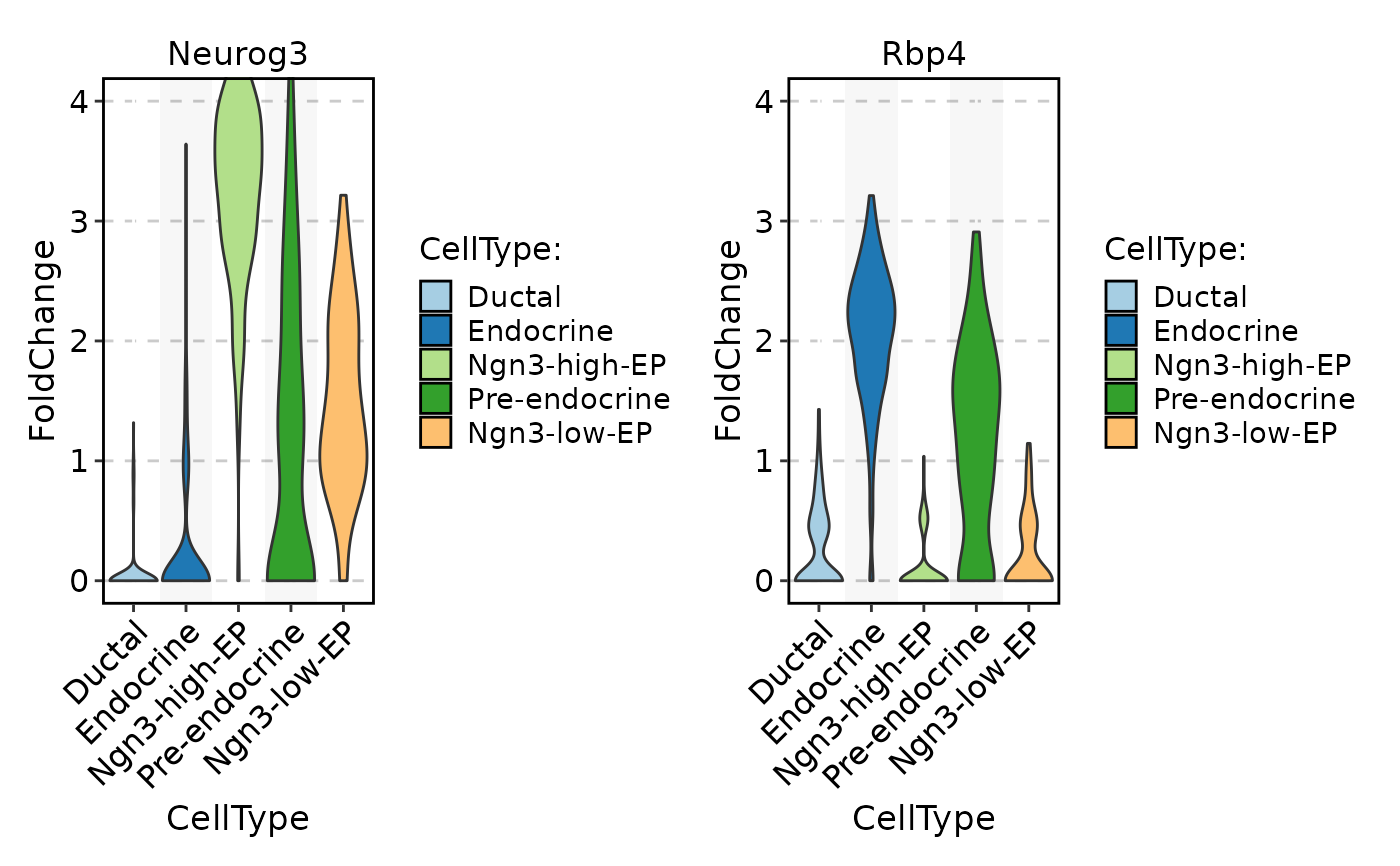
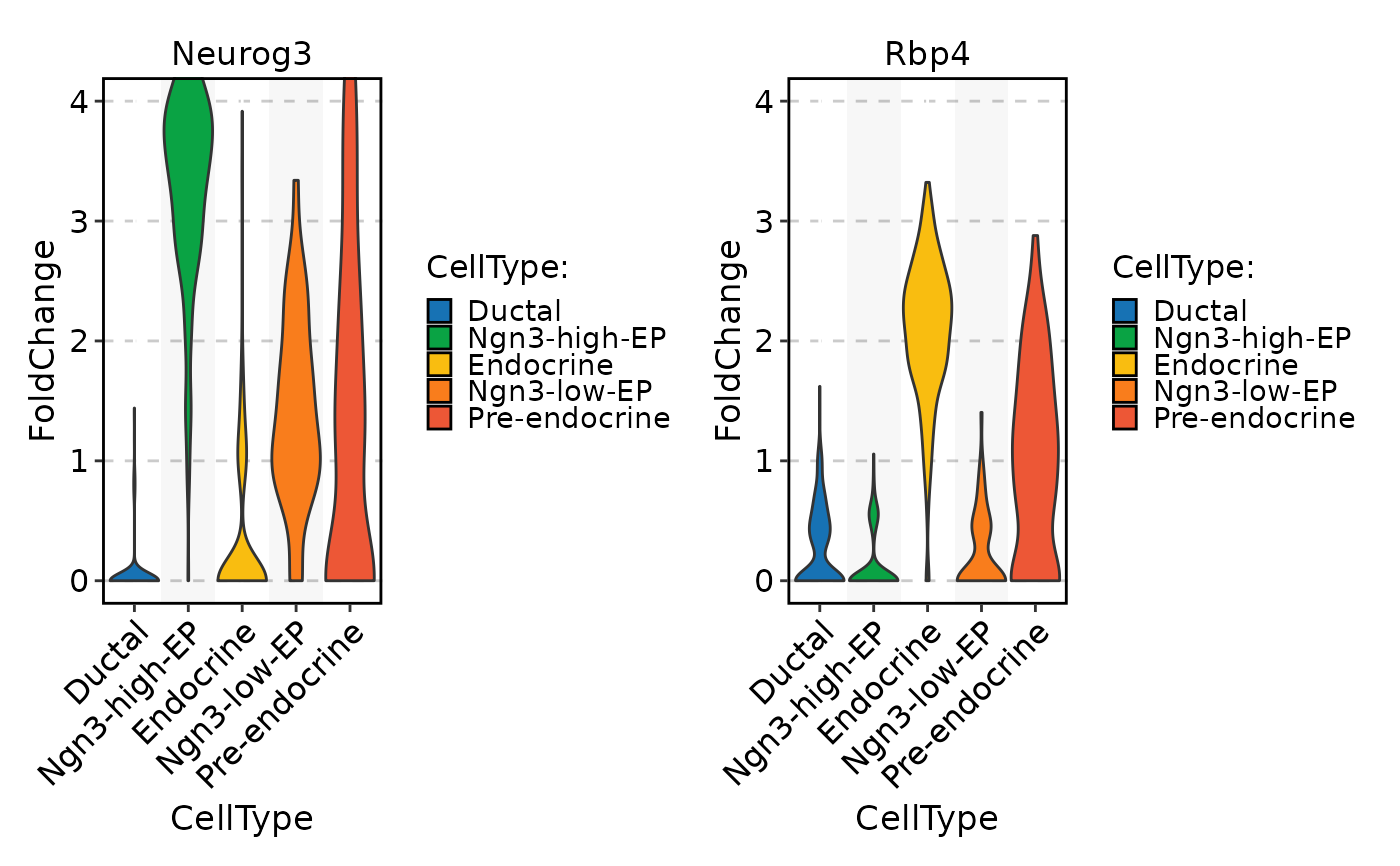 data <- GetAssayData5(
pancreas_sub,
assay = "RNA",
layer = "data"
)
pancreas_sub <- SeuratObject::SetAssayData(
object = pancreas_sub,
layer = "scale.data",
assay = "RNA",
new.data = data / Matrix::rowMeans(data)
)
#> Warning: Different features in new layer data than already exists for scale.data
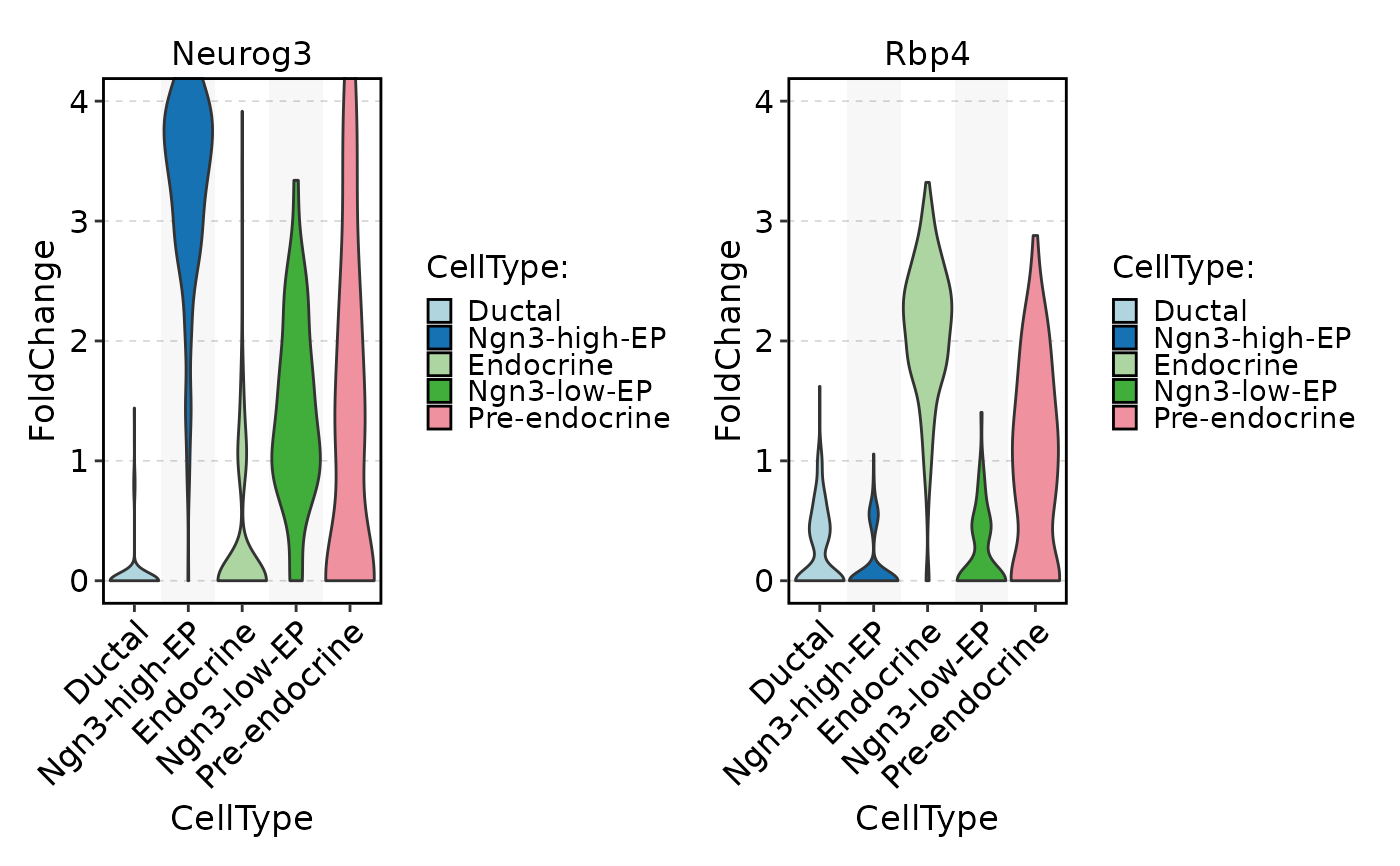
FeatureStatPlot(
pancreas_sub,
stat.by = c("Neurog3", "Rbp4"),
group.by = "CellType",
layer = "scale.data",
ylab = "FoldChange",
same.y.lims = TRUE,
y.max = 4
)
#> Warning: No shared levels found between `names(values)` of the manual scale and the
#> data's colour values.
#> Warning: No shared levels found between `names(values)` of the manual scale and the
#> data's colour values.
data <- GetAssayData5(
pancreas_sub,
assay = "RNA",
layer = "data"
)
pancreas_sub <- SeuratObject::SetAssayData(
object = pancreas_sub,
layer = "scale.data",
assay = "RNA",
new.data = data / Matrix::rowMeans(data)
)
#> Warning: Different features in new layer data than already exists for scale.data
FeatureStatPlot(
pancreas_sub,
stat.by = c("Neurog3", "Rbp4"),
group.by = "CellType",
layer = "scale.data",
ylab = "FoldChange",
same.y.lims = TRUE,
y.max = 4
)
#> Warning: No shared levels found between `names(values)` of the manual scale and the
#> data's colour values.
#> Warning: No shared levels found between `names(values)` of the manual scale and the
#> data's colour values.