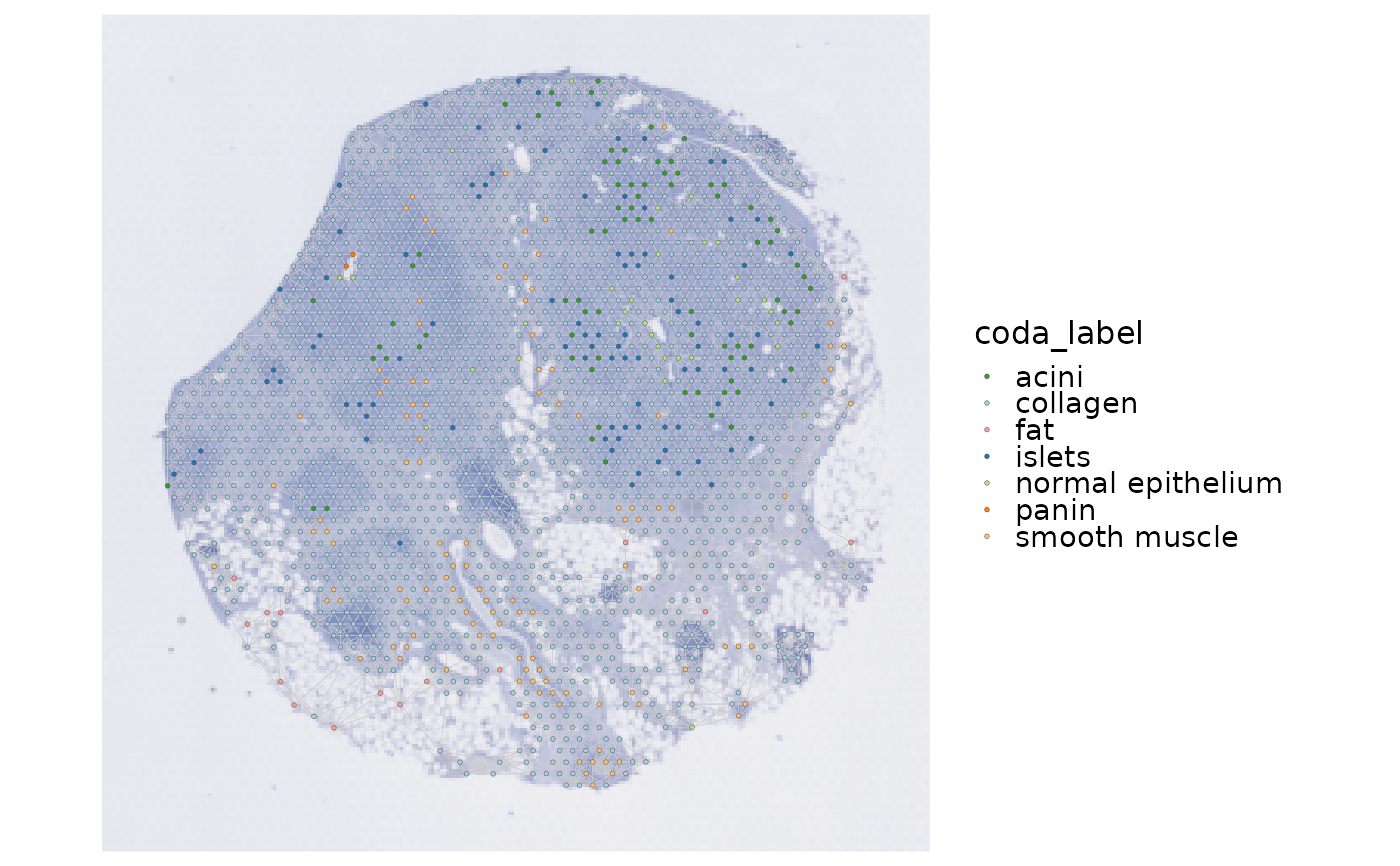
Plot a graph produced by [RunSpatialNetwork()]. The graph can be read from a Seurat object or supplied directly as `srt@tools$SpatialNetwork`.
Usage
SpatialNetworkPlot(
  object = NULL,
  res = NULL,
  graph.name = NULL,
  group.by = NULL,
  edge.color = "grey80",
  edge.linewidth = 0.2,
  pt.size = NULL,
  pt.alpha = 1,
  palette = "Paired",
  palcolor = NULL,
  raster = FALSE,
  raster.dpi = 300,
  theme_use = "theme_spatial",
  theme_args = list(),
  image.scale = c("lowres", "hires")
)
Arguments
- object
Optional `Seurat` object containing the graph and metadata.
- res
Optional plain result list from `object@tools$SpatialNetwork`.
- graph.name
Stored graph name. The active graph is used when `NULL`.
- group.by
Node column or Seurat metadata column used for coloring.
- edge.color, edge.linewidth
Edge appearance.
- pt.size, pt.alpha
Node appearance.
- palette, palcolor
Palette name or explicit colors.
- raster
Whether to rasterize only the node layer.
- raster.dpi
Node rasterization resolution.
- theme_use, theme_args
Theme used to style the plot. Default is `"theme_spatial"`.
- image.scale
Image scale factor matching the raster in `object`.
Examples
data(visium_human_pancreas_sub)
spatial <- RunSpatialNetwork(
  visium_human_pancreas_sub,
  k = 6,
  coord.cols = c("x", "y"),
  verbose = FALSE
)
SpatialNetworkPlot(
  spatial,
  group.by = "coda_label",
  edge.linewidth = 0.15,
  pt.size = 0.8
)