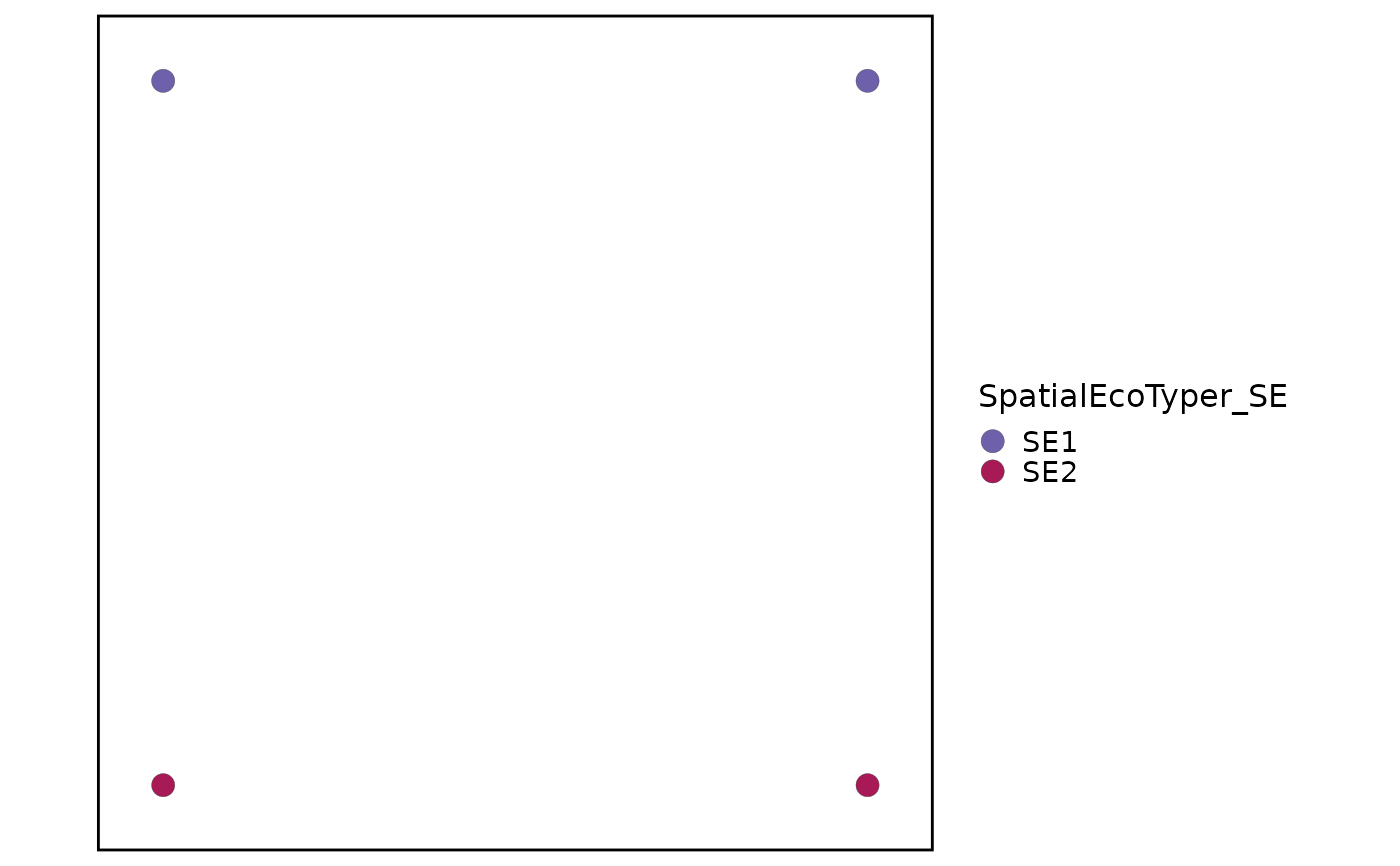
Plot SpatialEcoTyper labels on spatial coordinates using the spatial plotting style.
Arguments
- srt
A
Seuratobject.- group.by
Metadata column containing SpatialEcoTyper labels.
- x.by, y.by
Metadata coordinate columns used when no image coordinates are available.
- image
Spatial image name. Required when multiple images are present; a single image is selected automatically when
NULL.- overlay_image
Whether to draw the selected spatial image.
- coord.cols
Metadata coordinate columns used when no image is available.
- palette, palcolor
Palette passed to
palette_colors().- theme_use
Theme name or function.
- image.scale
Image scale factor matching the raster stored in the selected image. Use
"hires"for a hires raster; do not modify Seurat scale-factor slots.- ...
Additional arguments passed to
SpatialSpotPlot().
Examples
counts <- matrix(
  c(3, 0, 1, 2, 0, 4, 1, 0, 2, 1, 3, 0),
  nrow = 3,
  byrow = TRUE
)
rownames(counts) <- c("EPCAM", "COL1A1", "PTPRC")
colnames(counts) <- paste0("spot", 1:4)
srt <- Seurat::CreateSeuratObject(counts)
#> Warning: Data is of class matrix. Coercing to dgCMatrix.
srt$X <- c(0, 1, 0, 1)
srt$Y <- c(0, 0, 1, 1)
srt$SpatialEcoTyper_SE <- c("SE1", "SE1", "SE2", "SE2")
srt$CellType <- c("Epithelial", "Fibroblast", "Immune", "Epithelial")

SpatialEcoTyperSpatialPlot(
  srt,
  overlay_image = FALSE,
  coord.cols = c("X", "Y"),
  pt.size = 4
)