Plot cell segmentation polygons from a boundary table or Seurat spatial image.
Usage
SpatialCellPlot(
  object = NULL,
  res = NULL,
  boundaries = NULL,
  cells = NULL,
  image = NULL,
  crop = TRUE,
  group.by = NULL,
  features = NULL,
  palette = NULL,
  palcolor = NULL,
  fill.alpha = 0.7,
  boundary.color = "grey30",
  boundary.linewidth = 0.1,
  theme_use = "theme_spatial",
  theme_args = list(),
  assay = NULL,
  layer = "data",
  ...,
  combine = TRUE,
  nrow = NULL,
  ncol = NULL,
  byrow = TRUE,
  legend.position = "right",
  legend.direction = "vertical",
  legend.title = NULL
)
Arguments
- object
Optional `Seurat` object used to extract boundaries or values.
- res
Optional result list containing a `boundaries` data frame.
- boundaries
Optional boundary data frame.
- cells
Optional cell or spot identifiers to retain.
- image
Seurat image name. Multi-image objects require an explicit name.
- crop
Whether to crop the plot to the selected boundaries.
- group.by
Boundary column or Seurat metadata column used for filling.
- features
Features to display. Multiple features return a patchwork.
- palette, palcolor
Palette name or explicit colors. The default uses `"Paired"` for categories and sequential `"YlGnBu"` for numeric values. Named colors are matched to category names.
- fill.alpha
Polygon fill opacity.
- boundary.color, boundary.linewidth
Boundary appearance.
- theme_use, theme_args
Theme used to style the plot. Default is `"theme_spatial"`.
- assay
Assay used when `features` are fetched from `object`.
- layer
Layer used when `features` are fetched from `object`.
- ...
Additional arguments passed to `ggplot2::geom_polygon()`.
- combine
Return combined panels, or a named list when `FALSE`.
- nrow, ncol, byrow
Layout controls for multiple feature panels.
- legend.position, legend.direction, legend.title
Legend controls.
Details
Boundary tables require `cell_id`, `x`, and `y` columns in polygon vertex order. Seurat images must contain segmentation boundaries.
Examples
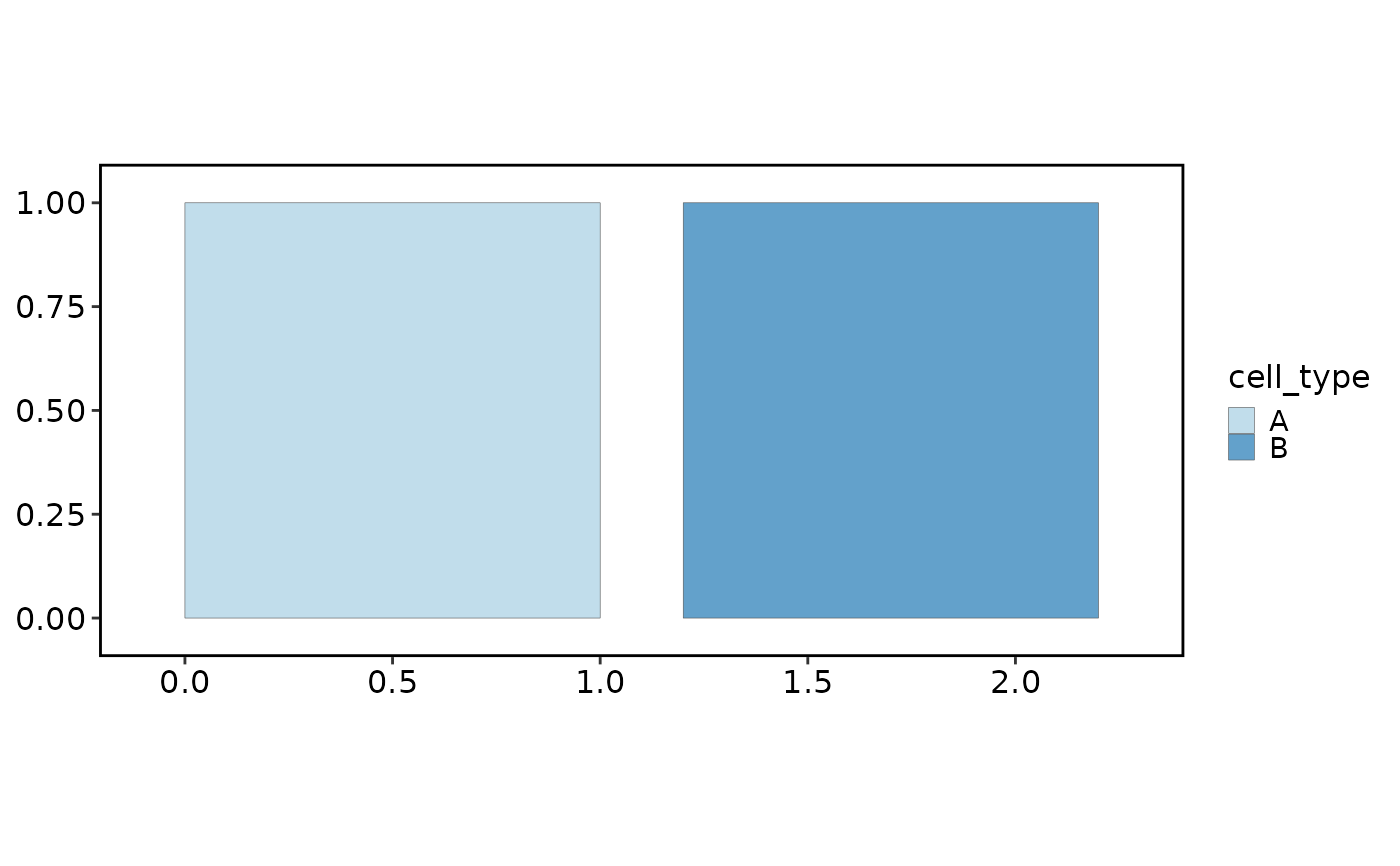
# Constructed polygons demonstrate plotting, not a segmentation algorithm.
boundaries <- data.frame(
  cell_id = rep(c("cell1", "cell2"), each = 4),
  x = c(0, 2, 2, 0, 3, 5, 5, 3), y = rep(c(0, 0, 1, 1), 2),
  cell_type = rep(c("A", "B"), each = 4)
)
SpatialCellPlot(boundaries = boundaries, group.by = "cell_type")