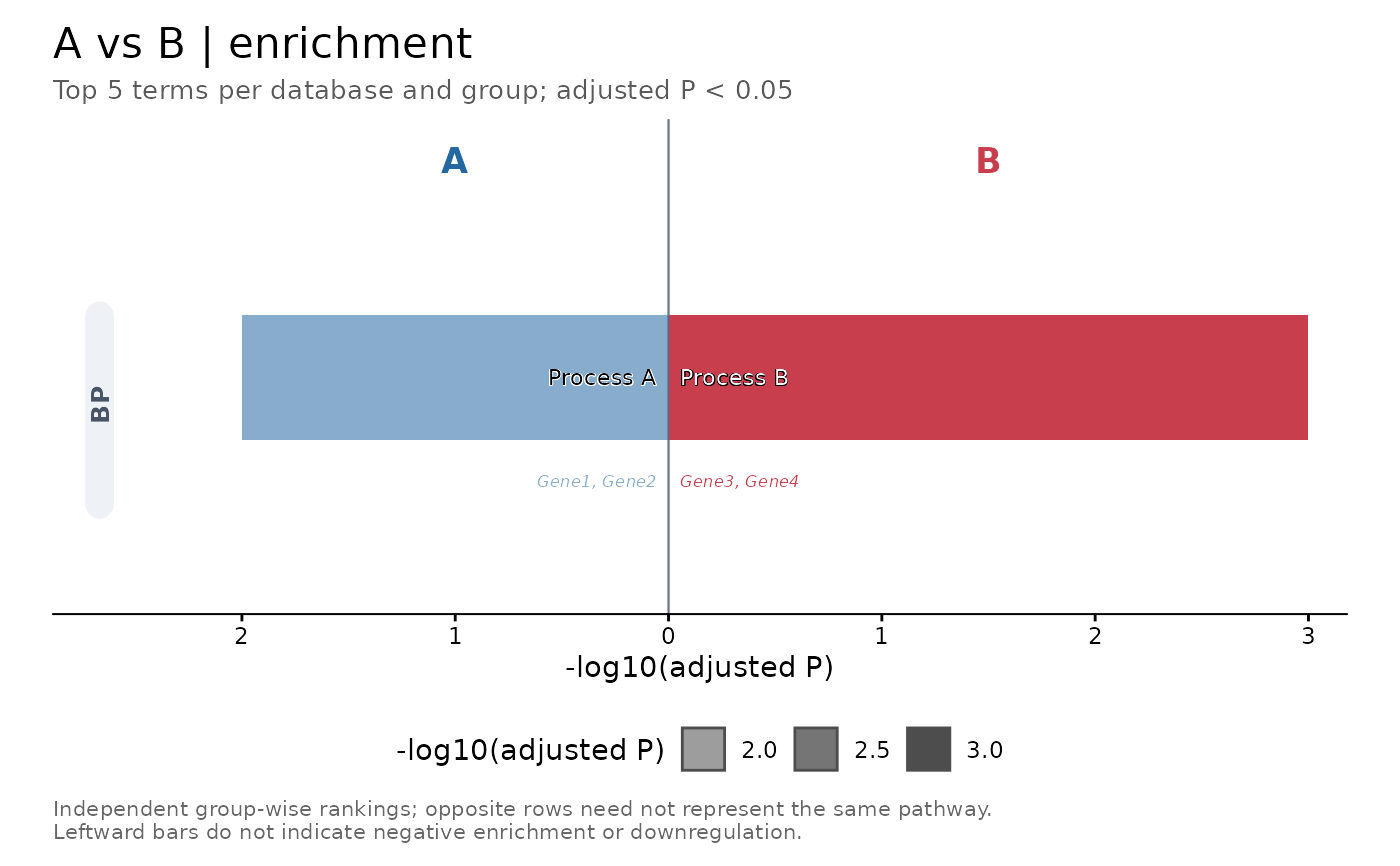
Mirror stored enrichment results for two groups
Source:R/EnrichmentMirrorPlot.R
EnrichmentMirrorPlot.RdDraw independent ranked GO or other database results on opposite sides of zero. No enrichment or differential comparison is computed. Group colors and shared significance opacity encode the saved results; full term labels may extend past bars. Hit genes appear below each bar and database bands are rounded.
Usage
EnrichmentMirrorPlot(
  object = NULL,
  group.by = NULL,
  group_use = NULL,
  test.use = "wilcox",
  db = c("GO_BP", "GO_CC", "GO_MF"),
  topTerm = 5,
  padjustCutoff = 0.05,
  palcolor = c("#2468A2", "#C83E4D"),
  row_step = 0.84,
  db_gap = 0.4,
  bar_height = 0.46,
  term_size = 3,
  gene_size = 2.2,
  gene_width = 82,
  alpha_range = c(0.55, 1),
  corner_mm = 2,
  title = NULL,
  symmetric_axis = FALSE,
  band_gap = 0.6,
  base_size = 11,
  font_family = "sans",
  res = NULL
)
Arguments
- object
Seurat object containing saved RunEnrichment results; NULL when res is supplied.
- group.by
Saved enrichment grouping key; NULL selects custom results.
- group_use
Character vector of exactly two groups, left then right.
- test.use
Saved differential-test key; defaults to wilcox.
- db
Database names, in display order. GO aliases are expanded using stored results.
- topTerm
Positive integer number of terms per database and group, default 5.
- padjustCutoff
Adjusted P cutoff in (0, 1]; terms strictly below it are retained.
- palcolor
Two group colors; unnamed colors follow group_use, named colors match group names.
- row_step, db_gap
Positive row spacing and non-negative extra database gap, in y-axis units.
- bar_height
Positive bar height in y-axis units.
- term_size, gene_size
Positive term and gene text sizes in mm.
- gene_width
Maximum gene-label characters, including ellipsis; at least 4 or Inf. Term names are never truncated.
- alpha_range
Increasing two-element opacity range within [0, 1].
- corner_mm
Positive database-band corner radius in mm.
- title
Optional plot title; NULL creates a title from the selected groups.
- symmetric_axis
Whether both sides use the same extent. FALSE adapts each extent while preserving identical numeric unit lengths on both sides.
- band_gap
Non-negative gap between the database band and estimated left content extent, in x-axis units.
- base_size
Positive theme font size in points.
- font_family
Font family used by the theme, term and gene text.
- res
Result list with an enrichment data.frame, as returned by RunEnrichment. Overrides object.
Value
A ggplot. Its data retains selected original rows plus plotting columns. Terms are ranked independently by adjusted P within each database and group. Missing adjusted P values are omitted with a warning; zero values are capped at .Machine$double.xmin for plotting. Both groups must retain significant terms.
Details
Negative x positions denote the left group, not negative enrichment. Opposite rows need not represent the same pathway. Asymmetric axis extents include a character-count estimate of label width; large fonts or narrow exports may need additional space. No automatic font-size fitting is performed. Missing or blank descriptions use the term ID; if that is also missing or blank, the display label is `(unnamed term)`. Original rows are preserved. Term text switches between black and white for contrast with each bar's displayed fill. A thin contrasting outline keeps overflow text readable.