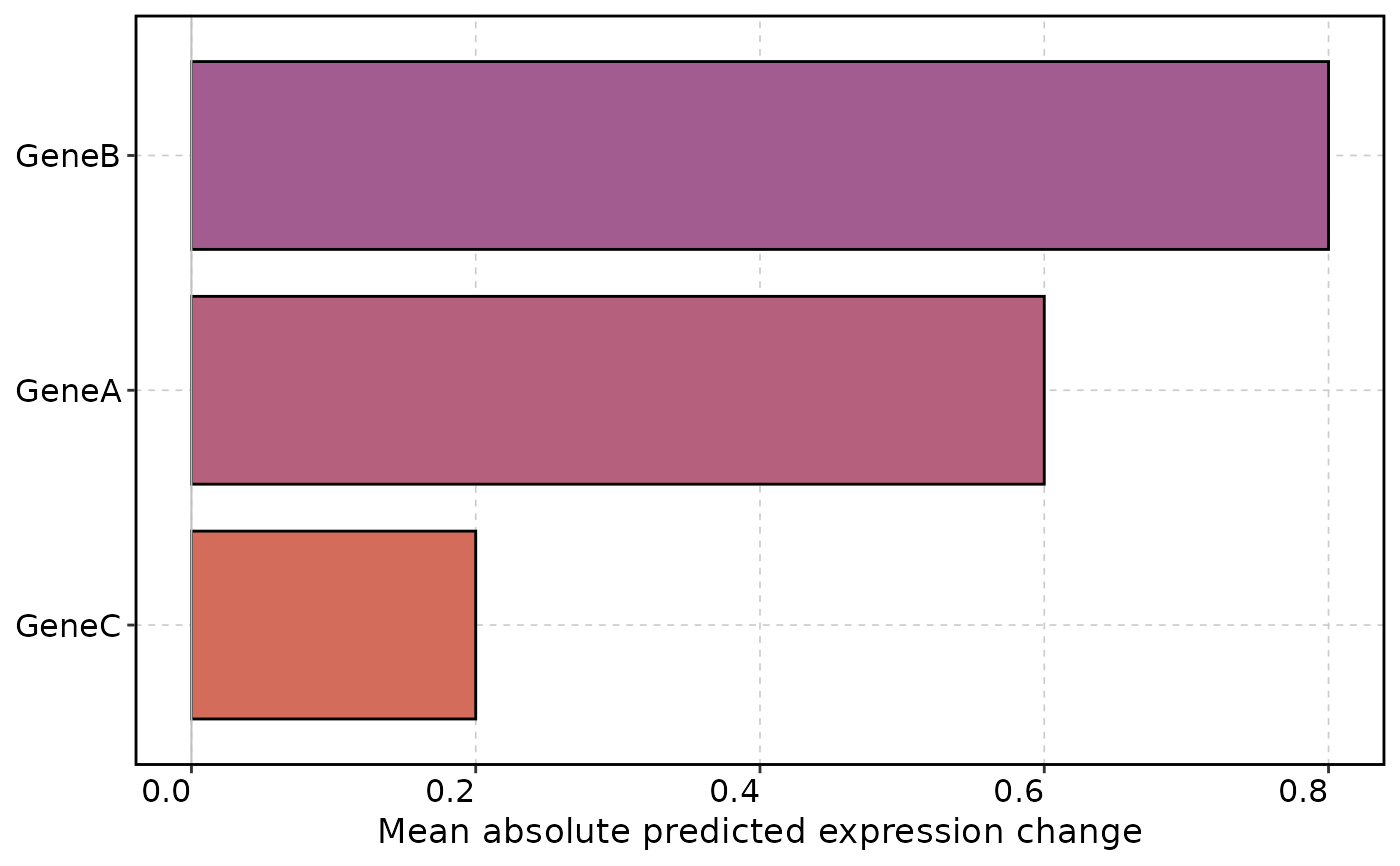
Display official CellOracle displacements, grid flow, predicted expression changes or a cluster-specific regulatory network without rerunning Python.
Arguments
- object
A Seurat object returned by
RunCellOracle().- tool_name
Result name in
object@tools.- plot_type
One of
"quiver","flow","effect", or"network".- randomized
Show the official randomized displacement reference in quiver/flow plots. This is not an independent biological replicate.
- arrow_scale
Positive multiplier of stored displacements in embedding units. This is a display parameter, not matplotlib's inverse
scaleargument.- pt.size
Background cell point size.
- pt.alpha
Background cell opacity.
- top_n
Number of genes in effect plots or edges in network plots.
- cluster
Cluster name required for network plots when multiple networks are stored. Networks are never silently pooled across clusters.
- theme_use
Theme function or function name.
- theme_args
Named list of arguments passed to the theme function.
- palette, palcolor
Palette and optional colors passed to
thisplot::StatPlot()for effect bars.
Value
A ggplot object. Flow plots apply the stored upstream mass_filter
(TRUE means excluded), without smoothing or resampling. Effect bars display
mean absolute delta_X across cells, not fold changes or p-values. Network
arrow widths reflect absolute upstream coefficients, not activation/repression.
Details
The effect example uses constructed stored predictions to demonstrate
plotting without running a perturbation model. Effect bars use
thisplot::StatPlot() with the stored values.
Examples
demo <- Seurat::CreateSeuratObject(
  counts = matrix(
    c(3, 1, 0, 2, 1, 4), nrow = 3,
    dimnames = list(c("GeneA", "GeneB", "GeneC"), c("Cell1", "Cell2"))
  )
)
#> Warning: Data is of class matrix. Coercing to dgCMatrix.
demo@tools$CellOracle <- list(gene_effect = data.frame(
  gene = c("GeneA", "GeneB", "GeneC"),
  mean_delta = c(-0.4, 0.8, 0.1),
  mean_abs_delta = c(0.6, 0.8, 0.2)
))
CellOraclePlot(demo, plot_type = "effect")