Use semla::RadialDistance() to calculate distances from selected spatial
regions and write the returned columns to Seurat metadata.
SCOP provides no dedicated plot for this result; retrieve its schema record
with GetSpatialResult() and inspect the recorded metadata columns.
Usage
RunSemlaRadialDistance(
  srt,
  column_name,
  selected_groups = NULL,
  column_suffix = NULL,
  image_type = "tissue_lowres",
  verbose = TRUE,
  ...
)
Arguments
- srt
A
Seuratobject with spatial image data.- column_name
Metadata column containing region labels.
- selected_groups
Region labels used by semla. If
NULL, semla uses all labels incolumn_name.- column_suffix
Optional suffix for metadata columns returned by semla.
- image_type
Image scale used by
semla::UpdateSeuratForSemla()when the object does not already contain a Staffli object.- verbose
Whether to print the message. Default is
TRUE.- ...
Additional arguments passed to semla.
Examples
data(visium_human_pancreas_sub)
spatial <- visium_human_pancreas_sub
spatial$region <- ifelse(
spatial$y > stats::median(spatial$y),
"upper",
"lower"
)
upper_center <- c(
stats::median(spatial$x[spatial$region == "upper"]),
stats::median(spatial$y[spatial$region == "upper"])
)
spatial$upper_distance <- sqrt(
(spatial$x - upper_center[1])^2 + (spatial$y - upper_center[2])^2
)
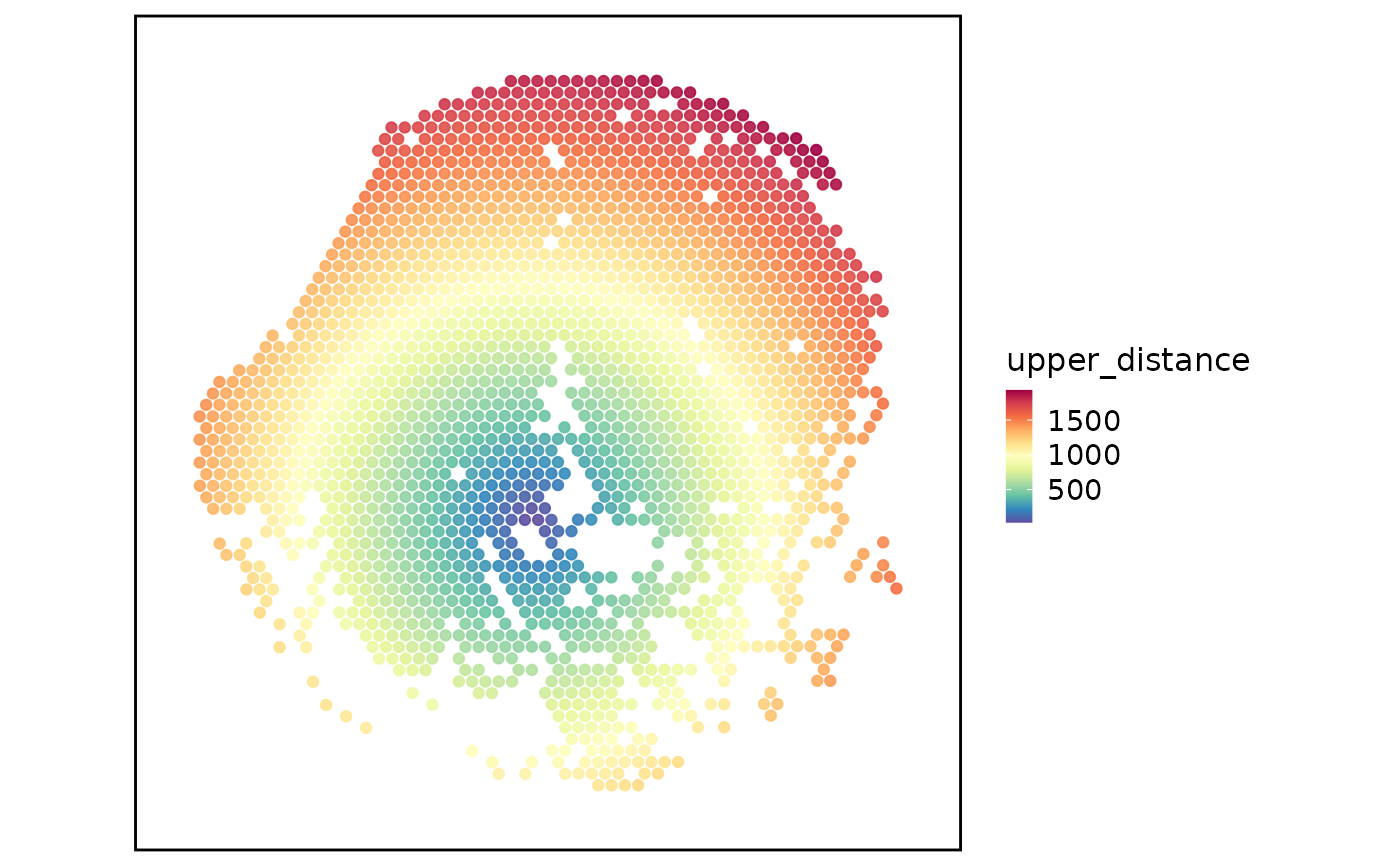
SpatialSpotPlot(
spatial,
group.by = "upper_distance",
overlay_image = FALSE,
coord.cols = c("x", "y")
)
 spatial <- RunSemlaRadialDistance(
spatial,
column_name = "region",
selected_groups = "upper",
column_suffix = "upper_distance",
verbose = FALSE
)
#> ℹ Found VisiumV2 object(s).
#>
#> ── Collecting data from @images slot
#> ! Array coordinates are not available for non-VisiumHD datasets. Please consider using semla's own functions to load the data. See '?ReadVisiumData()'
spatial <- RunSemlaRadialDistance(
spatial,
column_name = "region",
selected_groups = "upper",
column_suffix = "upper_distance",
verbose = FALSE
)
#> ℹ Found VisiumV2 object(s).
#>
#> ── Collecting data from @images slot
#> ! Array coordinates are not available for non-VisiumHD datasets. Please consider using semla's own functions to load the data. See '?ReadVisiumData()'