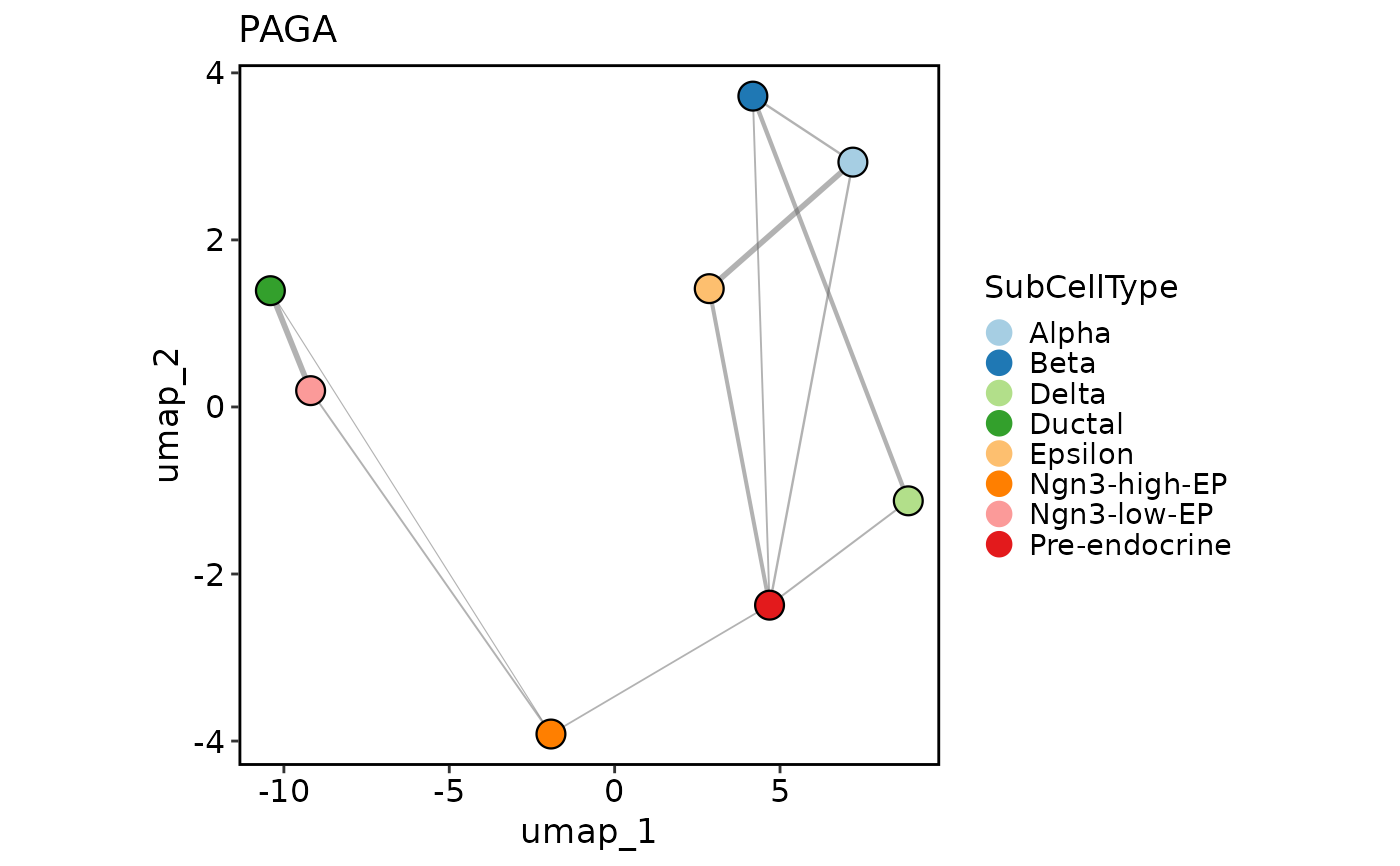
Graph-based inference of cellular trajectories.
Usage
RunPAGA(
  object = NULL,
  adata = NULL,
  assay_x = "RNA",
  layer_x = "counts",
  assay_y = c("spliced", "unspliced"),
  layer_y = "counts",
  group.by = NULL,
  linear_reduction = NULL,
  nonlinear_reduction = NULL,
  basis = NULL,
  n_pcs = 30,
  n_neighbors = 30,
  use_rna_velocity = FALSE,
  vkey = "stochastic",
  embedded_with_PAGA = FALSE,
  paga_layout = "fr",
  threshold = 0.1,
  point_size = 20,
  infer_pseudotime = FALSE,
  root_group = NULL,
  root_cell = NULL,
  n_dcs = 10,
  n_branchings = 0,
  min_group_size = 0.01,
  palette = "Chinese",
  palcolor = NULL,
  legend.position = "on data",
  cores = 1,
  show_plot = FALSE,
  save_plot = FALSE,
  plot_format = c("pdf", "png", "svg"),
  plot_dpi = 300,
  plot_prefix = "paga",
  dirpath = "./paga",
  backend = c("python", "cpp"),
  return_seurat = !is.null(srt),
  verbose = TRUE,
  srt = NULL
)
Arguments
- object
A Seurat object. If provided,
adatawill be ignored.- adata
An anndata object.
- assay_x
Assay to convert as the main data matrix in the anndata object.
- layer_x
Layer name for assay_x in the Seurat object.
- assay_y
Assays, or extra layers of
assay_x, to convert as layers in the anndata object. Each name is matched against the assays of the object first, then against the layers ofassay_x, which covers velocity matrices such assplicedandunsplicedstored as layers of a Seurat v5RNAassay.- layer_y
Layer names for the assays in
assay_y. It is ignored for names that are matched as layers ofassay_x, where the layer name itself is used.- group.by
Metadata column(s) used to color cells.
- linear_reduction
Linear reduction (
"pca","svd","ica","nmf","mds","glmpca").linear_reduction_dims_use = NULLuses estimated dimensions, else the first 50.- nonlinear_reduction
Nonlinear reduction (
"umap","umap-naive","tsne","dm","phate","pacmap","trimap","largevis","fr").- basis
The basis to use for reduction, e.g.,
"UMAP".- n_pcs
Number of principal components to use for linear reduction.
- n_neighbors
Number of neighbors to use for constructing the KNN graph.
- use_rna_velocity
Whether to use RNA velocity for PAGA analysis.
- vkey
RNA velocity data to use if
use_rna_velocityisTRUE. Default is"stochastic". If the corresponding velocity embedding is not found, falls back to the scVelo convention (e.g.velocity_umap), which is what an object converted from an AnnData (via adata_to_srt) contains.- embedded_with_PAGA
Whether to embed data using PAGA layout.
- paga_layout
The layout for plotting PAGA graph. See layout param in
scanpy.pl.pagafunction.- threshold
The threshold for plotting PAGA graph. Edges for weights below this threshold will not be drawn.
- point_size
The point size for plotting.
- infer_pseudotime
Whether to infer pseudotime. When
backend = "python", scanpy DPT stores per-cell values inmeta.data$dpt_pseudotime. Whenbackend = "cpp", group-level pseudotime is stored insrt@tools[["PAGA"]]$pseudotimeand per-cell values are also written tometa.data$dpt_pseudotime.- root_group
The group to use as the root for pseudotime inference.
- root_cell
The cell to use as the root for pseudotime inference.
- n_dcs
The number of diffusion components to use for pseudotime inference.
- n_branchings
Number of branchings to detect.
- min_group_size
The minimum size of a group (as a fraction of the total number of cells) to consider it as a potential branching point.
- palette, palcolor
Palette name (thisplot::show_palettes) or custom colors.
- legend.position
Position of legend in plots. Can be
"on data","right margin","bottom right", etc.- cores
The number of cores to use for
cellrank.- show_plot
Whether to show the plot.
- save_plot
Whether to save plots to files.
- plot_format
Format for saved plots:
"png"(default),"pdf", or"svg".- plot_dpi
Resolution (DPI) for saved plots.
- plot_prefix
Prefix for saved plot filenames.
- dirpath
The directory to save the plots.
- backend
Backend used to compute PAGA.
"python"keeps the original scanpy workflow and remains the default."cpp"uses the package C++ implementation for the standard connectivity graph and tree, plus an approximate R igraph layout stored inpaga$pos. All arguments stay on the selected backend; the C++ backend never switches to Python implicitly.- return_seurat
Whether to return a Seurat object instead of an anndata object.
- verbose
Whether to print the message. Default is
TRUE.- srt
Deprecated alias for
object; supply exactly one of the two. It will be removed in scop 1.0.0.
Examples
data(pancreas_sub)
pancreas_sub <- RunStandardWorkflow(pancreas_sub)
#> ℹ [2026-10-11 23:41:00] Start standard processing workflow...
#> ℹ [2026-10-11 23:41:00] Checking a list of <Seurat>...
#> ! [2026-10-11 23:41:00] Data 1/1 of the `srt_list` is "unknown"
#> ℹ [2026-10-11 23:41:00] Perform `NormalizeData()` with `normalization.method = 'LogNormalize'` on 1/1 of `srt_list`...
#> ℹ [2026-10-11 23:41:00] Perform `FindVariableFeatures()` on 1/1 of `srt_list`...
#> ℹ [2026-10-11 23:41:00] Use the separate HVF from `srt_list`
#> ℹ [2026-10-11 23:41:00] Number of available HVF: 2000
#> ℹ [2026-10-11 23:41:00] Finished check
#> ℹ [2026-10-11 23:41:00] Perform `ScaleData()`
#> ℹ [2026-10-11 23:41:00] Perform pca linear dimension reduction
#> ℹ [2026-10-11 23:41:00] Use stored estimated dimensions 1:23 for Standardpca
#> ℹ [2026-10-11 23:41:01] Perform `Seurat::FindClusters()` with `cluster_algorithm = 'louvain'` and `cluster_resolution = 0.6`
#> ℹ [2026-10-11 23:41:01] Reorder clusters...
#> ℹ [2026-10-11 23:41:01] Skip `log1p()` because `layer = data` is not "counts"
#> ℹ [2026-10-11 23:41:01] Perform umap nonlinear dimension reduction
#> ✔ [2026-10-11 23:41:08] Standard processing workflow completed
pancreas_sub <- RunPAGA(
pancreas_sub,
assay_x = "RNA",
group.by = "SubCellType",
linear_reduction = "PCA",
nonlinear_reduction = "UMAP",
backend = "cpp"
)
#> ℹ [2026-10-11 23:41:08] Running PAGA with BiocNeighbors using 29 neighbors
#> ✔ [2026-10-11 23:41:09] PAGA cpp backend completed
PAGAPlot(pancreas_sub, reduction = "UMAP")
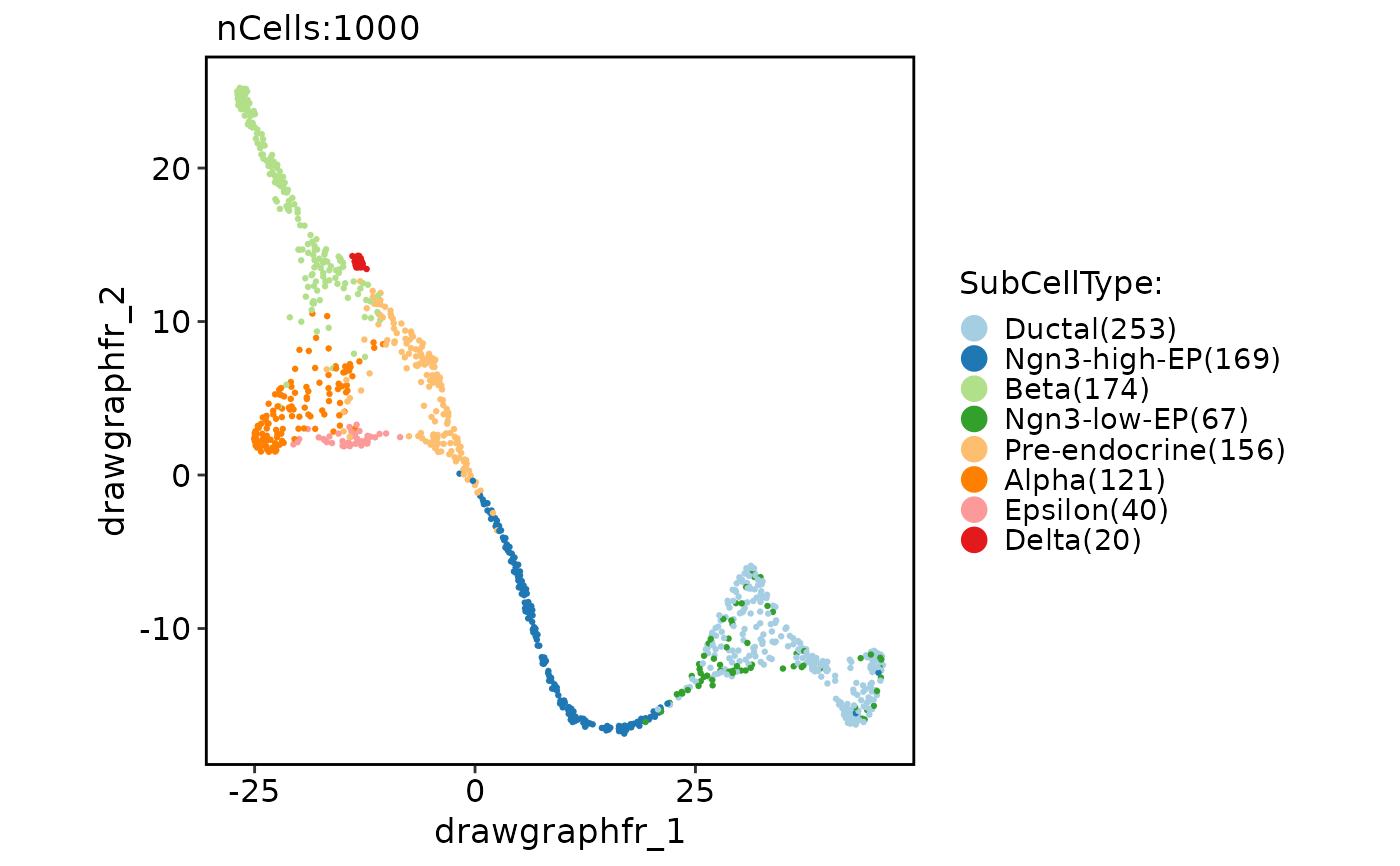 CellDimPlot(
pancreas_sub,
group.by = "SubCellType",
reduction = "UMAP",
paga = pancreas_sub@tools[["PAGA"]]
)
CellDimPlot(
pancreas_sub,
group.by = "SubCellType",
reduction = "UMAP",
paga = pancreas_sub@tools[["PAGA"]]
)