This function generates a PAGA plot based on the given Seurat object and PAGA result.
Usage
PAGAPlot(
  srt,
  paga = srt@misc$paga,
  type = "connectivities",
  reduction = NULL,
  dims = c(1, 2),
  cells = NULL,
  show_transition = FALSE,
  node_palette = "Chinese",
  node_palcolor = NULL,
  node_size = 4,
  node_alpha = 1,
  node_highlight = NULL,
  node_highlight_color = "red",
  label = FALSE,
  label.size = 3.5,
  label.fg = "white",
  label.bg = "black",
  label.bg.r = 0.1,
  label_insitu = FALSE,
  label_repel = FALSE,
  label_repulsion = 20,
  label_point_size = 1,
  label_point_color = "black",
  label_segment_color = "black",
  edge_threshold = 0.01,
  edge_line = c("straight", "curved"),
  edge_line_curvature = 0.3,
  edge_line_angle = 90,
  edge_size = c(0.2, 1),
  edge_color = "grey40",
  edge_alpha = 0.5,
  edge_shorten = 0,
  edge_offset = 0,
  edge_highlight = NULL,
  edge_highlight_color = "red",
  transition_threshold = 0.01,
  transition_line = c("straight", "curved"),
  transition_line_curvature = 0.3,
  transition_line_angle = 90,
  transition_size = c(0.2, 1),
  transition_color = "black",
  transition_alpha = 1,
  transition_arrow_type = "closed",
  transition_arrow_angle = 20,
  transition_arrow_length = grid::unit(0.02, "npc"),
  transition_shorten = 0.05,
  transition_offset = 0,
  transition_highlight = NULL,
  transition_highlight_color = "red",
  aspect.ratio = 1,
  title = "PAGA",
  subtitle = NULL,
  xlab = NULL,
  ylab = NULL,
  legend.position = "right",
  legend.direction = "vertical",
  theme_use = "theme_scop",
  theme_args = list(),
  return_layer = FALSE,
  verbose = TRUE
)
Arguments
- srt
A Seurat object.
- paga
The PAGA result from the Seurat object. Default is
srt@misc$paga.- type
The type of plot to generate. Possible values are
"connectivities"(default) and"connectivities_tree".- reduction
Which dimensionality reduction to use. If not specified, will use the reduction returned by DefaultReduction.
- dims
Dimensions to plot, must be a two-length numeric vector specifying x- and y-dimensions
- cells
A character vector of cell names to use.
- show_transition
Whether to display transitions between different cell states. Default is
FALSE.- node_palette
A character vector specifying the name of the color palette for node groups.
- node_palcolor
A character vector specifying the names of the colors for each node group.
- node_size
A numeric value or column name of
nodespecifying the size of the nodes.- node_alpha
A numeric value or column name of
nodespecifying the transparency of the nodes.- node_highlight
A character vector specifying the names of nodes to highlight.
- node_highlight_color
A character vector specifying the color for highlighting nodes.
- label
Whether to label the cell groups.
- label.size
Size of labels.
- label.fg
Foreground color of label.
- label.bg
Background color of label.
- label.bg.r
Background ratio of label.
- label_insitu
Whether to place the raw labels (group names) in the center of the cells with the corresponding group. Default is
FALSE, which using numbers instead of raw labels.- label_repel
Logical value indicating whether the label is repel away from the center points.
- label_repulsion
Force of repulsion between overlapping text labels. Default is
20.- label_point_size
Size of the center points.
- label_point_color
Color of the center points.
- label_segment_color
Color of the line segment for labels.
- edge_threshold
The threshold for removing edges.
- edge_line
A character vector specifying the type of line for edges (straight, curved).
- edge_line_curvature
The curvature of curved edges.
- edge_line_angle
The angle of curved edges.
- edge_size
Size of edges.
- edge_color
Color of edges.
- edge_alpha
Transparency of edges.
- edge_shorten
The length of the edge shorten.
- edge_offset
The length of the edge offset.
- edge_highlight
A character vector specifying the names of edges to highlight.
- edge_highlight_color
A character vector specifying the color for highlighting edges.
- transition_threshold
The threshold for removing transitions.
- transition_line
A character vector specifying the type of line for transitions (straight, curved).
- transition_line_curvature
The curvature of curved transitions.
- transition_line_angle
The angle of curved transitions.
- transition_size
A numeric vector specifying the range of transition sizes.
- transition_color
A character vector specifying the color of the transitions.
- transition_alpha
The transparency of the transitions.
- transition_arrow_type
A character vector specifying the type of arrow for transitions (closed, open).
- transition_arrow_angle
The angle of the transition arrow.
- transition_arrow_length
The length of the transition arrow.
- transition_shorten
The length of the transition shorten.
- transition_offset
The length of the transition offset.
- transition_highlight
A character vector specifying the names of transitions to highlight.
- transition_highlight_color
A character vector specifying the color for highlighting transitions.
- aspect.ratio
Aspect ratio of the panel. Default is
1.- title
The text for the title. Default is
"PAGA".- subtitle
The text for the subtitle for the plot which will be displayed below the title. Default is
NULL.- xlab
The x-axis label of the plot. Default is
NULL.- ylab
The y-axis label of the plot. Default is
NULL.- legend.position
The position of legends, one of
"none","left","right","bottom","top". Default is"right".- legend.direction
The direction of the legend in the plot. Can be one of
"vertical"or"horizontal".- theme_use
Theme used. Can be a character string or a theme function. Default is
"theme_scop".- theme_args
Other arguments passed to the
theme_use. Default islist().- return_layer
Whether to return the plot layers as a list. Defaults is
FALSE.- verbose
Whether to print the message. Default is
TRUE.
Examples
data(pancreas_sub)
pancreas_sub <- standard_scop(pancreas_sub)
#> ℹ [2026-07-02 09:17:52] Start standard processing workflow...
#> ℹ [2026-07-02 09:17:53] Checking a list of <Seurat>...
#> ! [2026-07-02 09:17:53] Data 1/1 of the `srt_list` is "unknown"
#> ℹ [2026-07-02 09:17:53] Perform `NormalizeData()` with `normalization.method = 'LogNormalize'` on 1/1 of `srt_list`...
#> ℹ [2026-07-02 09:17:53] Perform `FindVariableFeatures()` on 1/1 of `srt_list`...
#> ℹ [2026-07-02 09:17:53] Use the separate HVF from `srt_list`
#> ℹ [2026-07-02 09:17:53] Number of available HVF: 2000
#> ℹ [2026-07-02 09:17:53] Finished check
#> ℹ [2026-07-02 09:17:53] Perform `ScaleData()`
#> ℹ [2026-07-02 09:17:53] Perform pca linear dimension reduction
#> ℹ [2026-07-02 09:17:54] Use stored estimated dimensions 1:23 for Standardpca
#> ℹ [2026-07-02 09:17:54] Perform `Seurat::FindClusters()` with `cluster_algorithm = 'louvain'` and `cluster_resolution = 0.6`
#> ℹ [2026-07-02 09:17:54] Reorder clusters...
#> ℹ [2026-07-02 09:17:55] Skip `log1p()` because `layer = data` is not "counts"
#> ℹ [2026-07-02 09:17:55] Perform umap nonlinear dimension reduction
#> ✔ [2026-07-02 09:18:01] Standard processing workflow completed
pancreas_sub <- RunPAGA(
pancreas_sub,
group.by = "SubCellType",
linear_reduction = "PCA",
nonlinear_reduction = "UMAP",
backend = "cpp",
return_seurat = TRUE
)
#> ℹ [2026-07-02 09:18:01] Running PAGA with BiocNeighbors using 29 neighbors
#> ✔ [2026-07-02 09:18:01] PAGA cpp backend completed
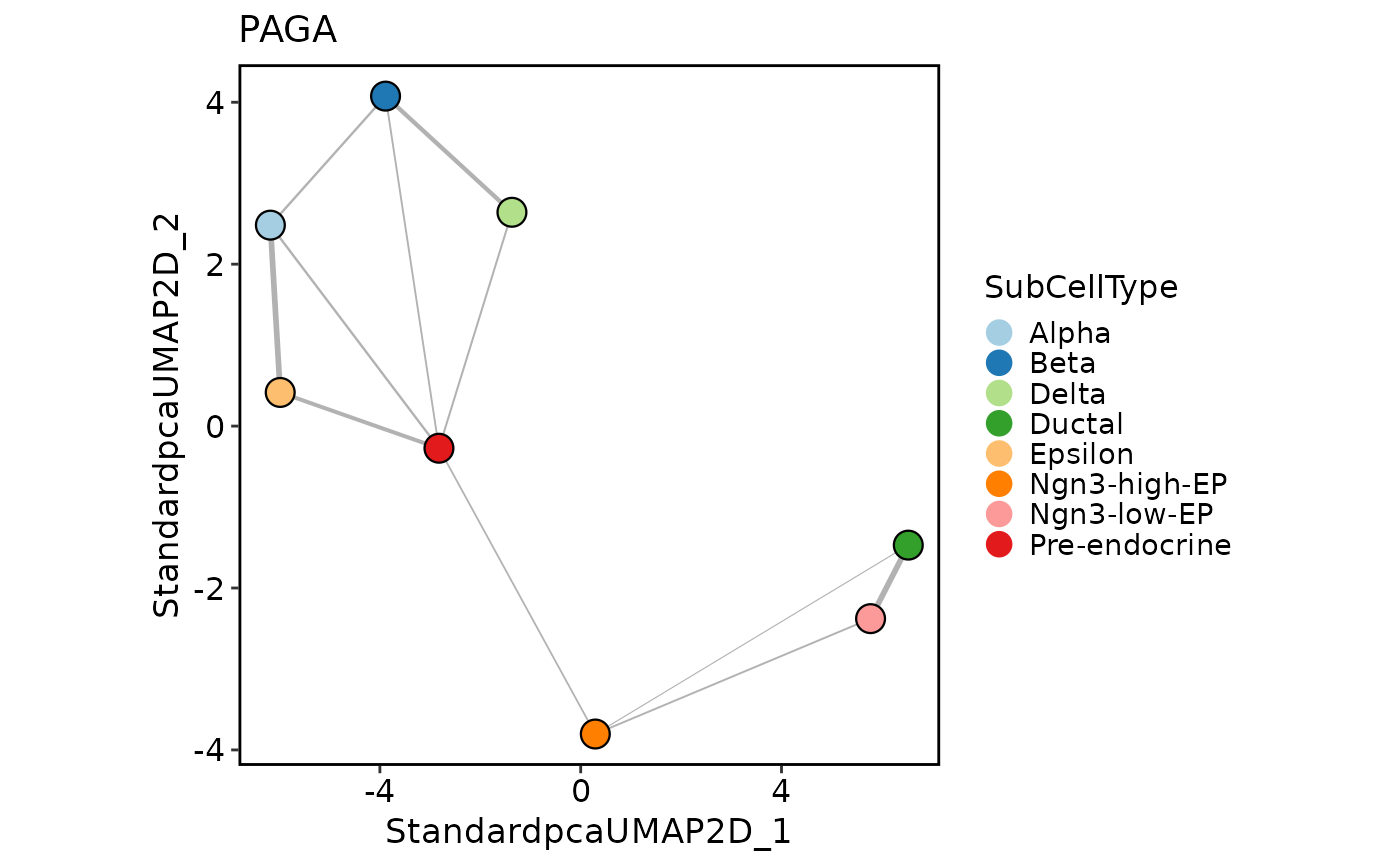
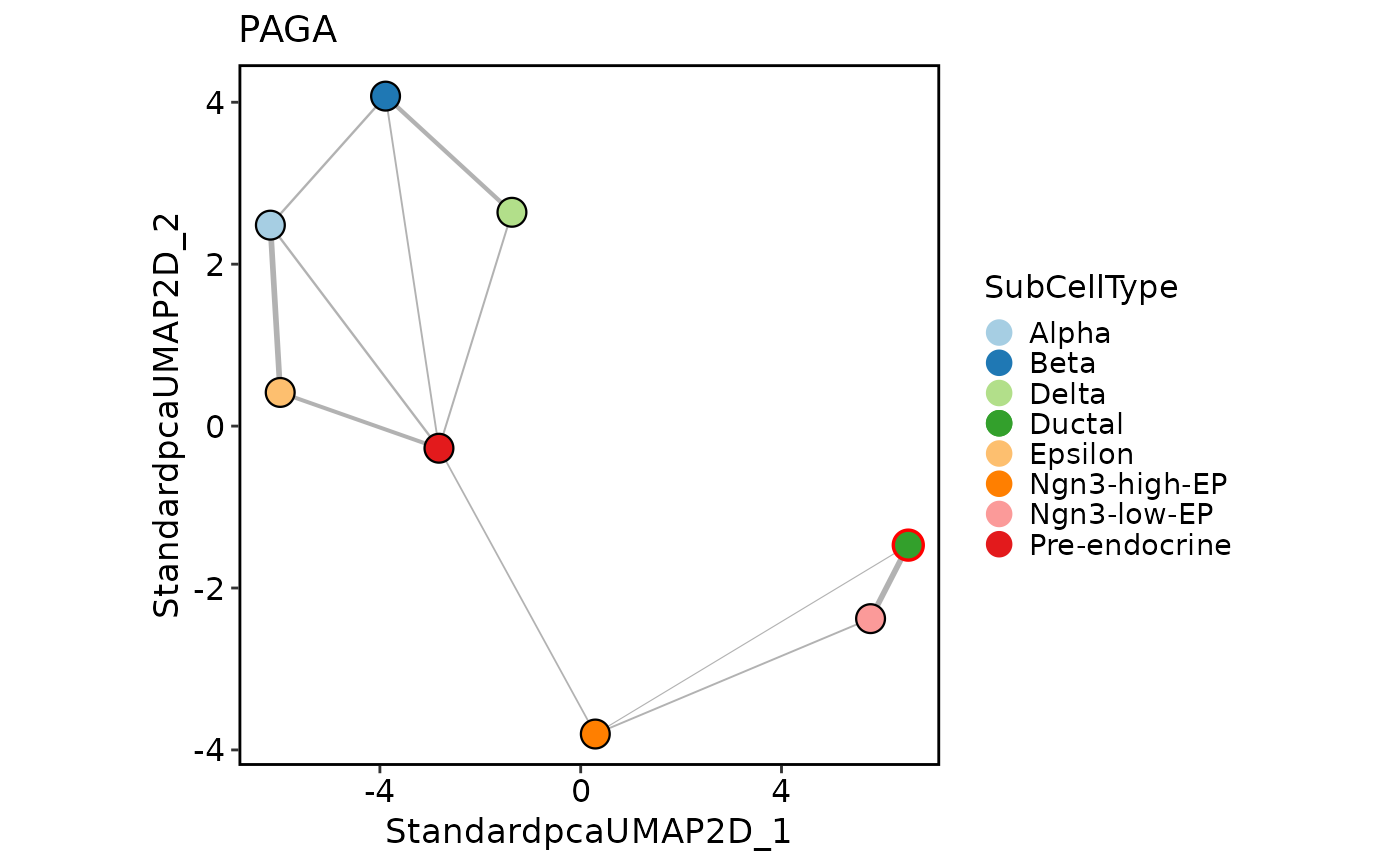
PAGAPlot(pancreas_sub)
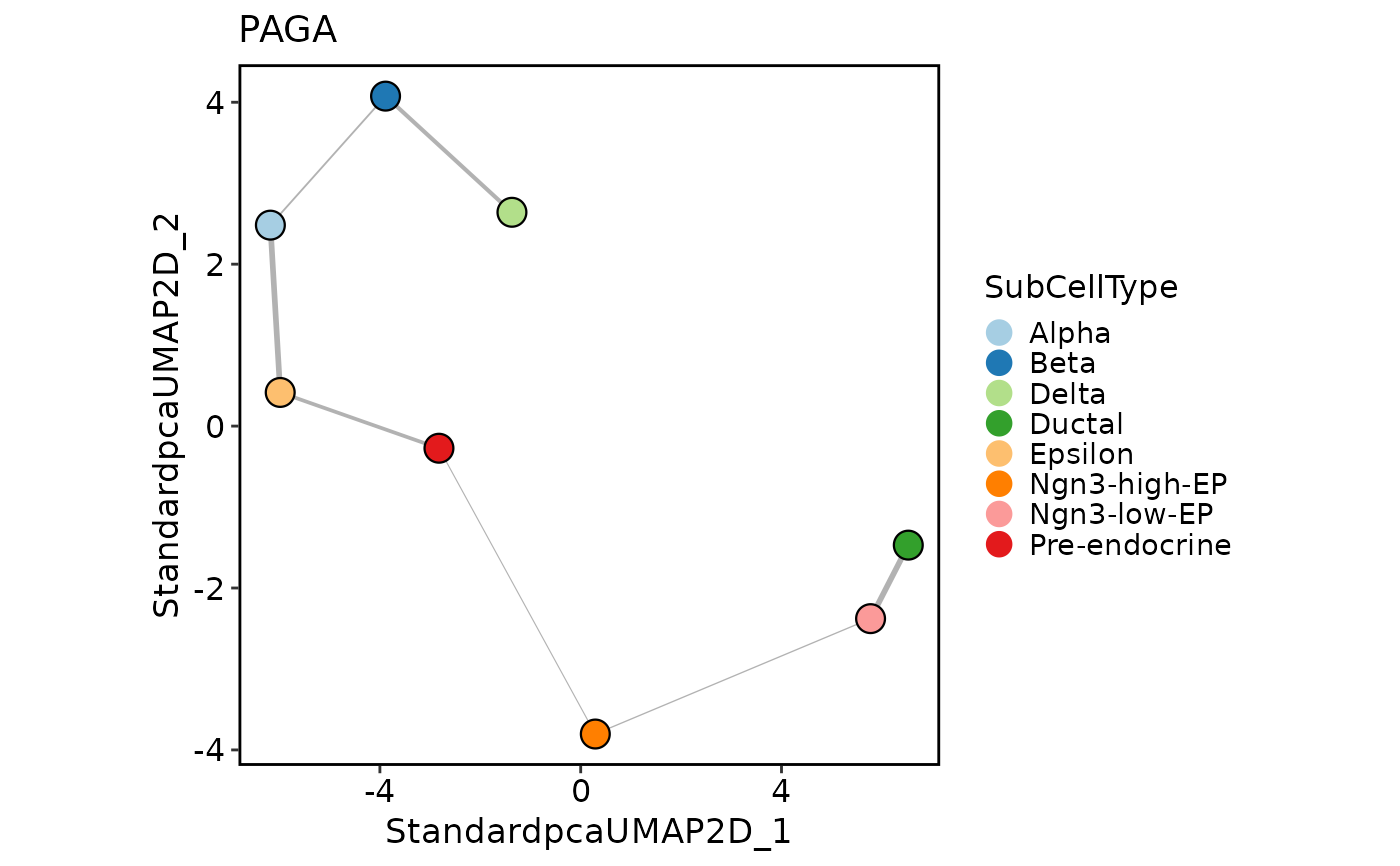
 PAGAPlot(
pancreas_sub,
type = "connectivities_tree"
)
PAGAPlot(
pancreas_sub,
type = "connectivities_tree"
)
 PAGAPlot(
pancreas_sub,
reduction = "PCA"
)
PAGAPlot(
pancreas_sub,
reduction = "PCA"
)
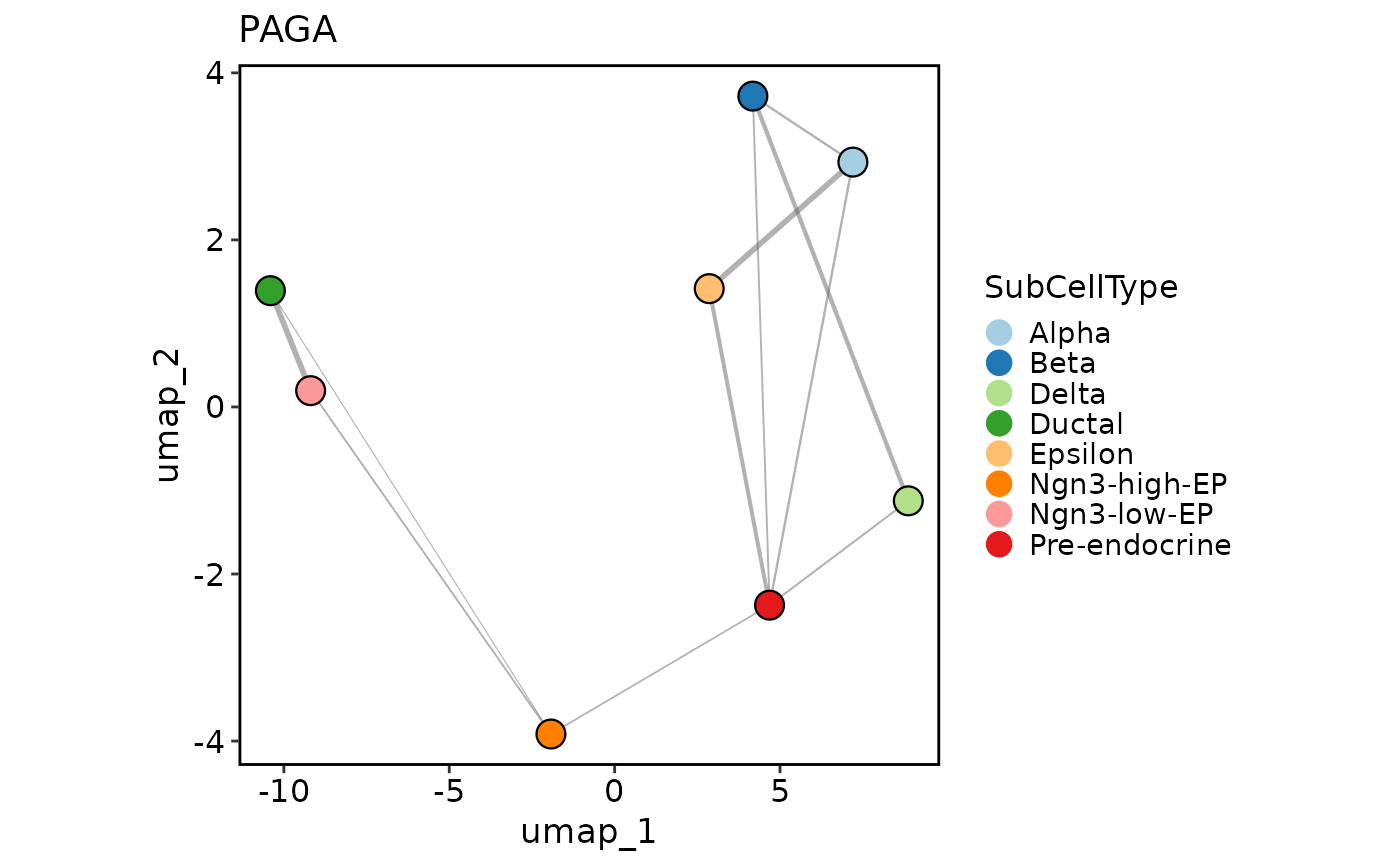
 PAGAPlot(
pancreas_sub,
reduction = "UMAP"
)
PAGAPlot(
pancreas_sub,
reduction = "UMAP"
)
 PAGAPlot(
pancreas_sub,
edge_shorten = 0.05
)
PAGAPlot(
pancreas_sub,
edge_shorten = 0.05
)
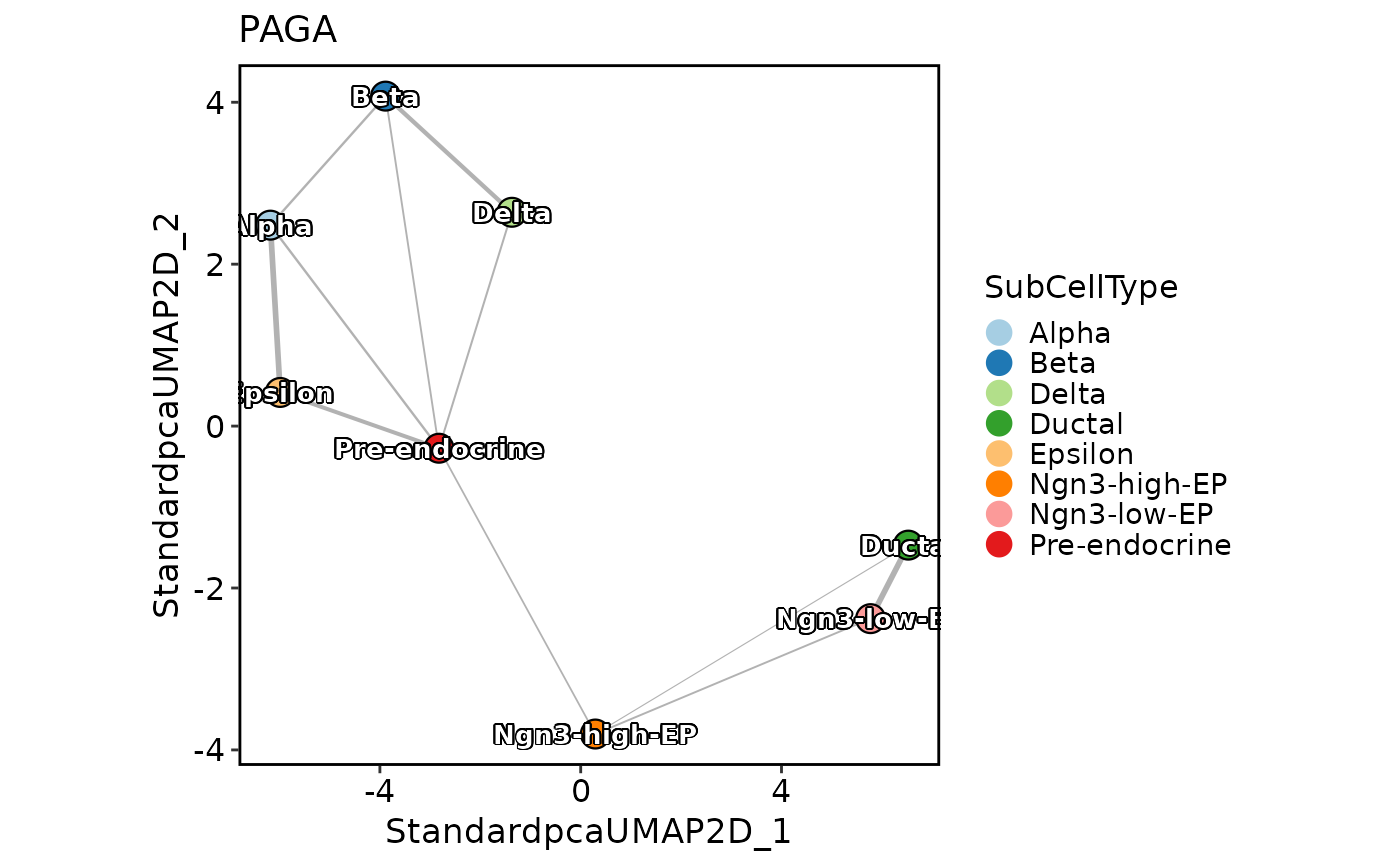
 PAGAPlot(
pancreas_sub,
label = TRUE
)
PAGAPlot(
pancreas_sub,
label = TRUE
)
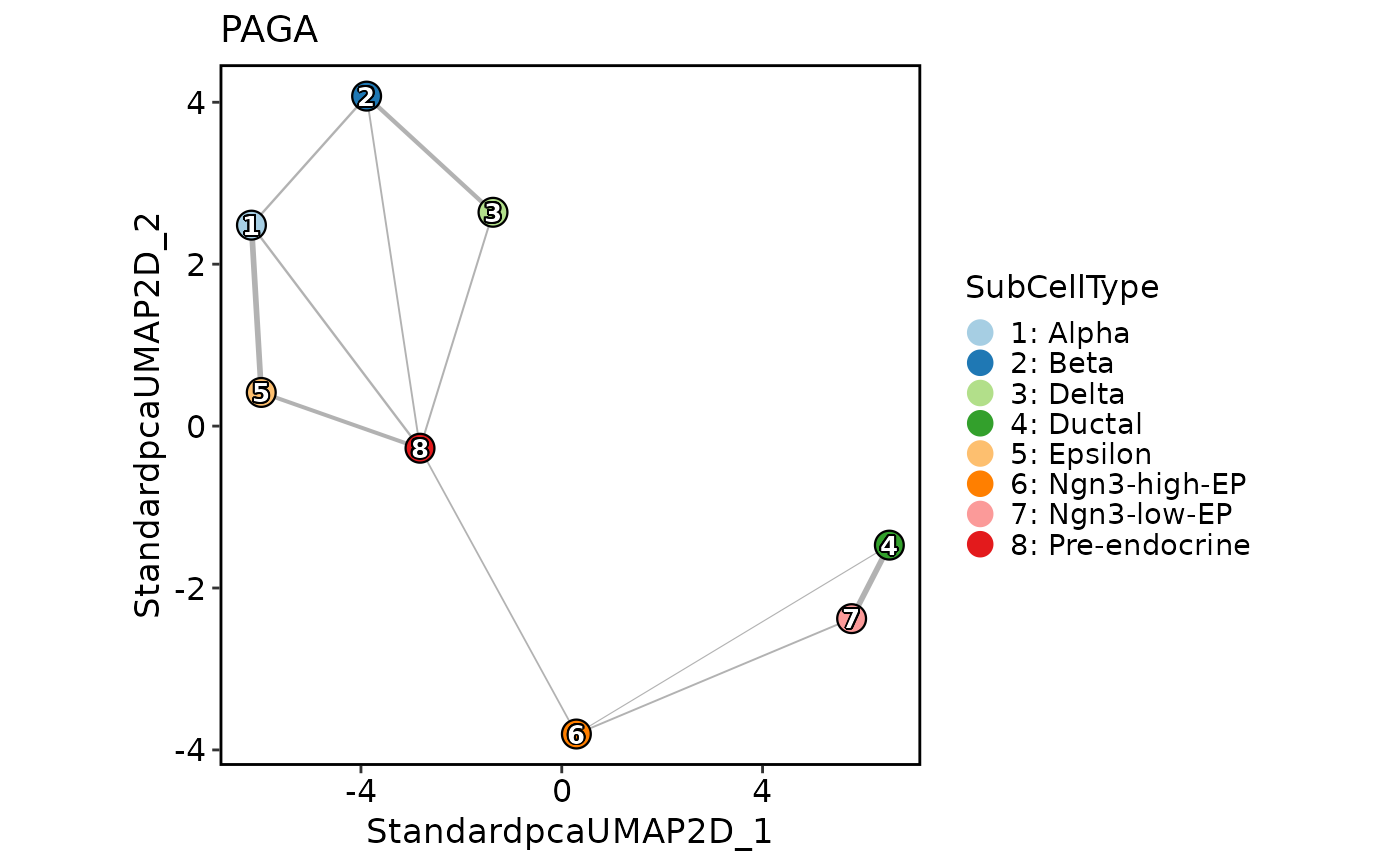 PAGAPlot(
pancreas_sub,
label = TRUE,
label_insitu = TRUE
)
PAGAPlot(
pancreas_sub,
label = TRUE,
label_insitu = TRUE
)
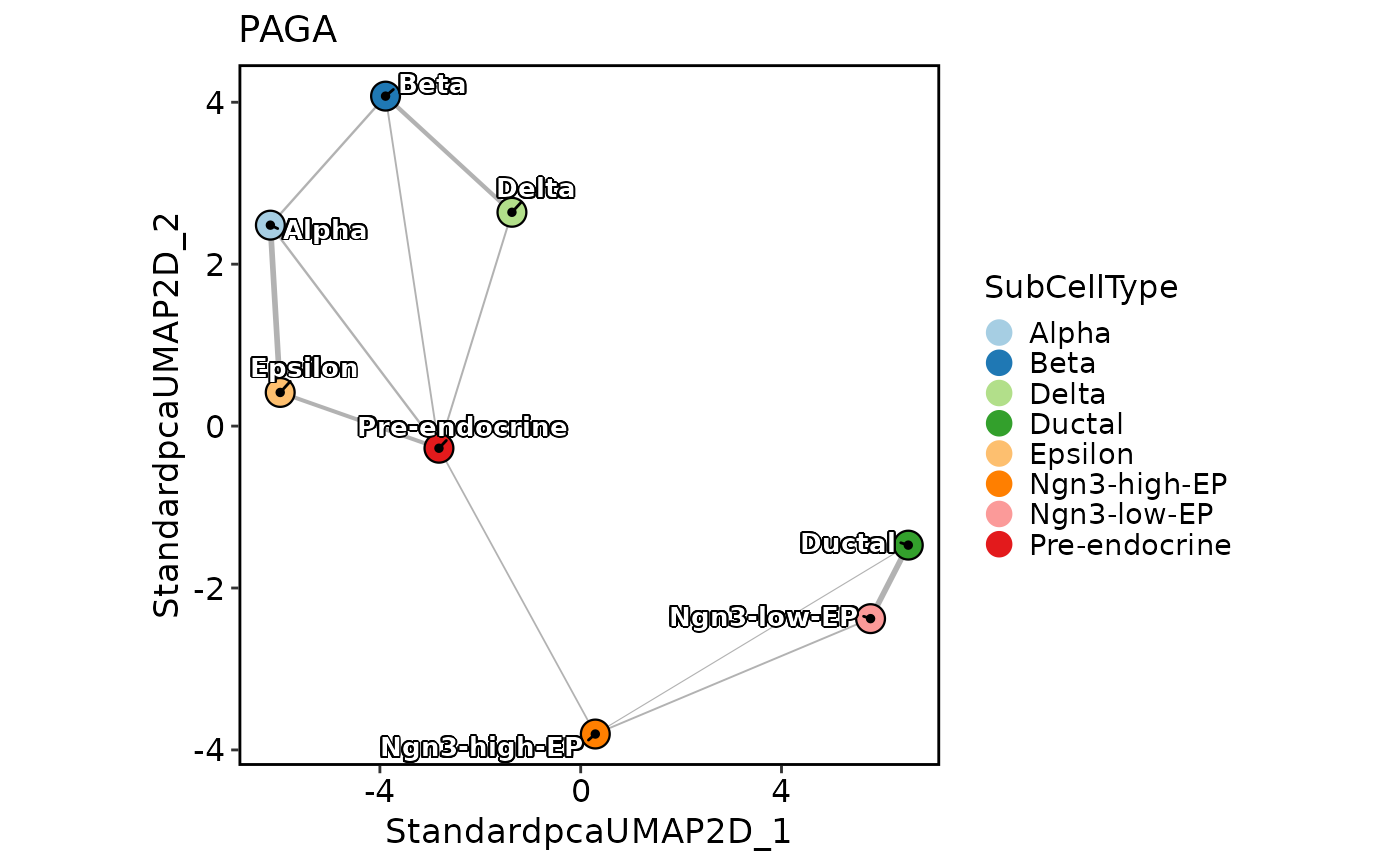
 PAGAPlot(
pancreas_sub,
label = TRUE,
label_insitu = TRUE,
label_repel = TRUE
)
PAGAPlot(
pancreas_sub,
label = TRUE,
label_insitu = TRUE,
label_repel = TRUE
)
 PAGAPlot(
pancreas_sub,
edge_line = "curved"
)
PAGAPlot(
pancreas_sub,
edge_line = "curved"
)
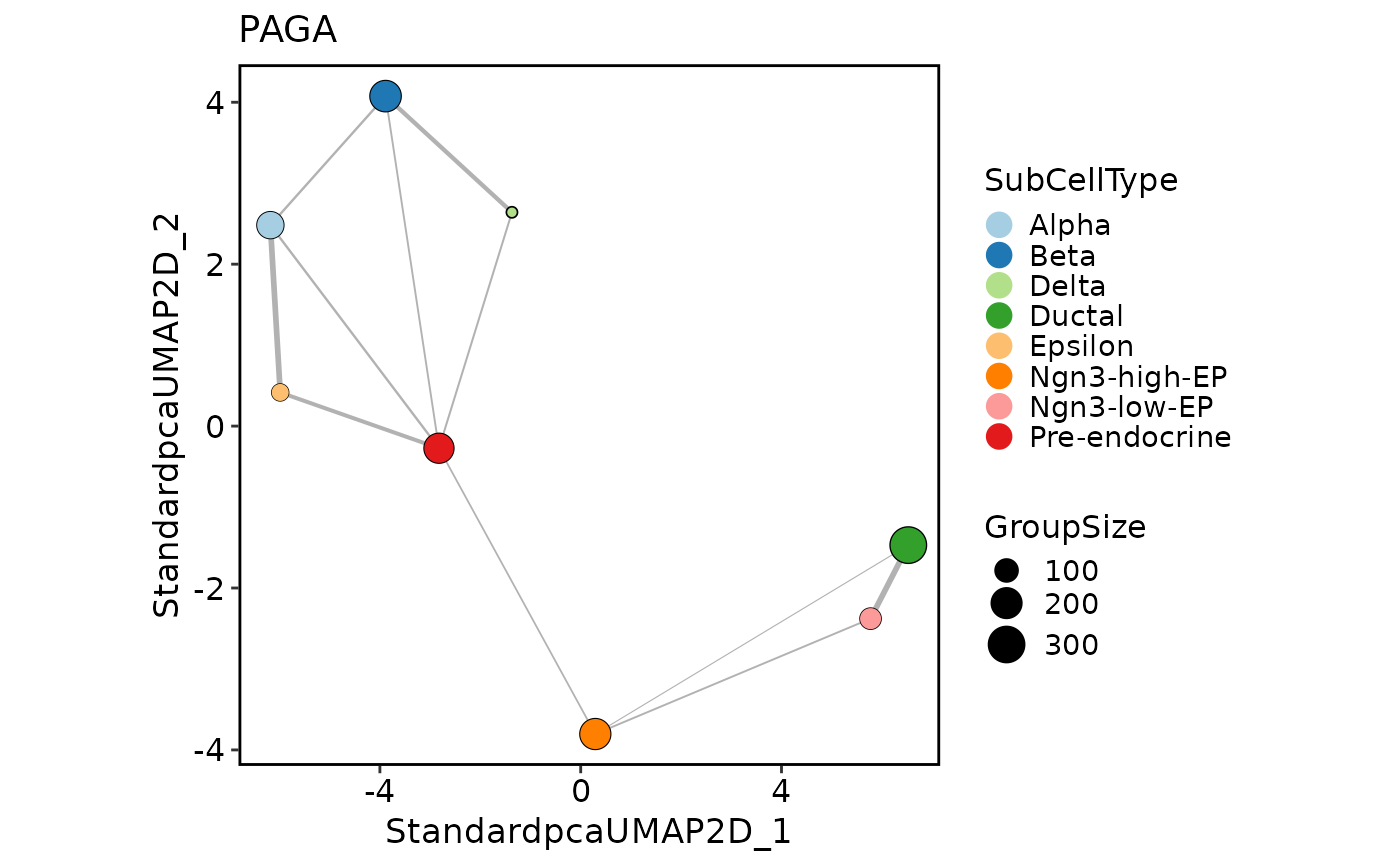
 PAGAPlot(
pancreas_sub,
node_size = "GroupSize"
)
PAGAPlot(
pancreas_sub,
node_size = "GroupSize"
)
 PAGAPlot(
pancreas_sub,
node_highlight = "Ductal"
)
PAGAPlot(
pancreas_sub,
node_highlight = "Ductal"
)
 PAGAPlot(
pancreas_sub,
edge_highlight = paste(
"Pre-endocrine",
levels(pancreas_sub$SubCellType),
sep = "-"
)
)
PAGAPlot(
pancreas_sub,
edge_highlight = paste(
"Pre-endocrine",
levels(pancreas_sub$SubCellType),
sep = "-"
)
)