This function performs a standard single-cell or spot-level spatial analysis workflow.
Usage
standard_scop(
  srt,
  prefix = "Standard",
  workflow = c("single_cell", "spatial"),
  assay = NULL,
  image = NULL,
  coord.cols = c("x", "y"),
  do_spot_qc = TRUE,
  spot_qc_params = list(),
  do_spatial_variable_features = TRUE,
  spatial_variable_features_params = list(),
  do_spatial_cluster = FALSE,
  spatial_cluster_method = "BayesSpace",
  spatial_q = NULL,
  bayesspace_params = list(),
  reference = NULL,
  reference_label = NULL,
  reference_assay = NULL,
  do_deconvolution = !is.null(reference),
  deconvolution_method = "RCTD",
  deconvolution_params = list(),
  do_normalization = NULL,
  normalization_method = "LogNormalize",
  do_HVF_finding = TRUE,
  HVF_method = "vst",
  nHVF = 2000,
  HVF = NULL,
  do_scaling = TRUE,
  vars_to_regress = NULL,
  regression_model = "linear",
  linear_reduction = "pca",
  linear_reduction_dims = 50,
  linear_reduction_dims_use = NULL,
  linear_reduction_params = list(),
  force_linear_reduction = FALSE,
  nonlinear_reduction = "umap",
  nonlinear_reduction_dims = 2,
  nonlinear_reduction_params = list(),
  force_nonlinear_reduction = TRUE,
  neighbor_metric = "euclidean",
  neighbor_k = 20L,
  cluster_algorithm = "louvain",
  cluster_resolution = 0.6,
  cores = 1L,
  verbose = TRUE,
  seed = 11,
  ...
)
Arguments
- srt
A Seurat object.
- prefix
A prefix to add to the names of intermediate objects created by the function. Default is
"Standard".- workflow
Workflow to run.
"single_cell"keeps the original standard workflow."spatial"is a basic, single-image Visium-style spot workflow that wraps the original workflow with spot QC, spatial variable features, optional spatial clustering, and optional deconvolution. It is not a multi-slice integration orchestrator.- assay
Which assay to use. If
NULL, the default assay of the Seurat object will be used. When the object also containsChromatinAssay, the default assay and additionalChromatinAssaywill be preprocessed sequentially.- image
Name of the Seurat spatial image used by the spatial workflow. Required when multiple images are present; a single image is selected automatically when
NULL.- coord.cols
Metadata coordinate columns used by the spatial workflow when no image is available.
- do_spot_qc
Whether to run
RunSpotQC()in the spatial workflow.- spot_qc_params
Named list of additional arguments passed to
RunSpotQC().- do_spatial_variable_features
Whether to run
RunSpatialVariableFeatures()in the spatial workflow.- spatial_variable_features_params
Named list of additional arguments passed to
RunSpatialVariableFeatures(). The spatial workflow defaultsset_variable_featurestoFALSEso expression-based highly variable features are preserved; pass it explicitly to override this workflow default.- do_spatial_cluster
Whether to run spatial-aware clustering in the spatial workflow.
- spatial_cluster_method
Spatial clustering method. Only
"BayesSpace"is supported in this workflow.- spatial_q
Number of spatial clusters for
RunBayesSpace(). IfNULL, the number of ordinary spot clusters is used.- bayesspace_params
Named list of additional arguments passed to
RunBayesSpace().- reference
Optional single-cell reference used for spatial deconvolution.
- reference_label
Metadata column in
referencecontaining cell type labels.- reference_assay
Assay used in
referencefor deconvolution.- do_deconvolution
Whether to run deconvolution in the spatial workflow. If
NULL, deconvolution is run whenreferenceor cell2locationreference_signaturesare provided.- deconvolution_method
Deconvolution method. One of
"RCTD","SPOTlight", or"Cell2location".- deconvolution_params
Named list of additional arguments passed to
RunRCTD(),RunSPOTlight(), orRunCell2location().- do_normalization
Whether to perform normalization. If
NULL, normalization will be performed if the specified assay does not have scaled data.- normalization_method
The method to use for normalization. Options are
"LogNormalize","SCT","TFIDF", or"scran". When"SCT"is used on an RNA assay, downstream reductions and clustering are run on the generated"SCT"assay. Default is"LogNormalize".- do_HVF_finding
Whether to perform high variable feature finding. If
TRUE, the function will force to find the highly variable features (HVF) using the specified HVF method.- HVF_method
The method to use for finding highly variable features. Options are
"vst","mvp","disp", or"scran". Default is"vst".- nHVF
The number of highly variable features to select. If NULL, all highly variable features will be used. Default is
2000.- HVF
A vector of feature names to use as highly variable features. If NULL, the function will use the highly variable features identified by the HVF method.
- do_scaling
Whether to perform scaling. If
TRUE, the function will force scaling with the package ScaleData path.- vars_to_regress
A vector of feature names to use as regressors in the scaling step. If NULL, no regressors will be used.
- regression_model
The regression model to use for scaling. Options are
"linear","poisson", or"negativebinomial". Default is"linear".- linear_reduction
The linear dimensionality reduction method to use. Options are
"pca","svd","ica","nmf","mds", or"glmpca". Default is"pca".- linear_reduction_dims
The number of dimensions to keep after linear dimensionality reduction. Default is
50.- linear_reduction_dims_use
The dimensions to use for downstream analysis. If
NULL, estimated dimensions stored in the linear reduction will be used when available; otherwise, the first up to50dimensions will be used as a fallback.- linear_reduction_params
A list of parameters to pass to the linear dimensionality reduction method.
- force_linear_reduction
Whether to force linear dimensionality reduction even if the specified reduction is already present in the Seurat object.
- nonlinear_reduction
The nonlinear dimensionality reduction method to use. Options are
"umap","umap-naive","tsne","dm","phate","pacmap","trimap","largevis", or"fr". Default is"umap".- nonlinear_reduction_dims
The number of dimensions to keep after nonlinear dimensionality reduction. If a vector is provided, different numbers of dimensions can be specified for each method. Default is
2.- nonlinear_reduction_params
A list of parameters to pass to the nonlinear dimensionality reduction method.
- force_nonlinear_reduction
Whether to force nonlinear dimensionality reduction even if the specified reduction is already present in the Seurat object. Default is
TRUE.- neighbor_metric
The distance metric to use for finding neighbors. Options are
"euclidean","cosine","manhattan", or"hamming". Default is"euclidean".- neighbor_k
The number of nearest neighbors to use for finding neighbors. Default is
20.- cluster_algorithm
The clustering algorithm to use. Options are
"louvain","slm", or"leiden". Default is"louvain".- cluster_resolution
The resolution parameter to use for clustering. Larger values result in fewer clusters. Default is
0.6.- cores
Number of CPU cores used by supported preprocessing steps. Default is
1.- verbose
Whether to print the message. Default is
TRUE.- seed
Random seed for reproducibility. Default is
11.- ...
Additional parameters to pass to the dimensionality reduction methods.
Value
A Seurat object. Completed or partial spatial workflows store the
per-stage state in srt@tools[["standard_spatial_scop"]]. The spatial
variable-feature stage records its effective set_variable_features value
and the before/after feature counts. If a stage fails,
the signaled error carries the same table in its standard_spatial_stages
attribute with that stage marked "failed".
Examples
library(Matrix)
data(pancreas_sub)
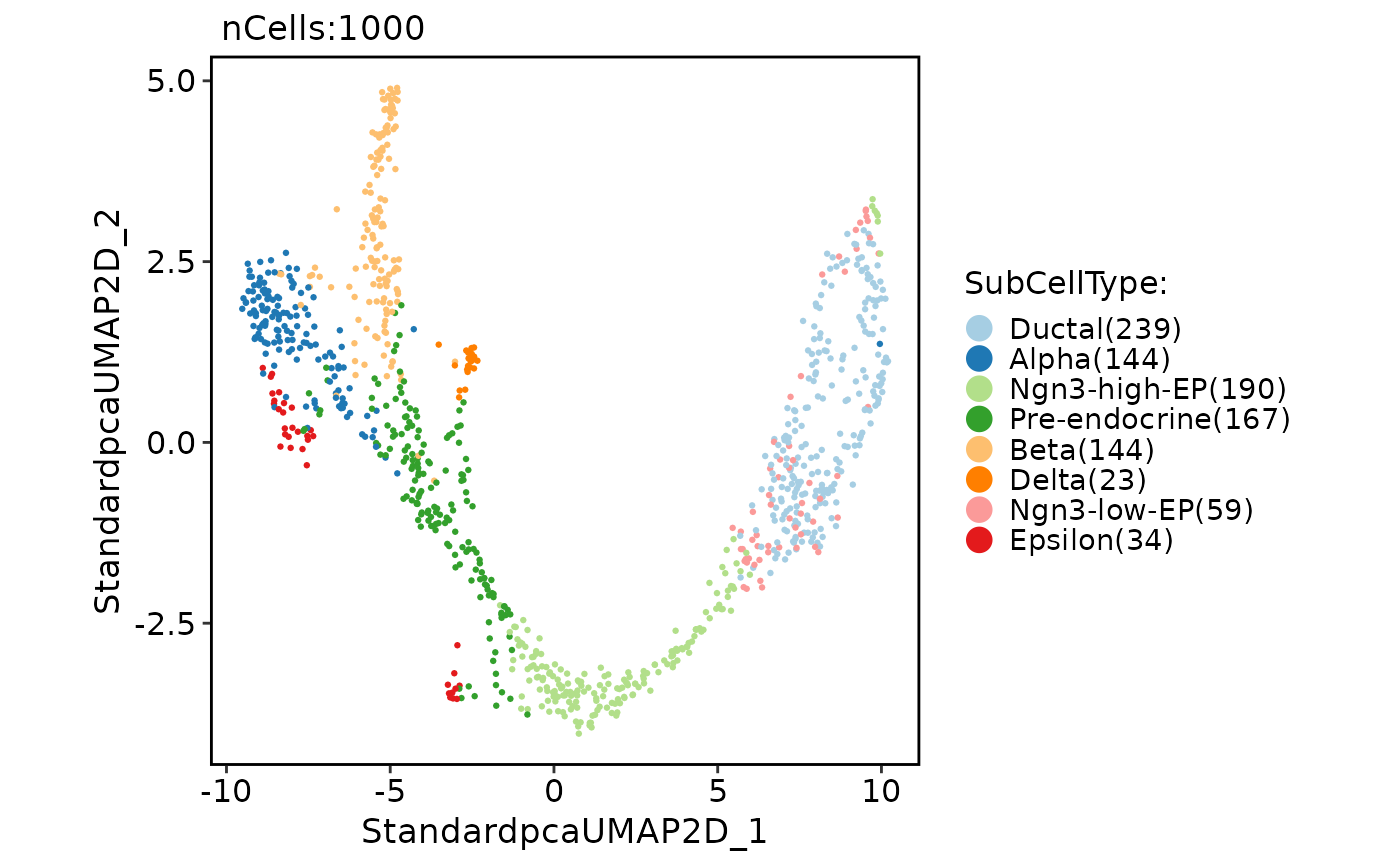
pancreas_sub <- standard_scop(pancreas_sub)
#> ℹ [2026-07-15 19:47:57] Start standard processing workflow...
#> ℹ [2026-07-15 19:47:57] Checking a list of <Seurat>...
#> ! [2026-07-15 19:47:57] Data 1/1 of the `srt_list` is "unknown"
#> ℹ [2026-07-15 19:47:57] Perform `NormalizeData()` with `normalization.method = 'LogNormalize'` on 1/1 of `srt_list`...
#> ℹ [2026-07-15 19:47:57] Perform `FindVariableFeatures()` on 1/1 of `srt_list`...
#> ℹ [2026-07-15 19:47:58] Use the separate HVF from `srt_list`
#> ℹ [2026-07-15 19:47:58] Number of available HVF: 2000
#> ℹ [2026-07-15 19:47:58] Finished check
#> ℹ [2026-07-15 19:47:58] Perform `ScaleData()`
#> ℹ [2026-07-15 19:47:58] Perform pca linear dimension reduction
#> ℹ [2026-07-15 19:47:59] Use stored estimated dimensions 1:23 for Standardpca
#> ℹ [2026-07-15 19:47:59] Perform `Seurat::FindClusters()` with `cluster_algorithm = 'louvain'` and `cluster_resolution = 0.6`
#> ℹ [2026-07-15 19:48:24] Reorder clusters...
#> ℹ [2026-07-15 19:48:25] Skip `log1p()` because `layer = data` is not "counts"
#> ℹ [2026-07-15 19:48:25] Perform umap nonlinear dimension reduction
#> ✔ [2026-07-15 19:48:30] Standard processing workflow completed
CellDimPlot(
pancreas_sub,
group.by = "SubCellType"
)
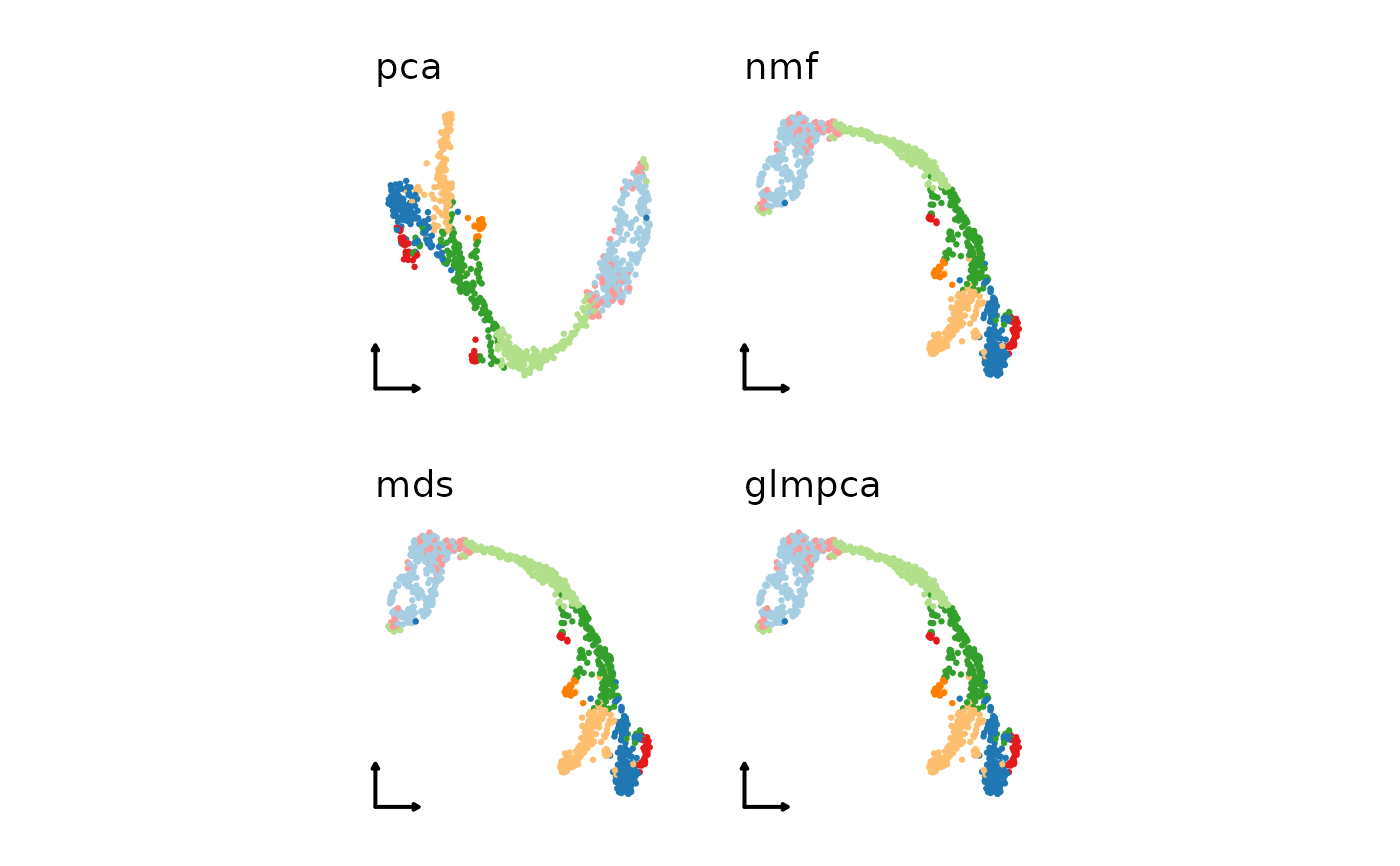
 # Use a combination of different linear
# or nonlinear dimension reduction methods
linear_reductions <- c(
"pca", "nmf", "mds"
)
pancreas_sub <- standard_scop(
pancreas_sub,
linear_reduction = linear_reductions,
nonlinear_reduction = "umap"
)
#> ℹ [2026-07-15 19:48:31] Start standard processing workflow...
#> ℹ [2026-07-15 19:48:31] Checking a list of <Seurat>...
#> ℹ [2026-07-15 19:48:31] Data 1/1 of the `srt_list` has been log-normalized
#> ℹ [2026-07-15 19:48:31] Perform `FindVariableFeatures()` on 1/1 of `srt_list`...
#> ℹ [2026-07-15 19:48:32] Use the separate HVF from `srt_list`
#> ℹ [2026-07-15 19:48:32] Number of available HVF: 2000
#> ℹ [2026-07-15 19:48:32] Finished check
#> ℹ [2026-07-15 19:48:32] Perform `ScaleData()`
#> ℹ [2026-07-15 19:48:32] Perform pca linear dimension reduction
#> ℹ [2026-07-15 19:48:33] Use stored estimated dimensions 1:23 for Standardpca
#> ℹ [2026-07-15 19:48:34] Perform `Seurat::FindClusters()` with `cluster_algorithm = 'louvain'` and `cluster_resolution = 0.6`
#> ℹ [2026-07-15 19:49:32] Reorder clusters...
#> ℹ [2026-07-15 19:49:33] Skip `log1p()` because `layer = data` is not "counts"
#> ℹ [2026-07-15 19:49:33] Perform umap nonlinear dimension reduction
#> Warning: Key ‘StandardpcaUMAP2D_’ taken, using ‘standardpcaumap2d_’ instead
#> ℹ [2026-07-15 19:49:39] Perform nmf linear dimension reduction
#> ℹ [2026-07-15 19:49:39] Running NMF...
#> ℹ StandardBE_ 1
#> ℹ Positive: Ccnd1, Spp1, Mdk, Rps2, Ldha, Pebp1, Cd24a, Dlk1, Krt8, Mgst1
#> ℹ Clu, Gapdh, Eno1, Prdx1, Cldn10, Mif, Cldn7, Npm1, Dbi, Vim
#> ℹ Sox9, Rpl12, Aldh1b1, Rplp1, Wfdc2, Krt18, Tkt, Aldoa, Hspe1, Ptma
#> ℹ Negative: Tmem108, Poc1a, Epn3, Wipi1, Tmcc3, Nhsl1, Fgf12, Plekho1, Tecpr2, Zbtb4
#> ℹ Gm10941, Trf, Man1c1, Hmgcs1, Nipal1, Jam3, Pgap1, Alpl, Kcnip3, Tnr
#> ℹ Gm15915, Rbp2, Cbfa2t2, Sh2d4a, Bbc3, Megf6, Naaladl2, Fam46d, Hist2h2ac, Tox2
#> ℹ StandardBE_ 2
#> ℹ Positive: Spp1, Gsta3, Sparc, Vim, Atp1b1, Mt1, Dbi, Anxa2, Rps2, Id2
#> ℹ Rpl22l1, Rplp1, Mgst1, Clu, Sox9, Cldn6, Mdk, Pdzk1ip1, Bicc1, 1700011H14Rik
#> ℹ Rps12, S100a10, Cldn3, Rpl36a, Ppp1r1b, Adamts1, Serpinh1, Mt2, Ifitm2, Rpl39
#> ℹ Negative: Rpa3, Aacs, Tmem108, Poc1a, Epn3, Wipi1, B830012L14Rik, Tmcc3, Wsb1, Plekho1
#> ℹ Ppp2r2b, Tecpr2, Zbtb4, Haus8, Trf, Gm5420, Man1c1, Hmgcs1, Nipal1, Jam3
#> ℹ Tcerg1, Pgap1, Snrpa1, Alpl, Larp1b, Kcnip3, Tnr, Lsm12, Ptbp3, Gm15915
#> ℹ StandardBE_ 3
#> ℹ Positive: Cck, Mdk, Gadd45a, Neurog3, Selm, Sox4, Btbd17, Tmsb4x, Btg2, Cldn6
#> ℹ Cotl1, Ptma, Jun, Ppp1r14a, Rps2, Ifitm2, Neurod2, Igfbpl1, Gnas, Krt7
#> ℹ Nkx6-1, Aplp1, Ppp3ca, Lrpap1, Rplp1, Hn1, Rps12, Mfng, BC023829, Smarcd2
#> ℹ Negative: Elovl6, Tmem108, Poc1a, Epn3, Nop56, Wipi1, B830012L14Rik, Rrp15, Rfc1, Fgf12
#> ℹ Slc20a1, Ppp2r2b, Lama1, Tecpr2, Zbtb4, Eif1ax, Fam162a, P4ha3, Gm10941, Tenm4
#> ℹ Pde4b, Gm5420, Man1c1, Hmgcs1, Pgap1, Mgst2, Larp1b, Kcnip3, Tnr, Lsm12
#> ℹ StandardBE_ 4
#> ℹ Positive: Spp1, Cyr61, Krt18, Tpm1, Krt8, Myl12a, Vim, Jun, Anxa5, Tnfrsf12a
#> ℹ Csrp1, Sparc, Cldn7, Nudt19, Anxa2, Clu, Myl9, Atp1b1, Cldn3, Tagln2
#> ℹ S100a10, 1700011H14Rik, Cd24a, Rps2, Dbi, Id2, Lurap1l, Rplp1, Myl12b, Klf6
#> ℹ Negative: Rpa3, Elovl6, Aacs, Tmem108, Poc1a, Tmcc3, Rfc1, Plekho1, Slc20a1, Ppp2r2b
#> ℹ Lama1, Tecpr2, Gm10941, Tenm4, Pde4b, Man1c1, Nipal1, Jam3, Pgap1, Alpl
#> ℹ Mgst2, Kcnip3, Tnr, Ptbp3, Gm15915, Cntln, Ocln, Fras1, Rbp2, Cbfa2t2
#> ℹ StandardBE_ 5
#> ℹ Positive: 2810417H13Rik, Rrm2, Hmgb2, Dut, Pcna, Lig1, H2afz, Tipin, Tuba1b, Tk1
#> ℹ Mcm5, Dek, Tyms, Gmnn, Ran, Tubb5, Rfc2, Srsf2, Ranbp1, Orc6
#> ℹ Mcm3, Uhrf1, Gins2, Dnajc9, Mcm6, Siva1, Rfc3, Mcm7, Rpa2, Ptma
#> ℹ Negative: 1110002L01Rik, Aacs, Wipi1, B830012L14Rik, Tmcc3, Trib1, Fgf12, Plekho1, Ppp2r2b, Lama1
#> ℹ Tenm4, Trf, Gm5420, Man1c1, Jam3, Mgst2, Kcnip3, Tnr, Gm15915, Cbfa2t2
#> ℹ Sh2d4a, Bbc3, Fkbp9, Ano6, Prkcb, Megf6, Fam46d, Slc52a3, Ankrd2, Tox2
#> ✔ [2026-07-15 19:49:49] NMF compute completed
#> ℹ [2026-07-15 19:49:49] Use stored estimated dimensions 1:50 for Standardnmf
#> ℹ [2026-07-15 19:49:50] Perform `Seurat::FindClusters()` with `cluster_algorithm = 'louvain'` and `cluster_resolution = 0.6`
#> ℹ [2026-07-15 19:51:31] Reorder clusters...
#> ℹ [2026-07-15 19:51:31] Skip `log1p()` because `layer = data` is not "counts"
#> ℹ [2026-07-15 19:51:31] Perform umap nonlinear dimension reduction
#> ℹ [2026-07-15 19:51:38] Perform mds linear dimension reduction
#> ℹ [2026-07-15 19:51:39] Use stored estimated dimensions 1:50 for Standardmds
#> ℹ [2026-07-15 19:51:40] Perform `Seurat::FindClusters()` with `cluster_algorithm = 'louvain'` and `cluster_resolution = 0.6`
#> ℹ [2026-07-15 19:54:02] Reorder clusters...
#> ℹ [2026-07-15 19:54:02] Skip `log1p()` because `layer = data` is not "counts"
#> ℹ [2026-07-15 19:54:02] Perform umap nonlinear dimension reduction
#> ✔ [2026-07-15 19:54:10] Standard processing workflow completed
plist1 <- lapply(
linear_reductions, function(lr) {
CellDimPlot(
pancreas_sub,
group.by = "SubCellType",
reduction = paste0(
"Standard", lr, "UMAP2D"
),
xlab = "", ylab = "",
title = paste0(lr, "_umap"),
legend.position = "none",
theme_use = "theme_blank"
)
}
)
patchwork::wrap_plots(plist1)
# Use a combination of different linear
# or nonlinear dimension reduction methods
linear_reductions <- c(
"pca", "nmf", "mds"
)
pancreas_sub <- standard_scop(
pancreas_sub,
linear_reduction = linear_reductions,
nonlinear_reduction = "umap"
)
#> ℹ [2026-07-15 19:48:31] Start standard processing workflow...
#> ℹ [2026-07-15 19:48:31] Checking a list of <Seurat>...
#> ℹ [2026-07-15 19:48:31] Data 1/1 of the `srt_list` has been log-normalized
#> ℹ [2026-07-15 19:48:31] Perform `FindVariableFeatures()` on 1/1 of `srt_list`...
#> ℹ [2026-07-15 19:48:32] Use the separate HVF from `srt_list`
#> ℹ [2026-07-15 19:48:32] Number of available HVF: 2000
#> ℹ [2026-07-15 19:48:32] Finished check
#> ℹ [2026-07-15 19:48:32] Perform `ScaleData()`
#> ℹ [2026-07-15 19:48:32] Perform pca linear dimension reduction
#> ℹ [2026-07-15 19:48:33] Use stored estimated dimensions 1:23 for Standardpca
#> ℹ [2026-07-15 19:48:34] Perform `Seurat::FindClusters()` with `cluster_algorithm = 'louvain'` and `cluster_resolution = 0.6`
#> ℹ [2026-07-15 19:49:32] Reorder clusters...
#> ℹ [2026-07-15 19:49:33] Skip `log1p()` because `layer = data` is not "counts"
#> ℹ [2026-07-15 19:49:33] Perform umap nonlinear dimension reduction
#> Warning: Key ‘StandardpcaUMAP2D_’ taken, using ‘standardpcaumap2d_’ instead
#> ℹ [2026-07-15 19:49:39] Perform nmf linear dimension reduction
#> ℹ [2026-07-15 19:49:39] Running NMF...
#> ℹ StandardBE_ 1
#> ℹ Positive: Ccnd1, Spp1, Mdk, Rps2, Ldha, Pebp1, Cd24a, Dlk1, Krt8, Mgst1
#> ℹ Clu, Gapdh, Eno1, Prdx1, Cldn10, Mif, Cldn7, Npm1, Dbi, Vim
#> ℹ Sox9, Rpl12, Aldh1b1, Rplp1, Wfdc2, Krt18, Tkt, Aldoa, Hspe1, Ptma
#> ℹ Negative: Tmem108, Poc1a, Epn3, Wipi1, Tmcc3, Nhsl1, Fgf12, Plekho1, Tecpr2, Zbtb4
#> ℹ Gm10941, Trf, Man1c1, Hmgcs1, Nipal1, Jam3, Pgap1, Alpl, Kcnip3, Tnr
#> ℹ Gm15915, Rbp2, Cbfa2t2, Sh2d4a, Bbc3, Megf6, Naaladl2, Fam46d, Hist2h2ac, Tox2
#> ℹ StandardBE_ 2
#> ℹ Positive: Spp1, Gsta3, Sparc, Vim, Atp1b1, Mt1, Dbi, Anxa2, Rps2, Id2
#> ℹ Rpl22l1, Rplp1, Mgst1, Clu, Sox9, Cldn6, Mdk, Pdzk1ip1, Bicc1, 1700011H14Rik
#> ℹ Rps12, S100a10, Cldn3, Rpl36a, Ppp1r1b, Adamts1, Serpinh1, Mt2, Ifitm2, Rpl39
#> ℹ Negative: Rpa3, Aacs, Tmem108, Poc1a, Epn3, Wipi1, B830012L14Rik, Tmcc3, Wsb1, Plekho1
#> ℹ Ppp2r2b, Tecpr2, Zbtb4, Haus8, Trf, Gm5420, Man1c1, Hmgcs1, Nipal1, Jam3
#> ℹ Tcerg1, Pgap1, Snrpa1, Alpl, Larp1b, Kcnip3, Tnr, Lsm12, Ptbp3, Gm15915
#> ℹ StandardBE_ 3
#> ℹ Positive: Cck, Mdk, Gadd45a, Neurog3, Selm, Sox4, Btbd17, Tmsb4x, Btg2, Cldn6
#> ℹ Cotl1, Ptma, Jun, Ppp1r14a, Rps2, Ifitm2, Neurod2, Igfbpl1, Gnas, Krt7
#> ℹ Nkx6-1, Aplp1, Ppp3ca, Lrpap1, Rplp1, Hn1, Rps12, Mfng, BC023829, Smarcd2
#> ℹ Negative: Elovl6, Tmem108, Poc1a, Epn3, Nop56, Wipi1, B830012L14Rik, Rrp15, Rfc1, Fgf12
#> ℹ Slc20a1, Ppp2r2b, Lama1, Tecpr2, Zbtb4, Eif1ax, Fam162a, P4ha3, Gm10941, Tenm4
#> ℹ Pde4b, Gm5420, Man1c1, Hmgcs1, Pgap1, Mgst2, Larp1b, Kcnip3, Tnr, Lsm12
#> ℹ StandardBE_ 4
#> ℹ Positive: Spp1, Cyr61, Krt18, Tpm1, Krt8, Myl12a, Vim, Jun, Anxa5, Tnfrsf12a
#> ℹ Csrp1, Sparc, Cldn7, Nudt19, Anxa2, Clu, Myl9, Atp1b1, Cldn3, Tagln2
#> ℹ S100a10, 1700011H14Rik, Cd24a, Rps2, Dbi, Id2, Lurap1l, Rplp1, Myl12b, Klf6
#> ℹ Negative: Rpa3, Elovl6, Aacs, Tmem108, Poc1a, Tmcc3, Rfc1, Plekho1, Slc20a1, Ppp2r2b
#> ℹ Lama1, Tecpr2, Gm10941, Tenm4, Pde4b, Man1c1, Nipal1, Jam3, Pgap1, Alpl
#> ℹ Mgst2, Kcnip3, Tnr, Ptbp3, Gm15915, Cntln, Ocln, Fras1, Rbp2, Cbfa2t2
#> ℹ StandardBE_ 5
#> ℹ Positive: 2810417H13Rik, Rrm2, Hmgb2, Dut, Pcna, Lig1, H2afz, Tipin, Tuba1b, Tk1
#> ℹ Mcm5, Dek, Tyms, Gmnn, Ran, Tubb5, Rfc2, Srsf2, Ranbp1, Orc6
#> ℹ Mcm3, Uhrf1, Gins2, Dnajc9, Mcm6, Siva1, Rfc3, Mcm7, Rpa2, Ptma
#> ℹ Negative: 1110002L01Rik, Aacs, Wipi1, B830012L14Rik, Tmcc3, Trib1, Fgf12, Plekho1, Ppp2r2b, Lama1
#> ℹ Tenm4, Trf, Gm5420, Man1c1, Jam3, Mgst2, Kcnip3, Tnr, Gm15915, Cbfa2t2
#> ℹ Sh2d4a, Bbc3, Fkbp9, Ano6, Prkcb, Megf6, Fam46d, Slc52a3, Ankrd2, Tox2
#> ✔ [2026-07-15 19:49:49] NMF compute completed
#> ℹ [2026-07-15 19:49:49] Use stored estimated dimensions 1:50 for Standardnmf
#> ℹ [2026-07-15 19:49:50] Perform `Seurat::FindClusters()` with `cluster_algorithm = 'louvain'` and `cluster_resolution = 0.6`
#> ℹ [2026-07-15 19:51:31] Reorder clusters...
#> ℹ [2026-07-15 19:51:31] Skip `log1p()` because `layer = data` is not "counts"
#> ℹ [2026-07-15 19:51:31] Perform umap nonlinear dimension reduction
#> ℹ [2026-07-15 19:51:38] Perform mds linear dimension reduction
#> ℹ [2026-07-15 19:51:39] Use stored estimated dimensions 1:50 for Standardmds
#> ℹ [2026-07-15 19:51:40] Perform `Seurat::FindClusters()` with `cluster_algorithm = 'louvain'` and `cluster_resolution = 0.6`
#> ℹ [2026-07-15 19:54:02] Reorder clusters...
#> ℹ [2026-07-15 19:54:02] Skip `log1p()` because `layer = data` is not "counts"
#> ℹ [2026-07-15 19:54:02] Perform umap nonlinear dimension reduction
#> ✔ [2026-07-15 19:54:10] Standard processing workflow completed
plist1 <- lapply(
linear_reductions, function(lr) {
CellDimPlot(
pancreas_sub,
group.by = "SubCellType",
reduction = paste0(
"Standard", lr, "UMAP2D"
),
xlab = "", ylab = "",
title = paste0(lr, "_umap"),
legend.position = "none",
theme_use = "theme_blank"
)
}
)
patchwork::wrap_plots(plist1)
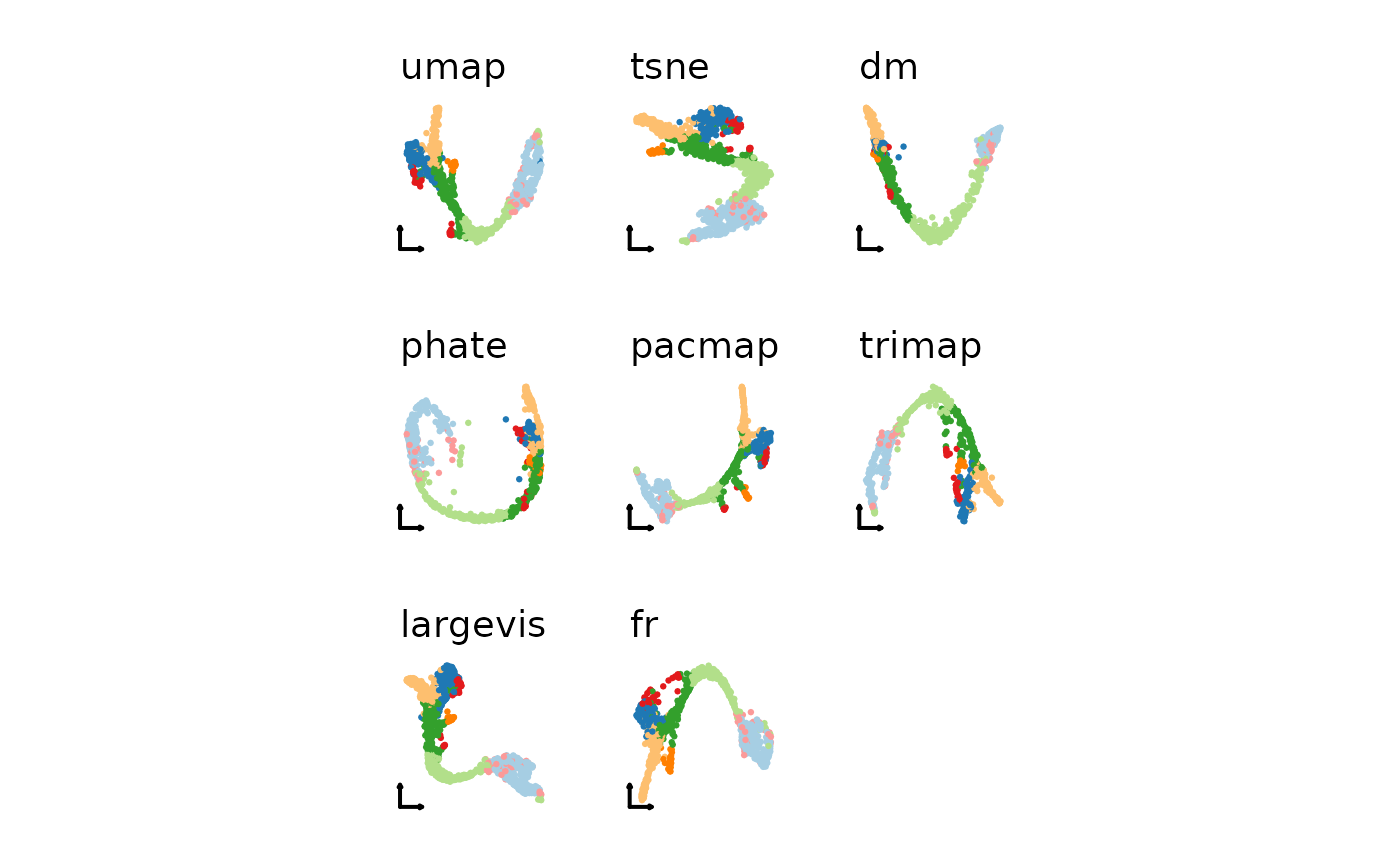
 nonlinear_reductions <- c(
"umap", "tsne", "fr"
)
pancreas_sub <- standard_scop(
pancreas_sub,
linear_reduction = "pca",
nonlinear_reduction = nonlinear_reductions
)
#> ℹ [2026-07-15 19:54:11] Start standard processing workflow...
#> ℹ [2026-07-15 19:54:11] Checking a list of <Seurat>...
#> ℹ [2026-07-15 19:54:12] Data 1/1 of the `srt_list` has been log-normalized
#> ℹ [2026-07-15 19:54:12] Perform `FindVariableFeatures()` on 1/1 of `srt_list`...
#> ℹ [2026-07-15 19:54:12] Use the separate HVF from `srt_list`
#> ℹ [2026-07-15 19:54:12] Number of available HVF: 2000
#> ℹ [2026-07-15 19:54:12] Finished check
#> ℹ [2026-07-15 19:54:12] Perform `ScaleData()`
#> ℹ [2026-07-15 19:54:12] Perform pca linear dimension reduction
#> ℹ [2026-07-15 19:54:13] Use stored estimated dimensions 1:23 for Standardpca
#> ℹ [2026-07-15 19:54:14] Perform `Seurat::FindClusters()` with `cluster_algorithm = 'louvain'` and `cluster_resolution = 0.6`
#> ℹ [2026-07-15 19:57:42] Reorder clusters...
#> ℹ [2026-07-15 19:57:46] Skip `log1p()` because `layer = data` is not "counts"
#> ℹ [2026-07-15 19:57:46] Perform umap nonlinear dimension reduction
#> ℹ [2026-07-15 19:57:55] Perform tsne nonlinear dimension reduction
#> ℹ [2026-07-15 19:57:55] Perform tsne nonlinear dimension reduction using Standardpca (1:23)
#> ℹ [2026-07-15 19:57:58] Perform fr nonlinear dimension reduction
#> ℹ [2026-07-15 19:57:58] Perform fr nonlinear dimension reduction using Standardpca_SNN
#> ✔ [2026-07-15 19:57:59] Standard processing workflow completed
plist2 <- lapply(
nonlinear_reductions, function(nr) {
CellDimPlot(
pancreas_sub,
group.by = "SubCellType",
reduction = paste0(
"Standardpca", nr, "2D"
),
xlab = "", ylab = "",
title = paste0("pca_", nr),
legend.position = "none",
theme_use = "theme_blank"
)
}
)
patchwork::wrap_plots(plist2)
nonlinear_reductions <- c(
"umap", "tsne", "fr"
)
pancreas_sub <- standard_scop(
pancreas_sub,
linear_reduction = "pca",
nonlinear_reduction = nonlinear_reductions
)
#> ℹ [2026-07-15 19:54:11] Start standard processing workflow...
#> ℹ [2026-07-15 19:54:11] Checking a list of <Seurat>...
#> ℹ [2026-07-15 19:54:12] Data 1/1 of the `srt_list` has been log-normalized
#> ℹ [2026-07-15 19:54:12] Perform `FindVariableFeatures()` on 1/1 of `srt_list`...
#> ℹ [2026-07-15 19:54:12] Use the separate HVF from `srt_list`
#> ℹ [2026-07-15 19:54:12] Number of available HVF: 2000
#> ℹ [2026-07-15 19:54:12] Finished check
#> ℹ [2026-07-15 19:54:12] Perform `ScaleData()`
#> ℹ [2026-07-15 19:54:12] Perform pca linear dimension reduction
#> ℹ [2026-07-15 19:54:13] Use stored estimated dimensions 1:23 for Standardpca
#> ℹ [2026-07-15 19:54:14] Perform `Seurat::FindClusters()` with `cluster_algorithm = 'louvain'` and `cluster_resolution = 0.6`
#> ℹ [2026-07-15 19:57:42] Reorder clusters...
#> ℹ [2026-07-15 19:57:46] Skip `log1p()` because `layer = data` is not "counts"
#> ℹ [2026-07-15 19:57:46] Perform umap nonlinear dimension reduction
#> ℹ [2026-07-15 19:57:55] Perform tsne nonlinear dimension reduction
#> ℹ [2026-07-15 19:57:55] Perform tsne nonlinear dimension reduction using Standardpca (1:23)
#> ℹ [2026-07-15 19:57:58] Perform fr nonlinear dimension reduction
#> ℹ [2026-07-15 19:57:58] Perform fr nonlinear dimension reduction using Standardpca_SNN
#> ✔ [2026-07-15 19:57:59] Standard processing workflow completed
plist2 <- lapply(
nonlinear_reductions, function(nr) {
CellDimPlot(
pancreas_sub,
group.by = "SubCellType",
reduction = paste0(
"Standardpca", nr, "2D"
),
xlab = "", ylab = "",
title = paste0("pca_", nr),
legend.position = "none",
theme_use = "theme_blank"
)
}
)
patchwork::wrap_plots(plist2)
 data(visium_human_pancreas_sub)
spatial <- standard_scop(
visium_human_pancreas_sub,
workflow = "spatial",
assay = "Spatial",
do_spatial_cluster = FALSE,
spatial_cluster_method = "BayesSpace",
do_deconvolution = FALSE,
deconvolution_method = "RCTD",
linear_reduction_dims = 10,
linear_reduction_dims_use = 1:5,
nonlinear_reduction_dims = 2,
spatial_variable_features_params = list(nfeatures = 50)
)
#> ℹ [2026-07-15 19:58:00] Start standard spot-level spatial workflow...
#> ◌ [2026-07-15 19:58:00] Running spot-level quality control
#> ✔ [2026-07-15 19:58:00] 1907 spots passed QC and 79 spots failed QC
#> ℹ [2026-07-15 19:58:00] Start standard processing workflow...
#> ℹ [2026-07-15 19:58:00] Checking a list of <Seurat>...
#> ! [2026-07-15 19:58:00] Data 1/1 of the `srt_list` is "unknown"
#> ℹ [2026-07-15 19:58:00] Perform `NormalizeData()` with `normalization.method = 'LogNormalize'` on 1/1 of `srt_list`...
#> ℹ [2026-07-15 19:58:00] Perform `FindVariableFeatures()` on 1/1 of `srt_list`...
#> ℹ [2026-07-15 19:58:00] Use the separate HVF from `srt_list`
#> ℹ [2026-07-15 19:58:00] Number of available HVF: 2000
#> ℹ [2026-07-15 19:58:00] Finished check
#> ℹ [2026-07-15 19:58:00] Perform `ScaleData()`
#> ℹ [2026-07-15 19:58:01] Perform pca linear dimension reduction
#> ℹ [2026-07-15 19:58:03] Perform `Seurat::FindClusters()` with `cluster_algorithm = 'louvain'` and `cluster_resolution = 0.6`
#> ℹ [2026-07-15 19:58:25] Reorder clusters...
#> ℹ [2026-07-15 19:58:25] Skip `log1p()` because `layer = data` is not "counts"
#> ℹ [2026-07-15 19:58:25] Perform umap nonlinear dimension reduction
#> ✔ [2026-07-15 19:58:37] Standard processing workflow completed
#> ◌ [2026-07-15 19:58:37] Running spatial variable feature detection
#> ✔ [2026-07-15 19:58:39] Stored 50 spatial variable features
#> ✔ [2026-07-15 19:58:39] Standard spot-level spatial workflow completed
SpatialSpotPlot(spatial, group.by = "SpotQC")
data(visium_human_pancreas_sub)
spatial <- standard_scop(
visium_human_pancreas_sub,
workflow = "spatial",
assay = "Spatial",
do_spatial_cluster = FALSE,
spatial_cluster_method = "BayesSpace",
do_deconvolution = FALSE,
deconvolution_method = "RCTD",
linear_reduction_dims = 10,
linear_reduction_dims_use = 1:5,
nonlinear_reduction_dims = 2,
spatial_variable_features_params = list(nfeatures = 50)
)
#> ℹ [2026-07-15 19:58:00] Start standard spot-level spatial workflow...
#> ◌ [2026-07-15 19:58:00] Running spot-level quality control
#> ✔ [2026-07-15 19:58:00] 1907 spots passed QC and 79 spots failed QC
#> ℹ [2026-07-15 19:58:00] Start standard processing workflow...
#> ℹ [2026-07-15 19:58:00] Checking a list of <Seurat>...
#> ! [2026-07-15 19:58:00] Data 1/1 of the `srt_list` is "unknown"
#> ℹ [2026-07-15 19:58:00] Perform `NormalizeData()` with `normalization.method = 'LogNormalize'` on 1/1 of `srt_list`...
#> ℹ [2026-07-15 19:58:00] Perform `FindVariableFeatures()` on 1/1 of `srt_list`...
#> ℹ [2026-07-15 19:58:00] Use the separate HVF from `srt_list`
#> ℹ [2026-07-15 19:58:00] Number of available HVF: 2000
#> ℹ [2026-07-15 19:58:00] Finished check
#> ℹ [2026-07-15 19:58:00] Perform `ScaleData()`
#> ℹ [2026-07-15 19:58:01] Perform pca linear dimension reduction
#> ℹ [2026-07-15 19:58:03] Perform `Seurat::FindClusters()` with `cluster_algorithm = 'louvain'` and `cluster_resolution = 0.6`
#> ℹ [2026-07-15 19:58:25] Reorder clusters...
#> ℹ [2026-07-15 19:58:25] Skip `log1p()` because `layer = data` is not "counts"
#> ℹ [2026-07-15 19:58:25] Perform umap nonlinear dimension reduction
#> ✔ [2026-07-15 19:58:37] Standard processing workflow completed
#> ◌ [2026-07-15 19:58:37] Running spatial variable feature detection
#> ✔ [2026-07-15 19:58:39] Stored 50 spatial variable features
#> ✔ [2026-07-15 19:58:39] Standard spot-level spatial workflow completed
SpatialSpotPlot(spatial, group.by = "SpotQC")
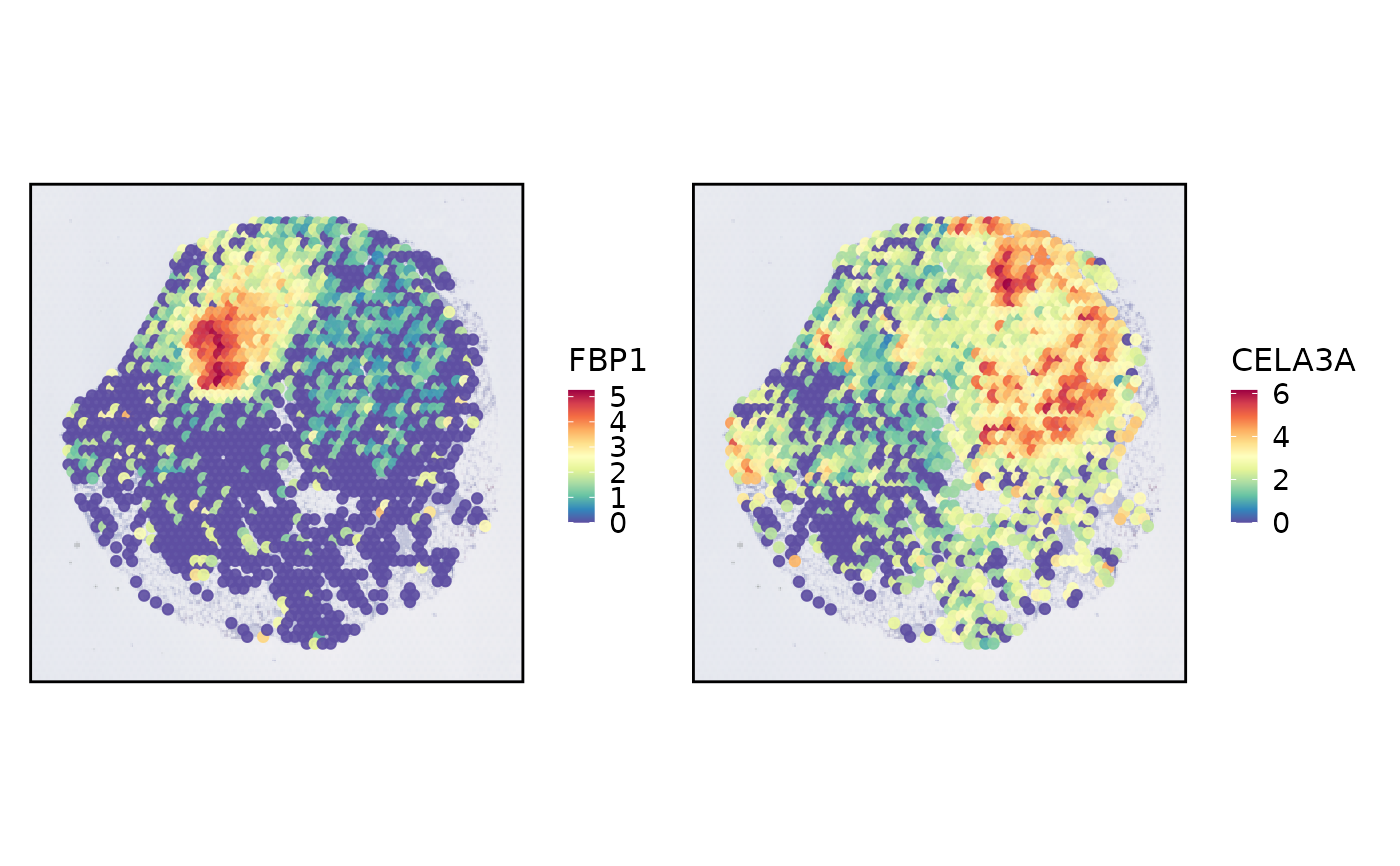
 SpatialSpotPlot(
spatial,
features = spatial@misc[["SpatialVariableFeatures"]][1:2]
)
SpatialSpotPlot(
spatial,
features = spatial@misc[["SpatialVariableFeatures"]][1:2]
)
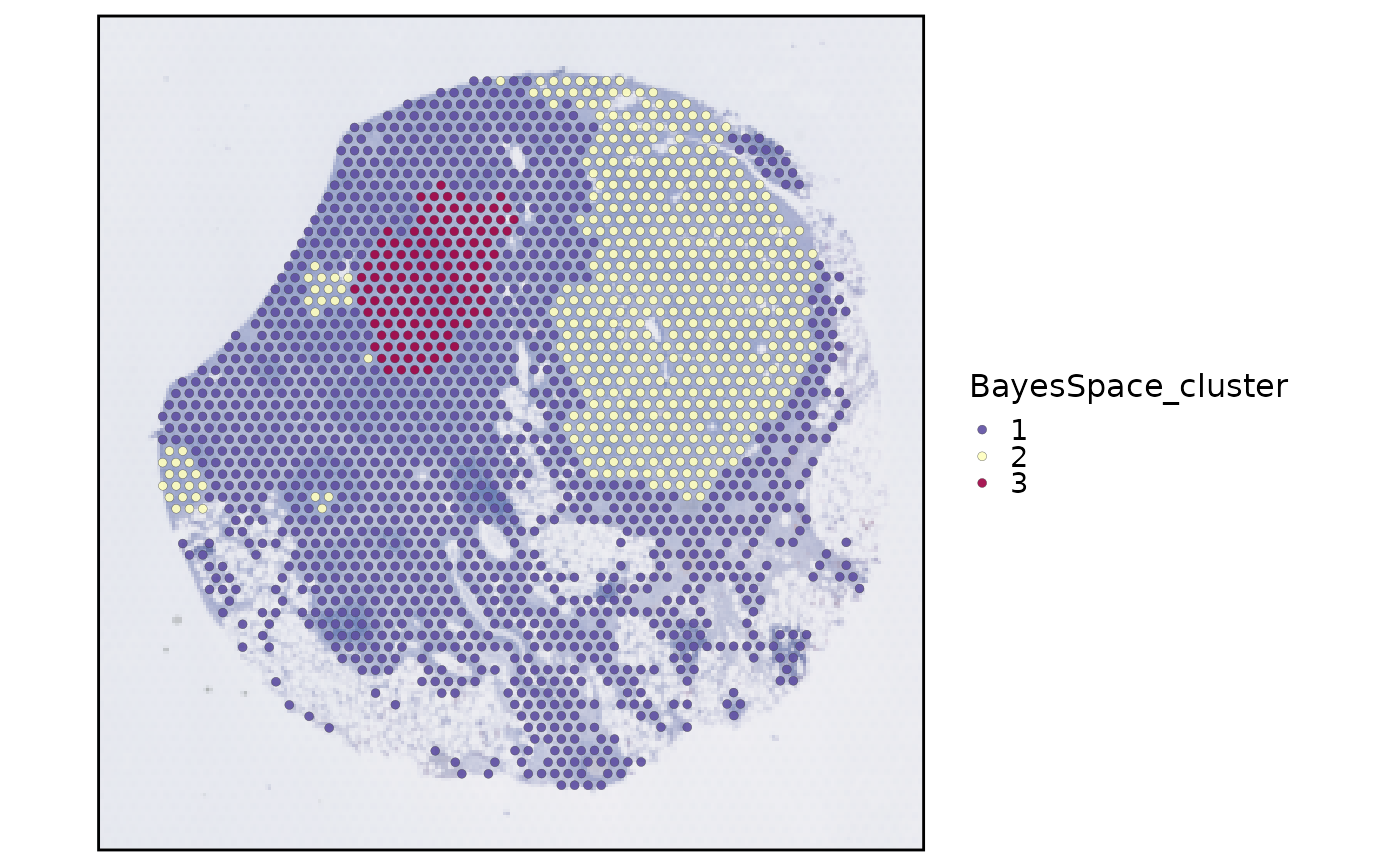
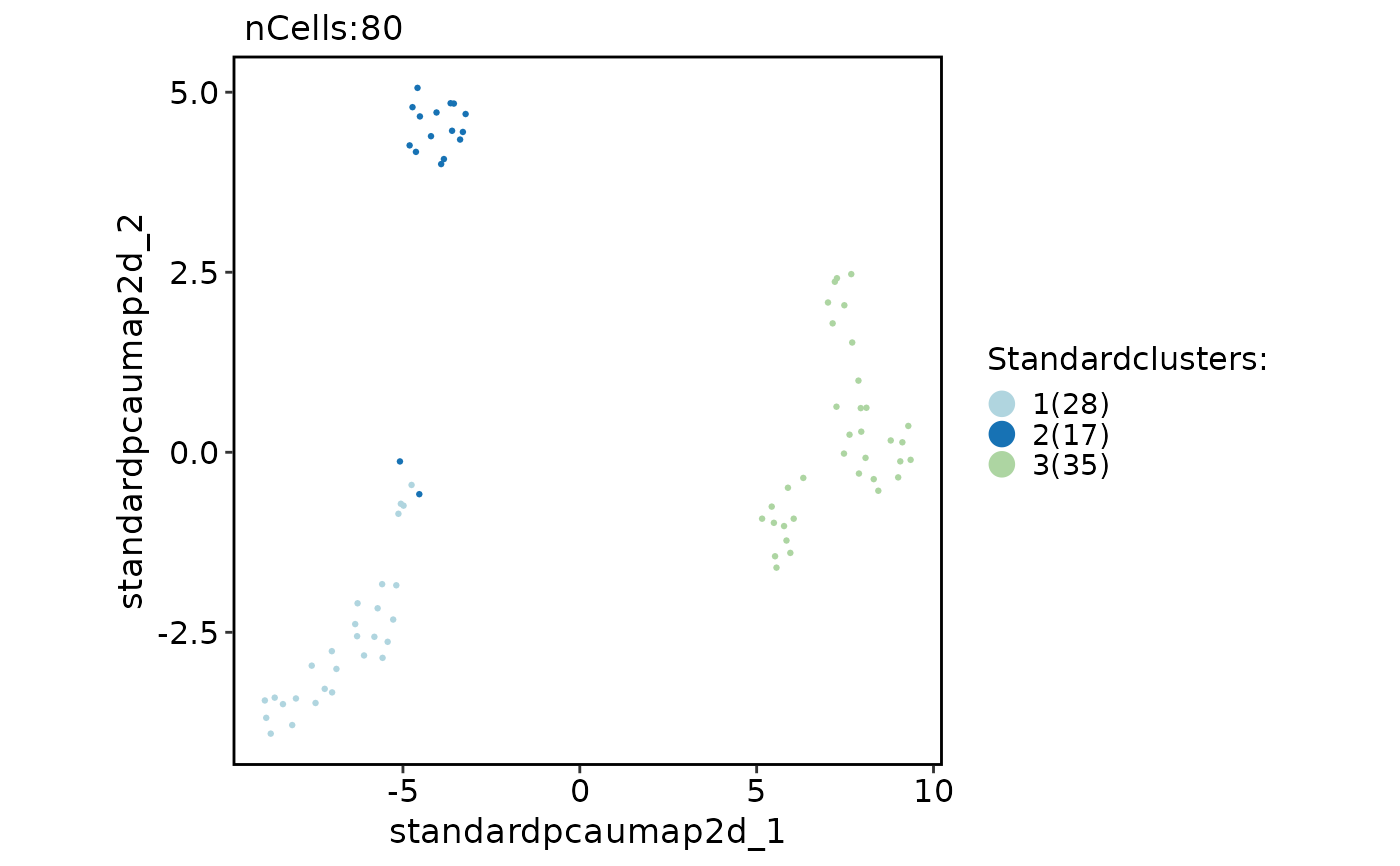
 spatial_bayes <- standard_scop(
visium_human_pancreas_sub,
workflow = "spatial",
assay = "Spatial",
do_spatial_cluster = TRUE,
spatial_cluster_method = "BayesSpace",
spatial_q = 3,
do_deconvolution = FALSE,
deconvolution_method = "RCTD",
bayesspace_params = list(
n.PCs = 5,
n.HVGs = 200,
store_sce = FALSE,
spatial_cluster_params = list(
nrep = 200,
burn.in = 50,
thin = 10,
save.chain = FALSE
)
)
)
#> ℹ [2026-07-15 19:58:41] Start standard spot-level spatial workflow...
#> ◌ [2026-07-15 19:58:41] Running spot-level quality control
#> ✔ [2026-07-15 19:58:41] 1907 spots passed QC and 79 spots failed QC
#> ℹ [2026-07-15 19:58:41] Start standard processing workflow...
#> ℹ [2026-07-15 19:58:41] Checking a list of <Seurat>...
#> ! [2026-07-15 19:58:41] Data 1/1 of the `srt_list` is "unknown"
#> ℹ [2026-07-15 19:58:41] Perform `NormalizeData()` with `normalization.method = 'LogNormalize'` on 1/1 of `srt_list`...
#> ℹ [2026-07-15 19:58:41] Perform `FindVariableFeatures()` on 1/1 of `srt_list`...
#> ℹ [2026-07-15 19:58:41] Use the separate HVF from `srt_list`
#> ℹ [2026-07-15 19:58:41] Number of available HVF: 2000
#> ℹ [2026-07-15 19:58:42] Finished check
#> ℹ [2026-07-15 19:58:42] Perform `ScaleData()`
#> ℹ [2026-07-15 19:58:42] Perform pca linear dimension reduction
#> ℹ [2026-07-15 19:58:43] Use stored estimated dimensions 1:30 for Standardpca
#> ℹ [2026-07-15 19:58:44] Perform `Seurat::FindClusters()` with `cluster_algorithm = 'louvain'` and `cluster_resolution = 0.6`
#> ℹ [2026-07-15 19:59:06] Reorder clusters...
#> ℹ [2026-07-15 19:59:06] Skip `log1p()` because `layer = data` is not "counts"
#> ℹ [2026-07-15 19:59:06] Perform umap nonlinear dimension reduction
#> ✔ [2026-07-15 19:59:18] Standard processing workflow completed
#> ◌ [2026-07-15 19:59:18] Running spatial variable feature detection
#> ✔ [2026-07-15 19:59:20] Stored 2000 spatial variable features
#> ℹ [2026-07-15 19:59:20] Convert <Seurat> to <SingleCellExperiment> for BayesSpace
#> ℹ [2026-07-15 19:59:22] Run BayesSpace spatial clustering with `q = 3`
#> Neighbors were identified for 1974 out of 1986 spots.
#> Fitting model...
#> Calculating labels using iterations 51 through 200.
#> ℹ [2026-07-15 19:59:29] BayesSpace clusters stored in metadata column "BayesSpace_cluster"
#> ✔ [2026-07-15 19:59:29] Standard spot-level spatial workflow completed
SpatialSpotPlot(spatial_bayes, group.by = "BayesSpace_cluster")
spatial_bayes <- standard_scop(
visium_human_pancreas_sub,
workflow = "spatial",
assay = "Spatial",
do_spatial_cluster = TRUE,
spatial_cluster_method = "BayesSpace",
spatial_q = 3,
do_deconvolution = FALSE,
deconvolution_method = "RCTD",
bayesspace_params = list(
n.PCs = 5,
n.HVGs = 200,
store_sce = FALSE,
spatial_cluster_params = list(
nrep = 200,
burn.in = 50,
thin = 10,
save.chain = FALSE
)
)
)
#> ℹ [2026-07-15 19:58:41] Start standard spot-level spatial workflow...
#> ◌ [2026-07-15 19:58:41] Running spot-level quality control
#> ✔ [2026-07-15 19:58:41] 1907 spots passed QC and 79 spots failed QC
#> ℹ [2026-07-15 19:58:41] Start standard processing workflow...
#> ℹ [2026-07-15 19:58:41] Checking a list of <Seurat>...
#> ! [2026-07-15 19:58:41] Data 1/1 of the `srt_list` is "unknown"
#> ℹ [2026-07-15 19:58:41] Perform `NormalizeData()` with `normalization.method = 'LogNormalize'` on 1/1 of `srt_list`...
#> ℹ [2026-07-15 19:58:41] Perform `FindVariableFeatures()` on 1/1 of `srt_list`...
#> ℹ [2026-07-15 19:58:41] Use the separate HVF from `srt_list`
#> ℹ [2026-07-15 19:58:41] Number of available HVF: 2000
#> ℹ [2026-07-15 19:58:42] Finished check
#> ℹ [2026-07-15 19:58:42] Perform `ScaleData()`
#> ℹ [2026-07-15 19:58:42] Perform pca linear dimension reduction
#> ℹ [2026-07-15 19:58:43] Use stored estimated dimensions 1:30 for Standardpca
#> ℹ [2026-07-15 19:58:44] Perform `Seurat::FindClusters()` with `cluster_algorithm = 'louvain'` and `cluster_resolution = 0.6`
#> ℹ [2026-07-15 19:59:06] Reorder clusters...
#> ℹ [2026-07-15 19:59:06] Skip `log1p()` because `layer = data` is not "counts"
#> ℹ [2026-07-15 19:59:06] Perform umap nonlinear dimension reduction
#> ✔ [2026-07-15 19:59:18] Standard processing workflow completed
#> ◌ [2026-07-15 19:59:18] Running spatial variable feature detection
#> ✔ [2026-07-15 19:59:20] Stored 2000 spatial variable features
#> ℹ [2026-07-15 19:59:20] Convert <Seurat> to <SingleCellExperiment> for BayesSpace
#> ℹ [2026-07-15 19:59:22] Run BayesSpace spatial clustering with `q = 3`
#> Neighbors were identified for 1974 out of 1986 spots.
#> Fitting model...
#> Calculating labels using iterations 51 through 200.
#> ℹ [2026-07-15 19:59:29] BayesSpace clusters stored in metadata column "BayesSpace_cluster"
#> ✔ [2026-07-15 19:59:29] Standard spot-level spatial workflow completed
SpatialSpotPlot(spatial_bayes, group.by = "BayesSpace_cluster")