Plot CytoTRACE 2 Results
Usage
CytoTRACEPlot(
  srt,
  reduction = NULL,
  group.by = NULL,
  combine = TRUE,
  nrow = NULL,
  ncol = NULL,
  byrow = TRUE,
  pt.size = NULL,
  pt.alpha = 1,
  palette = "Chinese",
  palcolor = NULL,
  theme_use = "theme_scop",
  theme_args = list(),
  verbose = TRUE,
  ...
)
Arguments
- srt
A Seurat object.
- reduction
Which dimensionality reduction to use. If not specified, will use the reduction returned by DefaultReduction.
- group.by
Name of one or more meta.data columns to group (color) cells by.
- combine
Combine plots into a single
patchworkobject. IfFALSE, return a list of ggplot objects.- nrow
Number of rows in the combined plot. Default is
NULL, which means determined automatically based on the number of plots.- ncol
Number of columns in the combined plot. Default is
NULL, which means determined automatically based on the number of plots.- byrow
Whether to arrange the plots by row in the combined plot. Default is
TRUE.- pt.size
The size of the points in the plot.
- pt.alpha
The transparency of the data points. Default is
1.- palette
Color palette name. Available palettes can be found in thisplot::show_palettes. Default is
"Chinese".- palcolor
Custom colors used to create a color palette. Default is
NULL.- theme_use
Theme used. Can be a character string or a theme function. Default is
"theme_scop".- theme_args
Other arguments passed to the
theme_use. Default islist().- verbose
Whether to print the message. Default is
TRUE.- ...
Additional arguments to be passed to CellDimPlot and FeatureDimPlot.
Value
If combine = TRUE, returns a patchwork object combining all plots.
If combine = FALSE, returns a named list of ggplot objects:
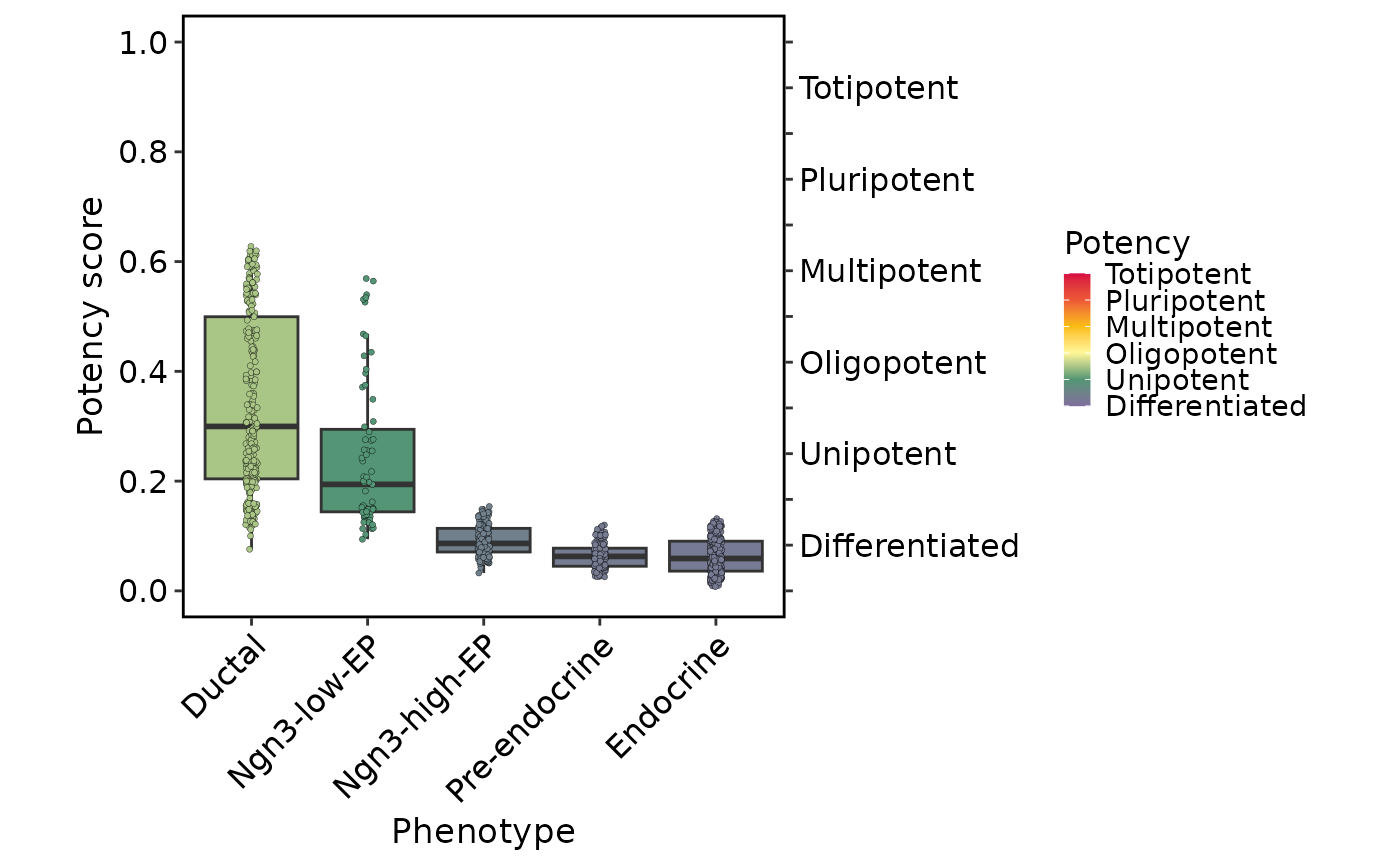
Score: UMAP plot colored by score computed by CytoTRACE2;Potency: UMAP plot colored by potency category computed by CytoTRACE2;Relative: UMAP plot colored by relative score computed by CytoTRACE2;Phenotype: UMAP plot colored by phenotype (ifgroup.byis provided);Boxplot: Boxplot of score computed by CytoTRACE2 corresponding to phenotype (ifgroup.byis provided).
Examples
data(pancreas_sub)
pancreas_sub <- standard_scop(pancreas_sub)
#> ℹ [2026-07-02 08:34:14] Start standard processing workflow...
#> ℹ [2026-07-02 08:34:15] Checking a list of <Seurat>...
#> ! [2026-07-02 08:34:15] Data 1/1 of the `srt_list` is "unknown"
#> ℹ [2026-07-02 08:34:15] Perform `NormalizeData()` with `normalization.method = 'LogNormalize'` on 1/1 of `srt_list`...
#> ℹ [2026-07-02 08:34:15] Perform `FindVariableFeatures()` on 1/1 of `srt_list`...
#> ℹ [2026-07-02 08:34:15] Use the separate HVF from `srt_list`
#> ℹ [2026-07-02 08:34:16] Number of available HVF: 2000
#> ℹ [2026-07-02 08:34:16] Finished check
#> ℹ [2026-07-02 08:34:16] Perform `ScaleData()`
#> ℹ [2026-07-02 08:34:16] Perform pca linear dimension reduction
#> ℹ [2026-07-02 08:34:16] Use stored estimated dimensions 1:23 for Standardpca
#> ℹ [2026-07-02 08:34:17] Perform `Seurat::FindClusters()` with `cluster_algorithm = 'louvain'` and `cluster_resolution = 0.6`
#> ℹ [2026-07-02 08:34:17] Reorder clusters...
#> ℹ [2026-07-02 08:34:17] Skip `log1p()` because `layer = data` is not "counts"
#> ℹ [2026-07-02 08:34:17] Perform umap nonlinear dimension reduction
#> ✔ [2026-07-02 08:34:22] Standard processing workflow completed
pancreas_sub <- RunCytoTRACE(
  pancreas_sub,
  species = "Mus_musculus"
)
#> ◌ [2026-07-02 08:34:22] Running CytoTRACE2
#> ℹ [2026-07-02 08:34:22] Extracting expression matrix from `assay = RNA, layer = counts`
#> ◌ [2026-07-02 08:34:22] Running CytoTRACE2 with `backend = cpp`
#> ℹ [2026-07-02 08:34:22] Preparing CytoTRACE2 database
#> ℹ [2026-07-02 08:34:22] Downloading CytoTRACE2 model data from datasets GitHub repository...
#> ℹ [2026-07-02 08:34:22]   Downloading model_parameters.rds ...
#> ℹ [2026-07-02 08:34:22]   Downloading features_model_training_17.csv ...
#> ℹ [2026-07-02 08:34:23]   Downloading mt_dict_human_to_mouse.csv ...
#> ℹ [2026-07-02 08:34:23]   Downloading mt_human_alias.csv ...
#> ℹ [2026-07-02 08:34:23]   Downloading mt_mouse_alias.csv ...
#> ✔ [2026-07-02 08:34:23] CytoTRACE2 data cached at /home/runner/.local/share/R/scop/CytoTRACE2
#> ℹ [2026-07-02 08:34:23] Species: "Homo_sapiens"
#> ℹ [2026-07-02 08:34:23] Species: "Mus_musculus"
#> ℹ [2026-07-02 08:34:23] Loading model from /home/runner/.local/share/R/scop/CytoTRACE2
#> ℹ [2026-07-02 08:34:26] Dataset contains 15998 genes and 1000 cells.
#> ℹ [2026-07-02 08:34:26] Running on 1 subsample(s)
#> ℹ [2026-07-02 08:34:26] Using 1 core
#> ℹ [2026-07-02 08:34:26] 12486 input genes mapped to model genes.
#> ℹ [2026-07-02 08:34:26] Building results
#> ✔ [2026-07-02 08:34:48] CytoTRACE2 computed successfully
#> ✔ [2026-07-02 08:34:48] CytoTRACE2 computed successfully

CytoTRACEPlot(
  pancreas_sub,
  group.by = "CellType",
  xlab = "UMAP_1",
  ylab = "UMAP_2"
)


plots <- CytoTRACEPlot(
  pancreas_sub,
  group.by = "CellType",
  combine = FALSE
)
plots$Boxplot
plots <- CytoTRACEPlot(
pancreas_sub,
group.by = "CellType",
combine = FALSE
)
plots$Boxplot
