This function creates a velocity plot for a given Seurat object. The plot shows the velocity vectors of the cells in a specified reduction space.
Usage
VelocityPlot(
  srt,
  reduction,
  dims = c(1, 2),
  cells = NULL,
  velocity = "stochastic",
  plot_type = c("raw", "grid", "stream"),
  group.by = NULL,
  group_palette = "Chinese",
  group_palcolor = NULL,
  n_neighbors = ceiling(ncol(srt@assays[[1]])/50),
  density = 1,
  smooth = 0.5,
  scale = 1,
  min_mass = 1,
  cutoff_perc = 5,
  arrow_angle = 20,
  arrow_color = "black",
  streamline_L = 5,
  streamline_minL = 1,
  streamline_res = 1,
  streamline_n = 15,
  streamline_width = c(0, 0.8),
  streamline_alpha = 1,
  streamline_color = NULL,
  streamline_palette = "RdYlBu",
  streamline_palcolor = NULL,
  streamline_bg_color = "white",
  streamline_bg_stroke = 0.5,
  aspect.ratio = 1,
  title = "Cell velocity",
  subtitle = NULL,
  xlab = NULL,
  ylab = NULL,
  legend.position = "right",
  legend.direction = "vertical",
  theme_use = "theme_scop",
  theme_args = list(),
  return_layer = FALSE,
  seed = 11,
  verbose = TRUE
)
Arguments
- srt
A Seurat object.
- reduction
Which dimensionality reduction to use. If not specified, will use the reduction returned by DefaultReduction.
- dims
Dimensions to plot, must be a two-length numeric vector specifying x- and y-dimensions
- cells
A character vector of cell names to use.
- velocity
Name of the velocity to use for plotting. Default is
"stochastic".- plot_type
Type of plot to create. Can be
"raw","grid", or"stream".- group.by
Name of one or more meta.data columns to group (color) cells by.
- group_palette
Name of the palette to use for coloring the groups. Defaults is
"Chinese".- group_palcolor
Colors to use for coloring the groups. Defaults is
NULL.- n_neighbors
Number of neighbors to include for the density estimation. Defaults is
ceiling(ncol(srt@assays[[1]]) / 50).- density
Proportion of cells to plot. Defaults is
1(plot all cells).- smooth
Smoothing parameter for density estimation. Defaults is
0.5.- scale
Scaling factor for the velocity vectors. Defaults is
1.- min_mass
Minimum mass value for the density-based cutoff. Defaults is
1.- cutoff_perc
Percentile value for the density-based cutoff. Defaults is
5.- arrow_angle
Angle of the arrowheads. Defaults is
20.- arrow_color
Color of the arrowheads. Defaults is
"black".- streamline_L
Length of the streamlines. Defaults is
5.- streamline_minL
Minimum length of the streamlines. Defaults is
1.- streamline_res
Resolution of the streamlines. Defaults is
1.- streamline_n
Number of streamlines to plot. Defaults is
15.- streamline_width
Width of the streamlines. Defaults is
c(0, 0.8).- streamline_alpha
Alpha transparency of the streamlines. Defaults is
1.- streamline_color
Color of the streamlines. Defaults is
NULL.- streamline_palette
Name of the palette to use for coloring the streamlines. Defaults is
"RdYlBu".- streamline_palcolor
Colors to use for coloring the streamlines. Defaults is
NULL.- streamline_bg_color
Background color of the streamlines. Defaults is
"white".- streamline_bg_stroke
Stroke width of the streamlines background. Defaults is
0.5.- aspect.ratio
Aspect ratio of the panel. Default is
1.- title
The text for the title. Defaults is
"Cell velocity".- subtitle
The text for the subtitle for the plot which will be displayed below the title. Default is
NULL.- xlab
The x-axis label of the plot. Default is
NULL.- ylab
The y-axis label of the plot. Default is
NULL.- legend.position
The position of legends, one of
"none","left","right","bottom","top". Default is"right".- legend.direction
The direction of the legend in the plot. Can be one of
"vertical"or"horizontal".- theme_use
Theme used. Can be a character string or a theme function. Default is
"theme_scop".- theme_args
Other arguments passed to the
theme_use. Default islist().- return_layer
Whether to return the plot layers as a list. Defaults is
FALSE.- seed
Random seed for reproducibility. Default is
11.- verbose
Whether to print the message. Default is
TRUE.
Examples
data(pancreas_sub)
pancreas_sub <- standard_scop(pancreas_sub)
#> ℹ [2026-07-02 10:12:07] Start standard processing workflow...
#> ℹ [2026-07-02 10:12:08] Checking a list of <Seurat>...
#> ! [2026-07-02 10:12:08] Data 1/1 of the `srt_list` is "unknown"
#> ℹ [2026-07-02 10:12:08] Perform `NormalizeData()` with `normalization.method = 'LogNormalize'` on 1/1 of `srt_list`...
#> ℹ [2026-07-02 10:12:08] Perform `FindVariableFeatures()` on 1/1 of `srt_list`...
#> ℹ [2026-07-02 10:12:08] Use the separate HVF from `srt_list`
#> ℹ [2026-07-02 10:12:08] Number of available HVF: 2000
#> ℹ [2026-07-02 10:12:08] Finished check
#> ℹ [2026-07-02 10:12:08] Perform `ScaleData()`
#> ℹ [2026-07-02 10:12:08] Perform pca linear dimension reduction
#> ℹ [2026-07-02 10:12:09] Use stored estimated dimensions 1:23 for Standardpca
#> ℹ [2026-07-02 10:12:10] Perform `Seurat::FindClusters()` with `cluster_algorithm = 'louvain'` and `cluster_resolution = 0.6`
#> ℹ [2026-07-02 10:12:10] Reorder clusters...
#> ℹ [2026-07-02 10:12:10] Skip `log1p()` because `layer = data` is not "counts"
#> ℹ [2026-07-02 10:12:10] Perform umap nonlinear dimension reduction
#> ✔ [2026-07-02 10:12:17] Standard processing workflow completed
pancreas_sub <- RunSCVELO(
pancreas_sub,
group.by = "SubCellType",
linear_reduction = "pca",
nonlinear_reduction = "umap",
backend = "cpp",
return_seurat = TRUE
)
#> ℹ [2026-07-02 10:12:17] Running scanpy-compatible preprocessing (15998 features -> filter + normalize)...
#> ℹ [2026-07-02 10:12:18] Running scVelo "stochastic" mode with `backend = 'cpp'` (10590 features)
#> ✔ [2026-07-02 10:12:20] scVelo "stochastic" mode completed
#> ✔ [2026-07-02 10:12:20] scVelo cpp backend completed
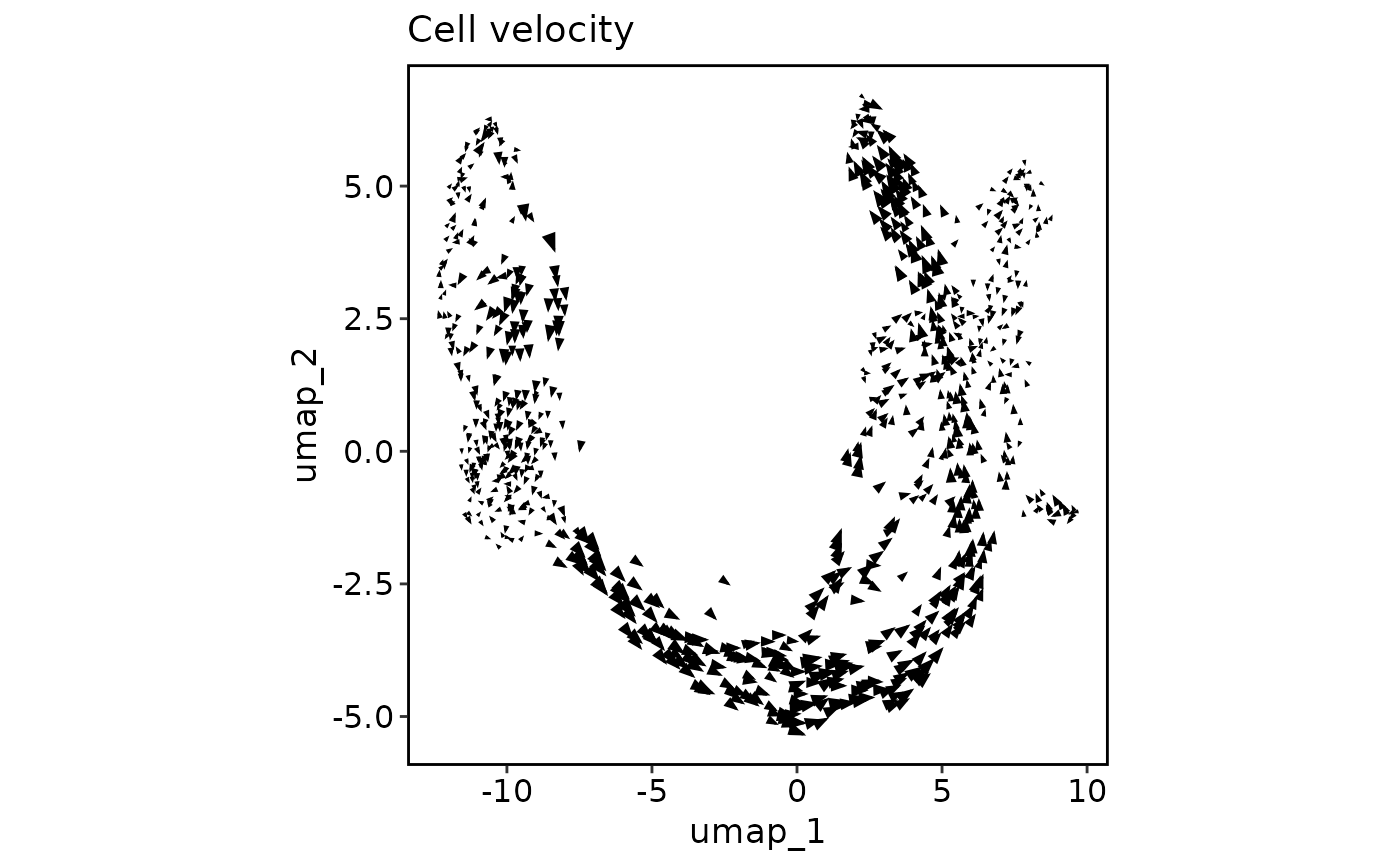
VelocityPlot(
pancreas_sub,
reduction = "umap"
)
 VelocityPlot(
pancreas_sub,
reduction = "umap",
group.by = "SubCellType"
)
VelocityPlot(
pancreas_sub,
reduction = "umap",
group.by = "SubCellType"
)
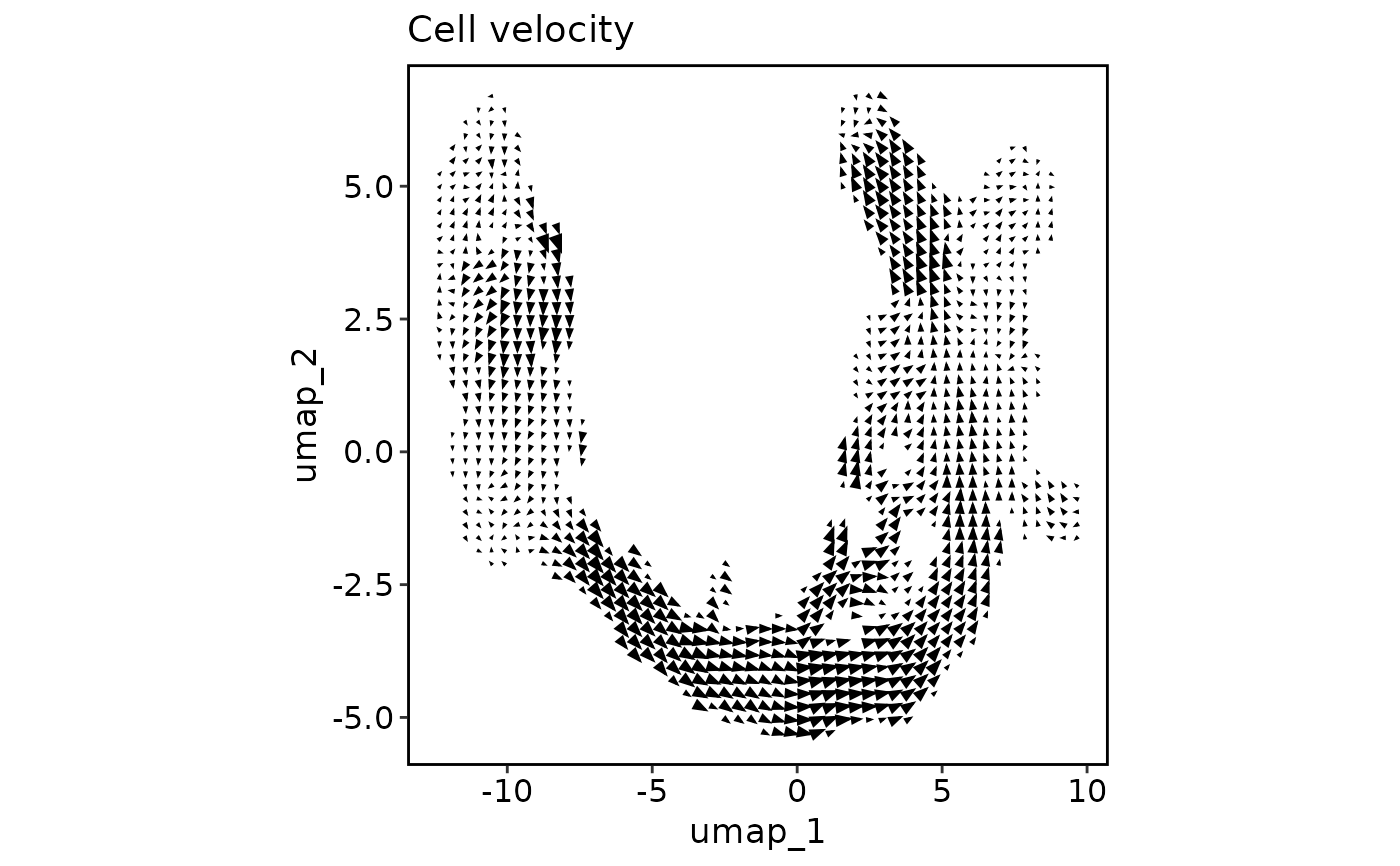 VelocityPlot(
pancreas_sub,
reduction = "umap",
plot_type = "grid"
)
VelocityPlot(
pancreas_sub,
reduction = "umap",
plot_type = "grid"
)
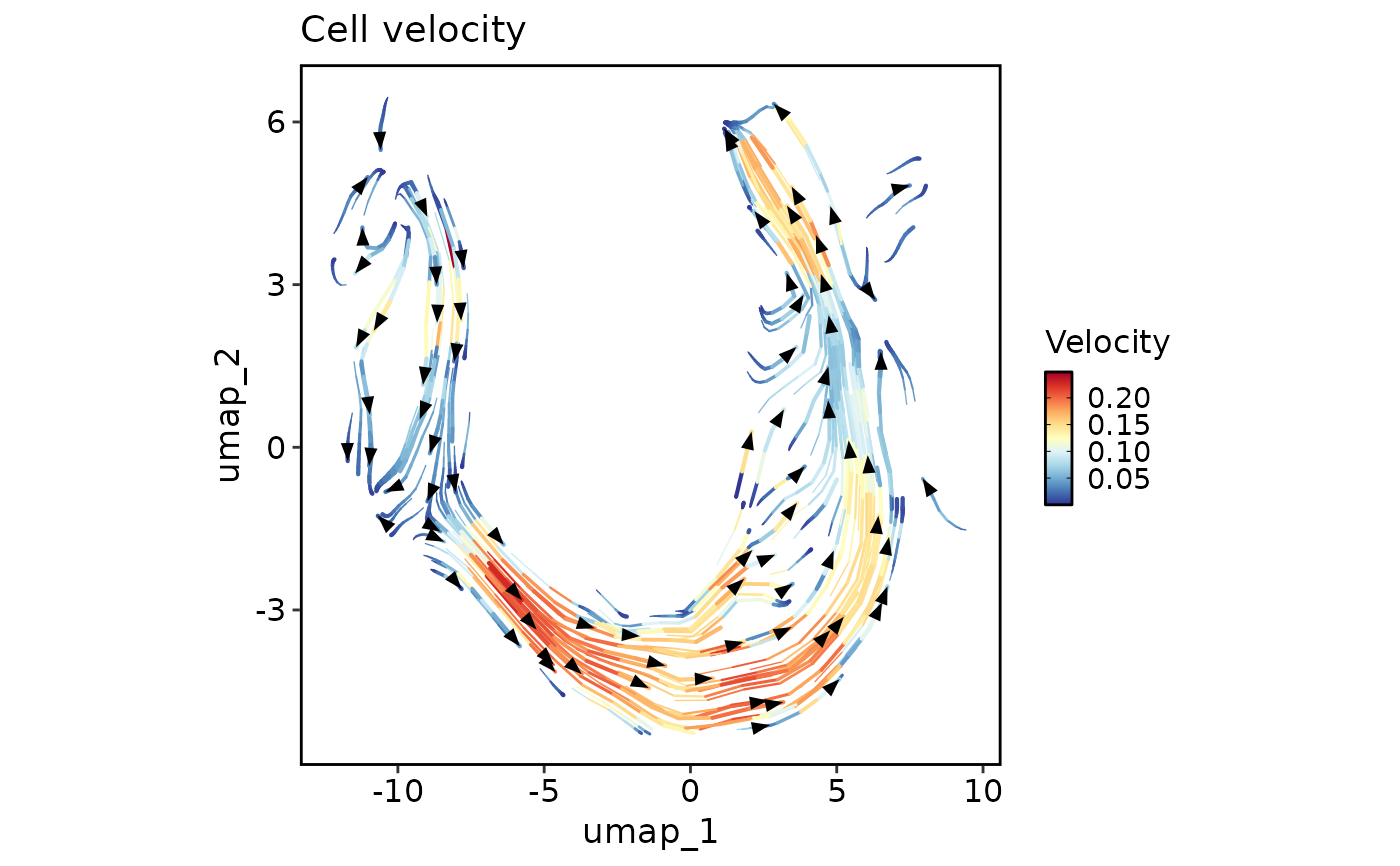 VelocityPlot(
pancreas_sub,
reduction = "umap",
plot_type = "stream"
)
VelocityPlot(
pancreas_sub,
reduction = "umap",
plot_type = "stream"
)
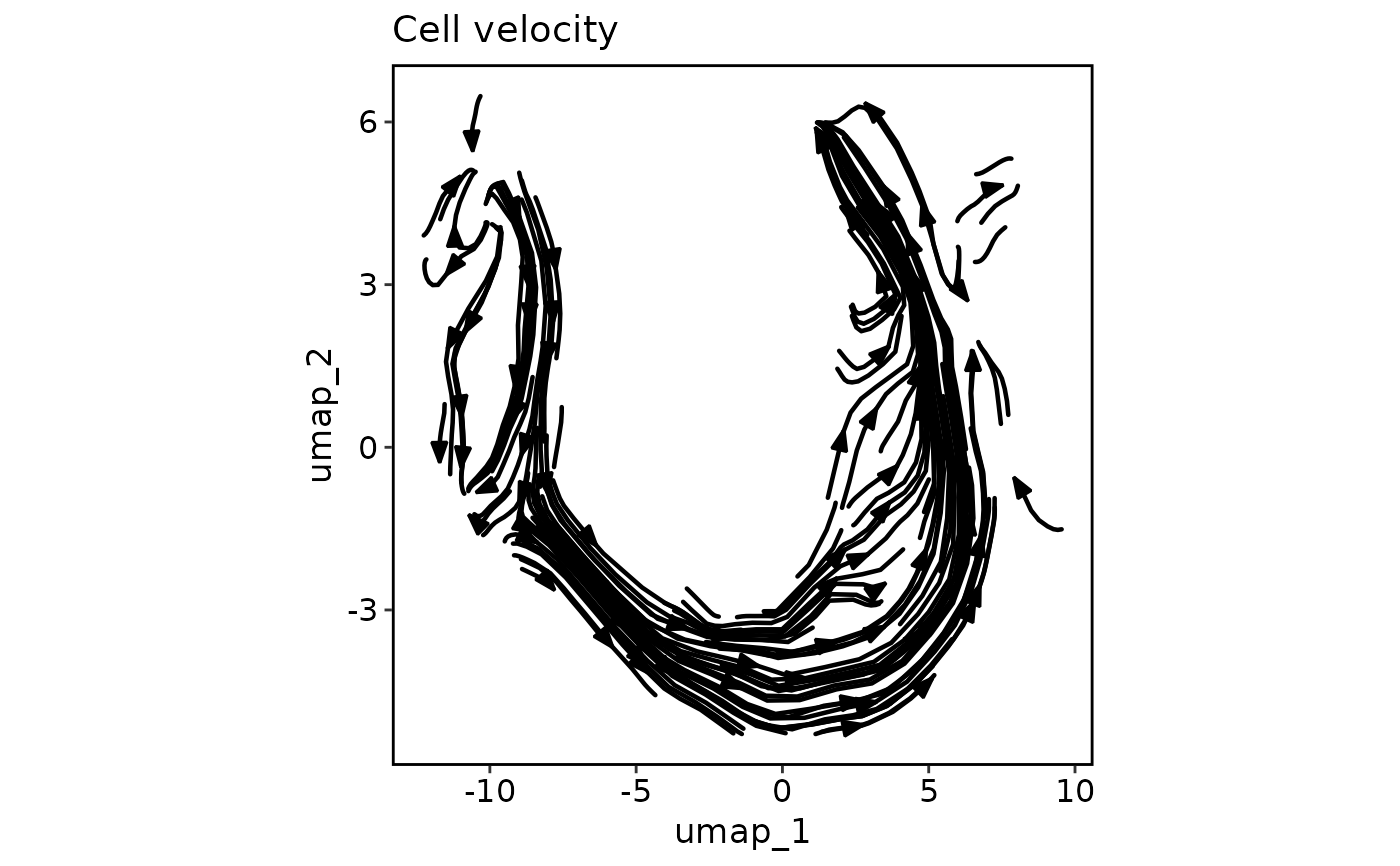 VelocityPlot(
pancreas_sub,
reduction = "umap",
plot_type = "stream",
streamline_color = "black"
)
VelocityPlot(
pancreas_sub,
reduction = "umap",
plot_type = "stream",
streamline_color = "black"
)
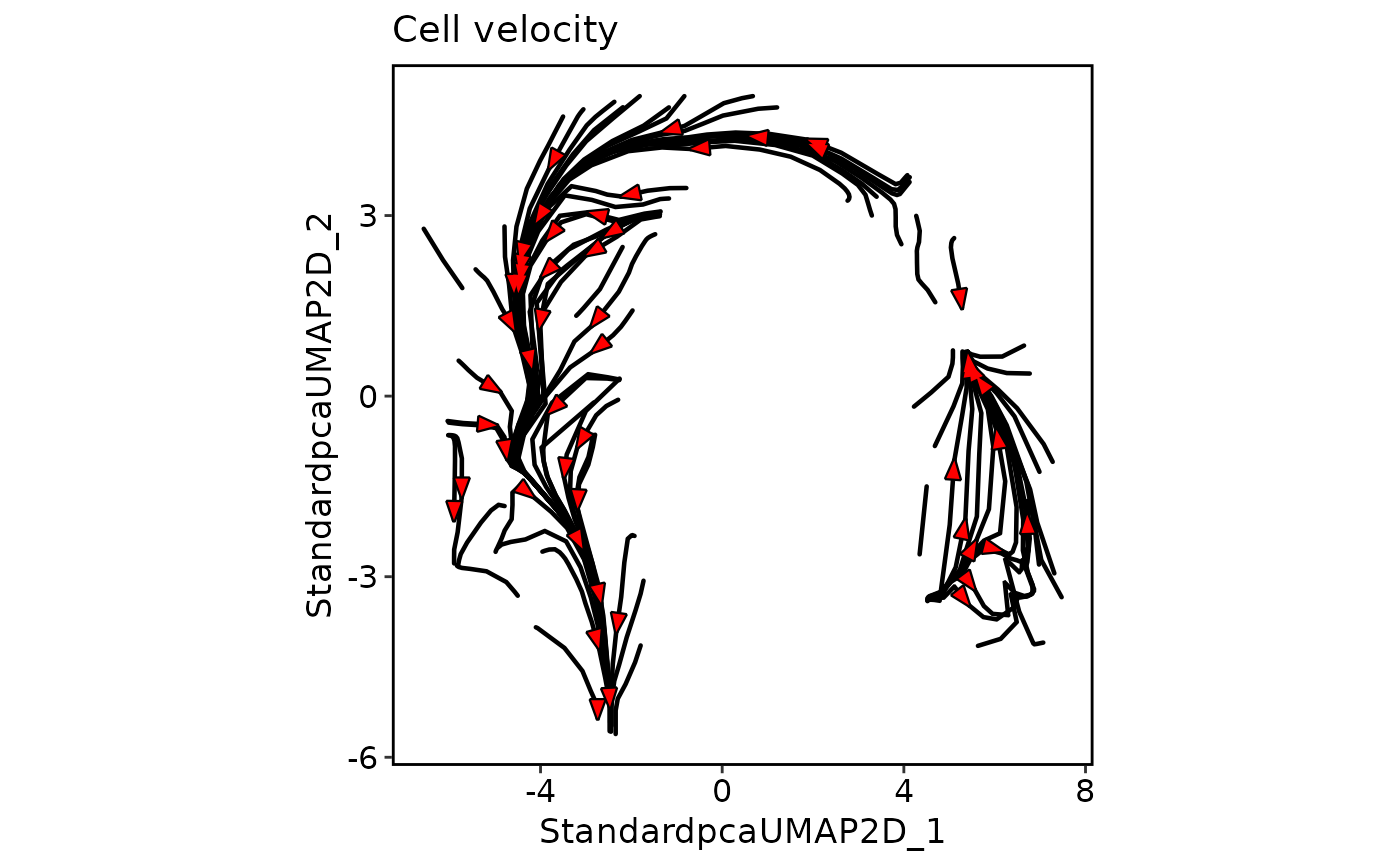
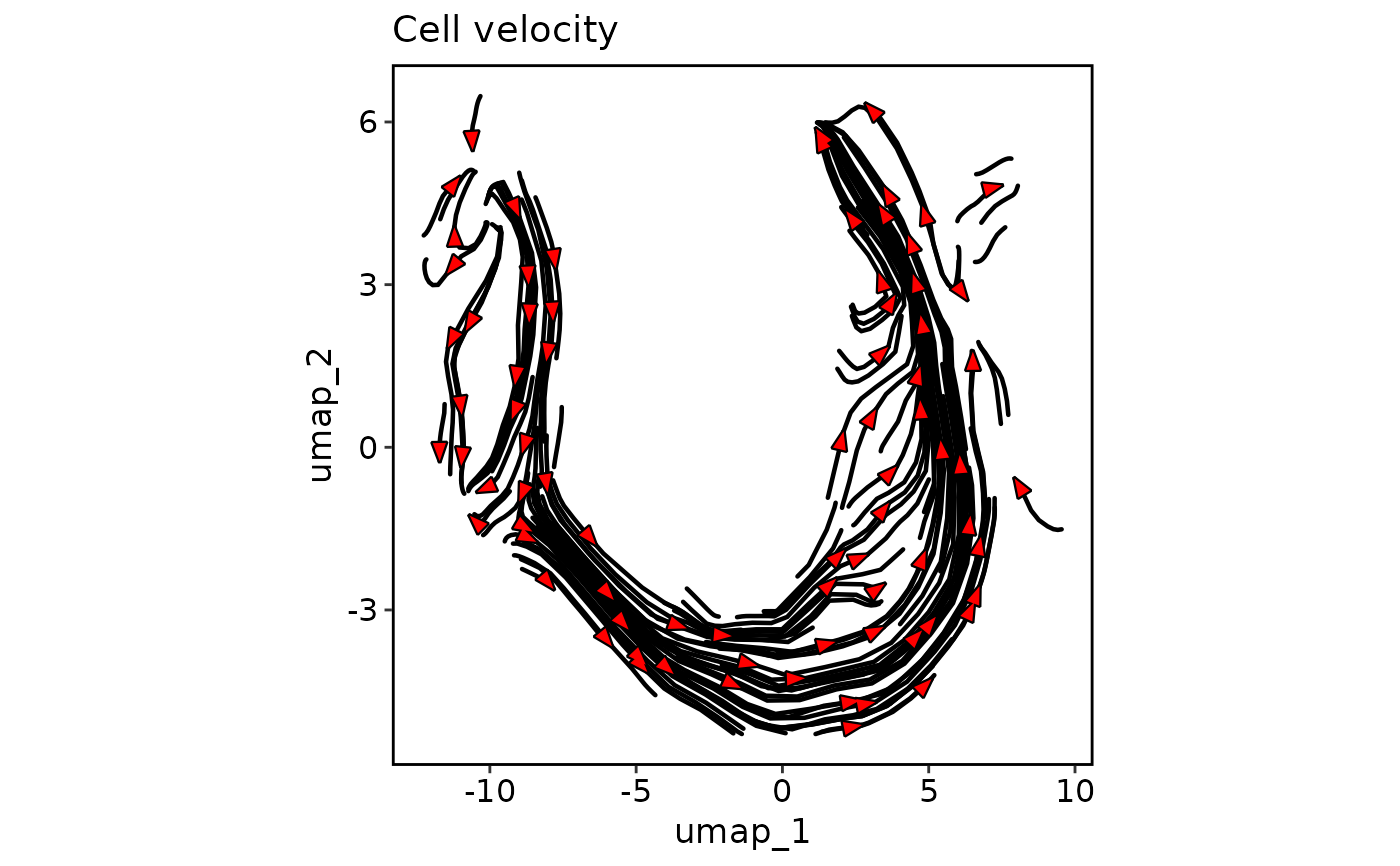 VelocityPlot(
pancreas_sub,
reduction = "umap",
plot_type = "stream",
streamline_color = "black",
arrow_color = "red"
)
VelocityPlot(
pancreas_sub,
reduction = "umap",
plot_type = "stream",
streamline_color = "black",
arrow_color = "red"
)