Plot dynamic features across pseudotime
Usage
DynamicPlot(
  srt,
  lineages,
  features,
  group.by = NULL,
  group_use = NULL,
  cells = NULL,
  layer = "counts",
  assay = NULL,
  family = NULL,
  exp_method = c("log1p", "raw", "zscore", "fc", "log2fc"),
  lib_normalize = identical(layer, "counts"),
  libsize = NULL,
  compare_lineages = TRUE,
  compare_features = FALSE,
  add_line = TRUE,
  add_interval = TRUE,
  line.size = 1,
  line_palette = "Dark2",
  line_palcolor = NULL,
  add_point = TRUE,
  pt.size = 1,
  point_palette = "Chinese",
  point_palcolor = NULL,
  add_rug = TRUE,
  flip = FALSE,
  reverse = FALSE,
  x_order = c("value", "rank"),
  aspect.ratio = NULL,
  legend.position = "right",
  legend.direction = "vertical",
  theme_use = "theme_scop",
  theme_args = list(),
  combine = TRUE,
  nrow = NULL,
  ncol = NULL,
  byrow = TRUE,
  cores = 1,
  verbose = TRUE,
  seed = 11
)
Arguments
- srt
A Seurat object.
- lineages
A character vector specifying the lineages to plot.
- features
A character vector of features to use.
- group.by
Name of one or more meta.data columns to group (color) cells by.
- group_use
A character vector specifying groups from
group.byto keep. If bothgroup_useandcellsare provided, their intersection will be used. Default isNULL.- cells
A character vector of cell names to use. Default is
NULL.- layer
Which layer to use. Default is
"counts".- assay
Which assay to use. If
NULL, the default assay of the Seurat object will be used. When the object also containsChromatinAssay, the default assay and additionalChromatinAssaywill be preprocessed sequentially.- family
A character specifying the model used to calculate the dynamic features if needed. By default, this parameter is set to
NULL, and the appropriate family will be automatically determined.- exp_method
A character specifying the method to transform the expression values. Default is
"log1p"with options "log1p", "raw", "zscore", "fc", "log2fc".- lib_normalize
A boolean specifying whether to normalize the expression values using library size. Default the
layeris counts, this parameter is set toTRUE. Otherwise, it is set toFALSE.- libsize
A numeric vector specifying the library size for each cell. Default is
NULL.- compare_lineages
A boolean specifying whether to compare the lineages in the plot. Default is
TRUE.- compare_features
A boolean specifying whether to compare the features in the plot. Default is
FALSE.- add_line
A boolean specifying whether to add lines to the plot. Default is
TRUE.- add_interval
A boolean specifying whether to add confidence intervals to the plot. Default is
TRUE.- line.size
A numeric specifying the size of the lines. Default is
1.- line_palette
A character string specifying the name of the palette to use for the line colors. Default is
"Dark2".- line_palcolor
A vector specifying the colors to use for the line palette. Default is
NULL.- add_point
A boolean specifying whether to add points to the plot. Default is
TRUE.- pt.size
A numeric specifying the size of the points. Default is
1.- point_palette
A character string specifying the name of the palette to use for the point colors. Default is
"Chinese".- point_palcolor
A vector specifying the colors to use for the point palette. Default is
NULL.- add_rug
A boolean specifying whether to add rugs to the plot. Default is
TRUE.- flip
A boolean specifying whether to flip the x-axis. Default is
FALSE.- reverse
A boolean specifying whether to reverse the x-axis. Default is
FALSE.- x_order
A character specifying the order of the x-axis values. Default is
c("value", "rank").- aspect.ratio
Aspect ratio of the panel. Default is
NULL.- legend.position
The position of legends, one of
"none","left","right","bottom","top". Default is"right".- legend.direction
The direction of the legend in the plot. Can be one of
"vertical"or"horizontal".- theme_use
Theme used. Can be a character string or a theme function. Default is
"theme_scop".- theme_args
Other arguments passed to the
theme_use. Default islist().- combine
Combine plots into a single
patchworkobject. IfFALSE, return a list of ggplot objects.- nrow
Number of rows in the combined plot. Default is
NULL, which means determined automatically based on the number of plots.- ncol
Number of columns in the combined plot. Default is
NULL, which means determined automatically based on the number of plots.- byrow
Whether to arrange the plots by row in the combined plot. Default is
TRUE.- cores
Number of CPU cores used by supported preprocessing steps. Default is
1.- verbose
Whether to print the message. Default is
TRUE.- seed
Random seed for reproducibility. Default is
11.
Examples
data(pancreas_sub)
pancreas_sub <- standard_scop(pancreas_sub)
#> ℹ [2026-07-02 08:58:20] Start standard processing workflow...
#> ℹ [2026-07-02 08:58:21] Checking a list of <Seurat>...
#> ! [2026-07-02 08:58:21] Data 1/1 of the `srt_list` is "unknown"
#> ℹ [2026-07-02 08:58:21] Perform `NormalizeData()` with `normalization.method = 'LogNormalize'` on 1/1 of `srt_list`...
#> ℹ [2026-07-02 08:58:21] Perform `FindVariableFeatures()` on 1/1 of `srt_list`...
#> ℹ [2026-07-02 08:58:21] Use the separate HVF from `srt_list`
#> ℹ [2026-07-02 08:58:22] Number of available HVF: 2000
#> ℹ [2026-07-02 08:58:22] Finished check
#> ℹ [2026-07-02 08:58:22] Perform `ScaleData()`
#> ℹ [2026-07-02 08:58:22] Perform pca linear dimension reduction
#> ℹ [2026-07-02 08:58:22] Use stored estimated dimensions 1:23 for Standardpca
#> ℹ [2026-07-02 08:58:23] Perform `Seurat::FindClusters()` with `cluster_algorithm = 'louvain'` and `cluster_resolution = 0.6`
#> ℹ [2026-07-02 08:58:23] Reorder clusters...
#> ℹ [2026-07-02 08:58:23] Skip `log1p()` because `layer = data` is not "counts"
#> ℹ [2026-07-02 08:58:23] Perform umap nonlinear dimension reduction
#> ✔ [2026-07-02 08:58:29] Standard processing workflow completed
pancreas_sub <- RunSlingshot(
pancreas_sub,
group.by = "SubCellType",
reduction = "UMAP"
)
#> Warning: Removed 14 rows containing missing values or values outside the scale range
#> (`geom_path()`).
#> Warning: Removed 14 rows containing missing values or values outside the scale range
#> (`geom_path()`).
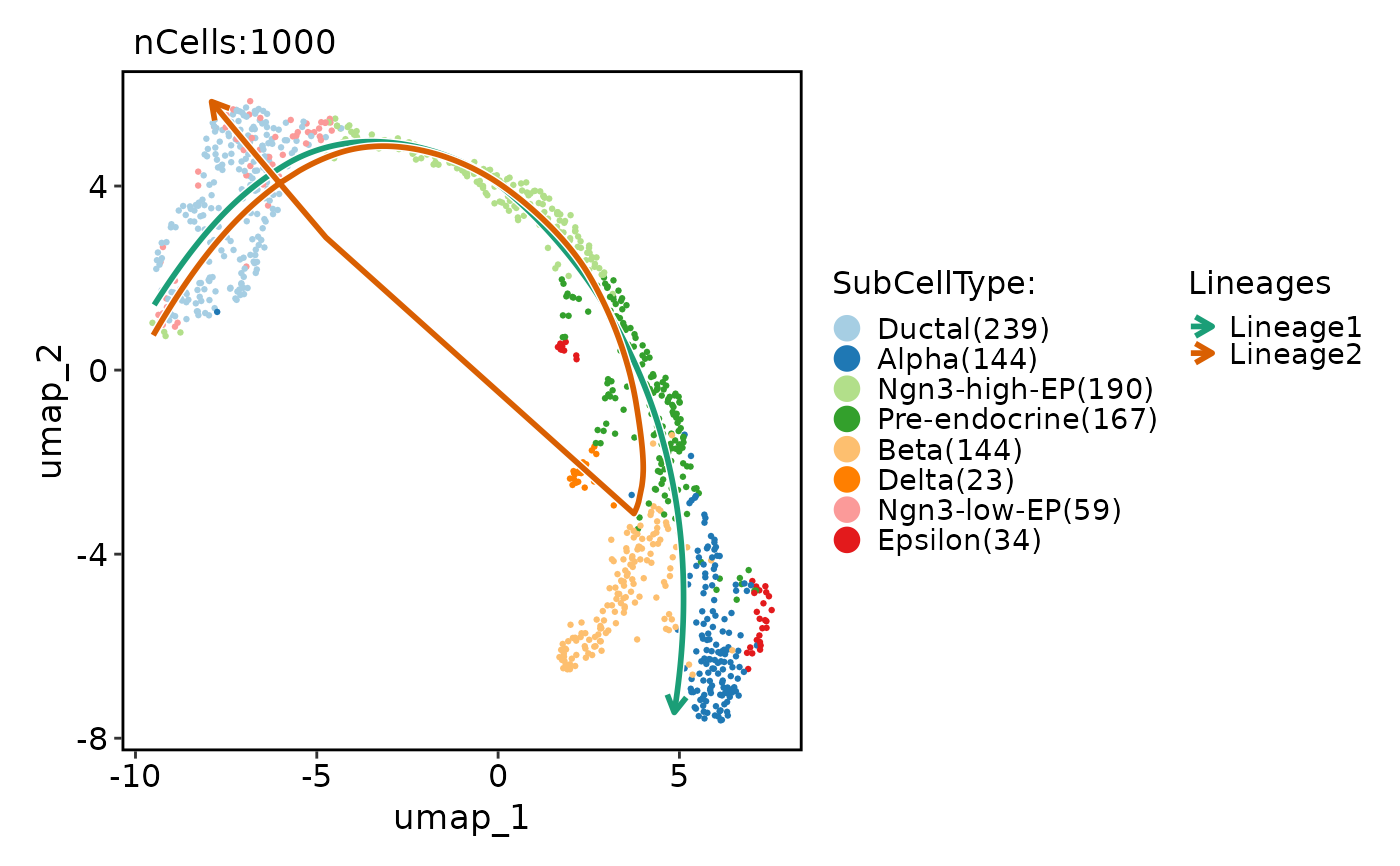 CellDimPlot(
pancreas_sub,
group.by = "SubCellType",
reduction = "UMAP",
lineages = paste0("Lineage", 1:2),
lineages_span = 0.1
)
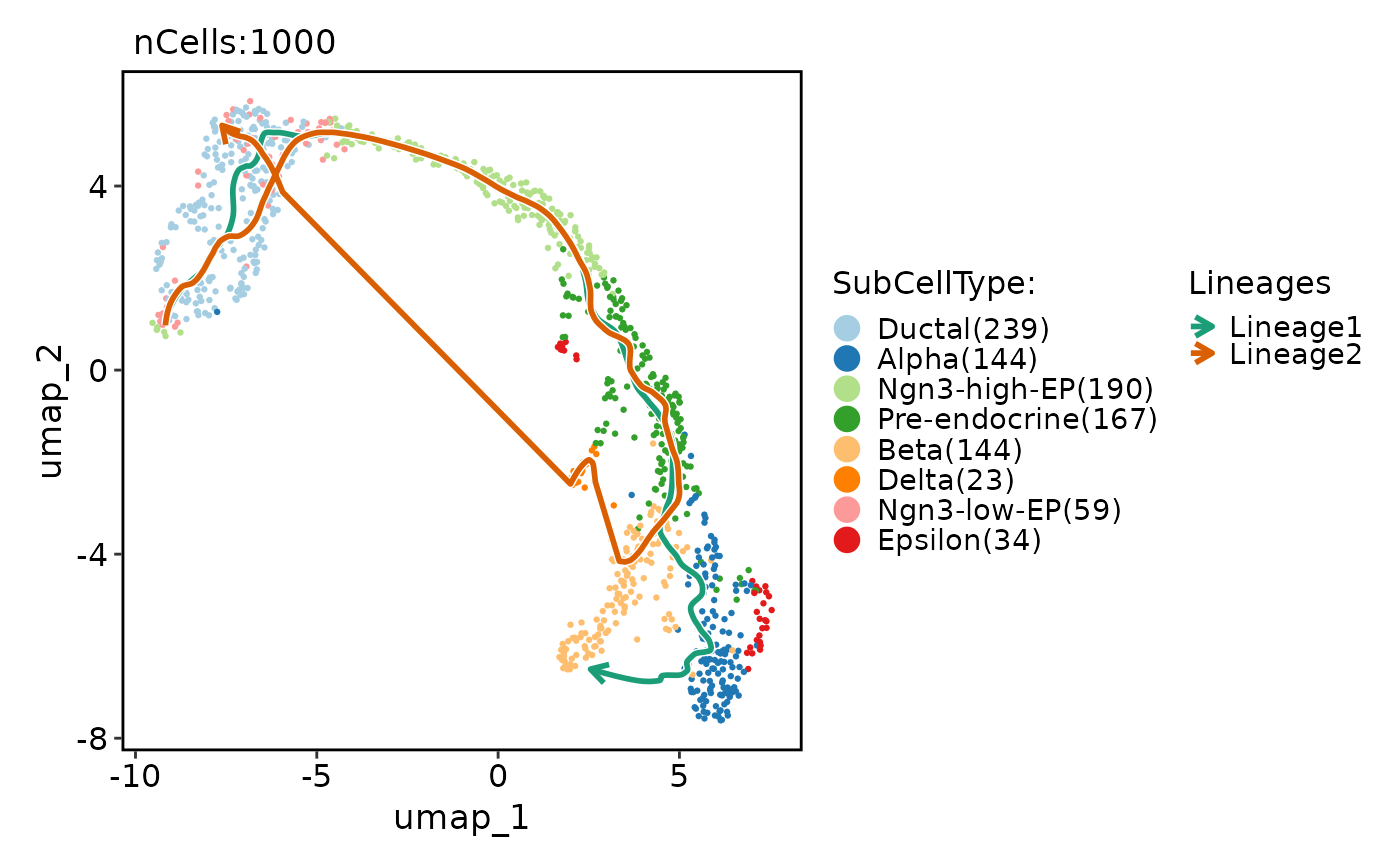
CellDimPlot(
pancreas_sub,
group.by = "SubCellType",
reduction = "UMAP",
lineages = paste0("Lineage", 1:2),
lineages_span = 0.1
)
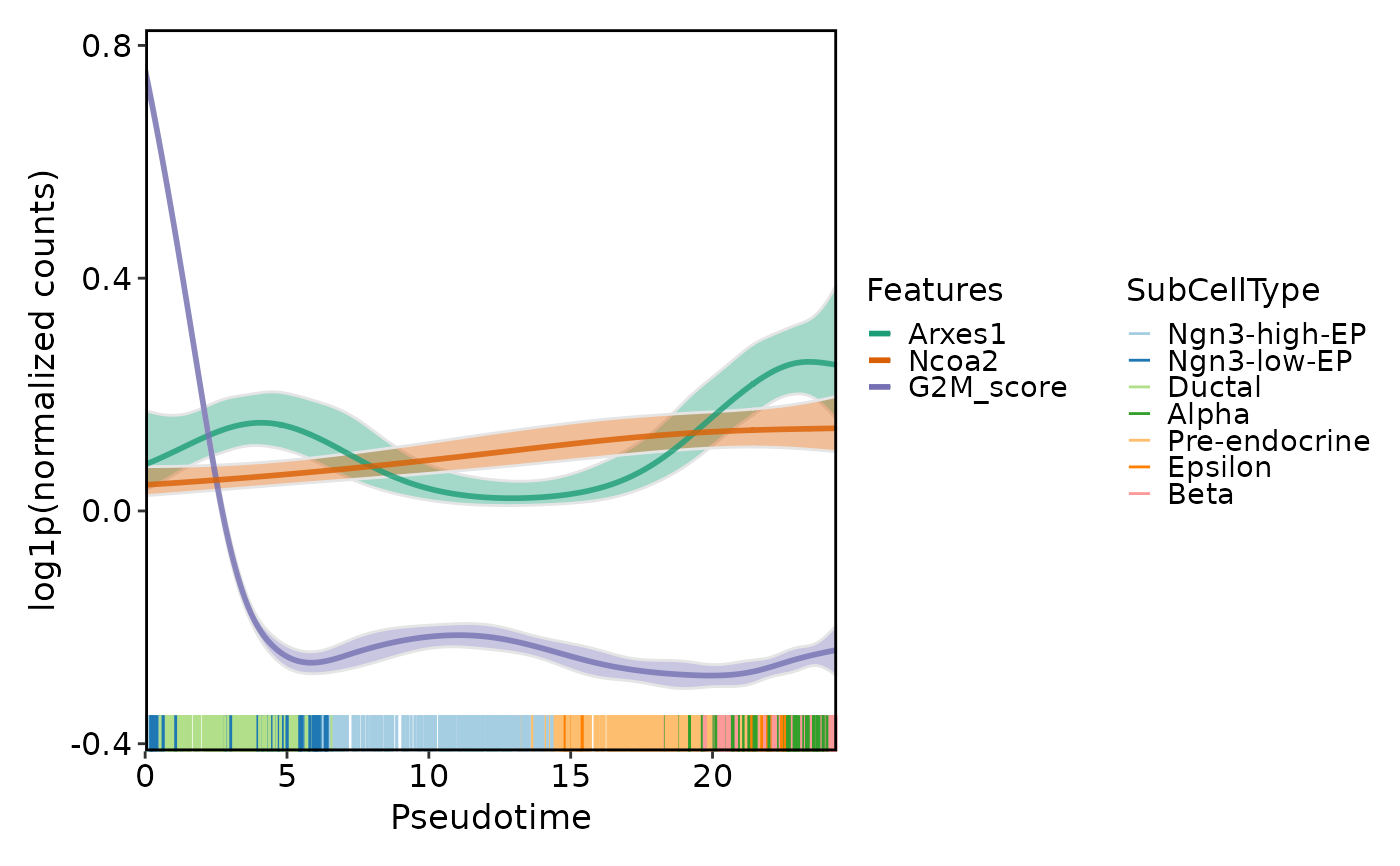
 DynamicPlot(
pancreas_sub,
lineages = "Lineage1",
features = c("Arxes1", "Ncoa2", "G2M_score"),
group.by = "SubCellType",
group_use = c("Ductal", "Beta"),
compare_features = TRUE
)
#> ℹ [2026-07-02 08:58:32] Start find dynamic features
#> ℹ [2026-07-02 08:58:33] Data type is raw counts
#> ℹ [2026-07-02 08:58:33] Number of candidate features (union): 3
#> ℹ [2026-07-02 08:58:34] Data type is raw counts
#> ! [2026-07-02 08:58:34] Negative values detected
#> ℹ [2026-07-02 08:58:34] Calculating dynamic features for "Lineage1"...
#> ℹ [2026-07-02 08:58:34] Using 1 core
#> ⠙ [2026-07-02 08:58:34] Running for Arxes1 [1/3] ■■■ 33% | ETA: 0s
#> ✔ [2026-07-02 08:58:34] Completed 3 tasks in 110ms
#>
#> ℹ [2026-07-02 08:58:34] Building results
#> ✔ [2026-07-02 08:58:34] Find dynamic features done
DynamicPlot(
pancreas_sub,
lineages = "Lineage1",
features = c("Arxes1", "Ncoa2", "G2M_score"),
group.by = "SubCellType",
group_use = c("Ductal", "Beta"),
compare_features = TRUE
)
#> ℹ [2026-07-02 08:58:32] Start find dynamic features
#> ℹ [2026-07-02 08:58:33] Data type is raw counts
#> ℹ [2026-07-02 08:58:33] Number of candidate features (union): 3
#> ℹ [2026-07-02 08:58:34] Data type is raw counts
#> ! [2026-07-02 08:58:34] Negative values detected
#> ℹ [2026-07-02 08:58:34] Calculating dynamic features for "Lineage1"...
#> ℹ [2026-07-02 08:58:34] Using 1 core
#> ⠙ [2026-07-02 08:58:34] Running for Arxes1 [1/3] ■■■ 33% | ETA: 0s
#> ✔ [2026-07-02 08:58:34] Completed 3 tasks in 110ms
#>
#> ℹ [2026-07-02 08:58:34] Building results
#> ✔ [2026-07-02 08:58:34] Find dynamic features done
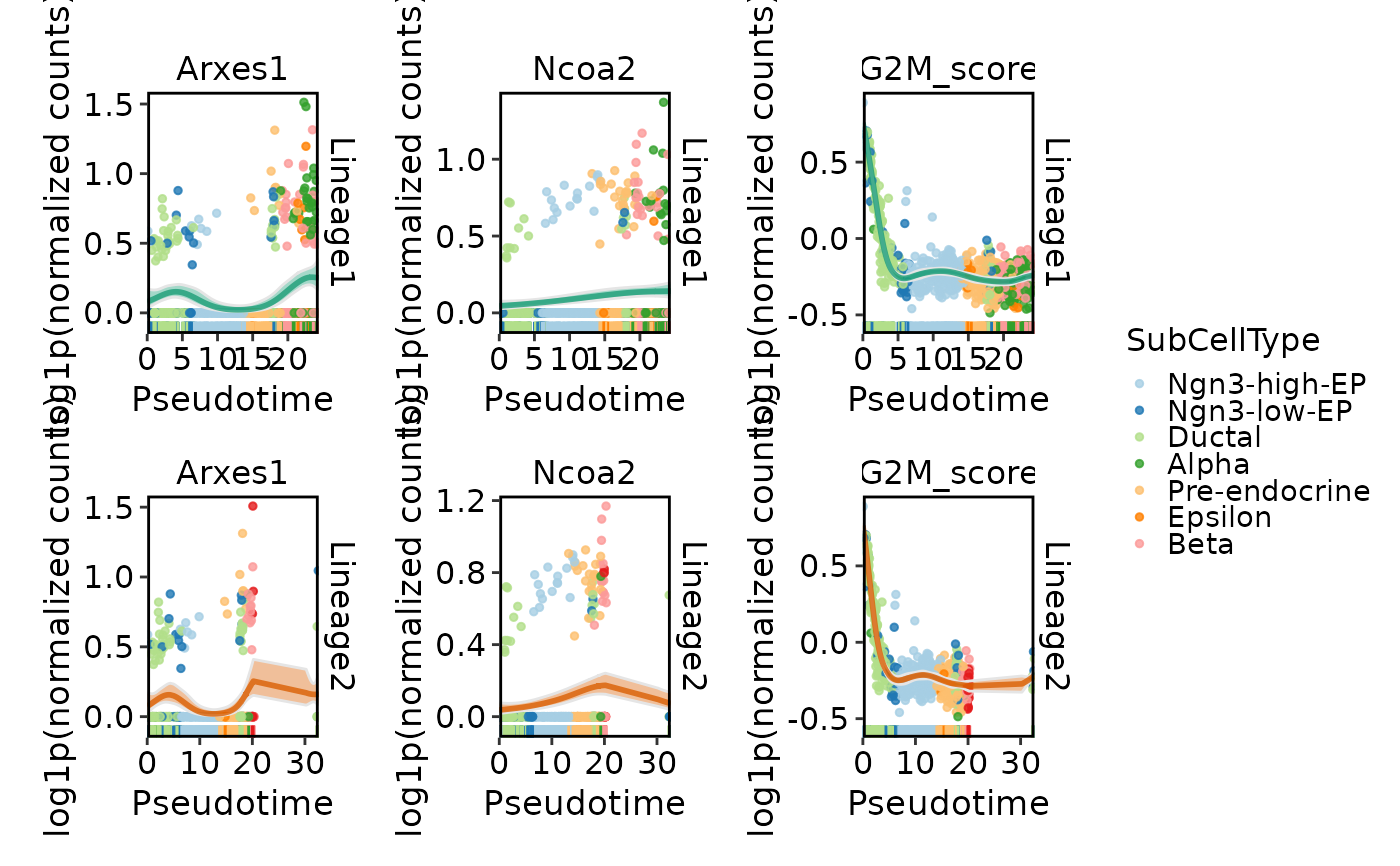
 DynamicPlot(
pancreas_sub,
lineages = c("Lineage1", "Lineage2"),
features = c("Arxes1", "Ncoa2", "G2M_score"),
group.by = "SubCellType",
compare_lineages = TRUE,
compare_features = FALSE
)
#> ℹ [2026-07-02 08:58:34] Start find dynamic features
#> ℹ [2026-07-02 08:58:36] Data type is raw counts
#> ℹ [2026-07-02 08:58:36] Number of candidate features (union): 3
#> ℹ [2026-07-02 08:58:36] Data type is raw counts
#> ! [2026-07-02 08:58:36] Negative values detected
#> ℹ [2026-07-02 08:58:36] Calculating dynamic features for "Lineage1"...
#> ℹ [2026-07-02 08:58:36] Using 1 core
#> ⠙ [2026-07-02 08:58:36] Running for Arxes1 [1/3] ■■■ 33% | ETA: 0s
#> ✔ [2026-07-02 08:58:36] Completed 3 tasks in 110ms
#>
#> ℹ [2026-07-02 08:58:36] Building results
#> ✔ [2026-07-02 08:58:37] Find dynamic features done
#> ℹ [2026-07-02 08:58:37] Start find dynamic features
#> ℹ [2026-07-02 08:58:38] Data type is raw counts
#> ℹ [2026-07-02 08:58:38] Number of candidate features (union): 3
#> ℹ [2026-07-02 08:58:39] Data type is raw counts
#> ! [2026-07-02 08:58:39] Negative values detected
#> ℹ [2026-07-02 08:58:39] Calculating dynamic features for "Lineage2"...
#> ℹ [2026-07-02 08:58:39] Using 1 core
#> ⠙ [2026-07-02 08:58:39] Running for Arxes1 [1/3] ■■■ 33% | ETA: 0s
#> ✔ [2026-07-02 08:58:39] Completed 3 tasks in 114ms
#>
#> ℹ [2026-07-02 08:58:39] Building results
#> ✔ [2026-07-02 08:58:39] Find dynamic features done
#> Warning: No shared levels found between `names(values)` of the manual scale and the
#> data's fill values.
#> Warning: No shared levels found between `names(values)` of the manual scale and the
#> data's fill values.
#> Warning: No shared levels found between `names(values)` of the manual scale and the
#> data's fill values.
#> Warning: No shared levels found between `names(values)` of the manual scale and the
#> data's fill values.
DynamicPlot(
pancreas_sub,
lineages = c("Lineage1", "Lineage2"),
features = c("Arxes1", "Ncoa2", "G2M_score"),
group.by = "SubCellType",
compare_lineages = TRUE,
compare_features = FALSE
)
#> ℹ [2026-07-02 08:58:34] Start find dynamic features
#> ℹ [2026-07-02 08:58:36] Data type is raw counts
#> ℹ [2026-07-02 08:58:36] Number of candidate features (union): 3
#> ℹ [2026-07-02 08:58:36] Data type is raw counts
#> ! [2026-07-02 08:58:36] Negative values detected
#> ℹ [2026-07-02 08:58:36] Calculating dynamic features for "Lineage1"...
#> ℹ [2026-07-02 08:58:36] Using 1 core
#> ⠙ [2026-07-02 08:58:36] Running for Arxes1 [1/3] ■■■ 33% | ETA: 0s
#> ✔ [2026-07-02 08:58:36] Completed 3 tasks in 110ms
#>
#> ℹ [2026-07-02 08:58:36] Building results
#> ✔ [2026-07-02 08:58:37] Find dynamic features done
#> ℹ [2026-07-02 08:58:37] Start find dynamic features
#> ℹ [2026-07-02 08:58:38] Data type is raw counts
#> ℹ [2026-07-02 08:58:38] Number of candidate features (union): 3
#> ℹ [2026-07-02 08:58:39] Data type is raw counts
#> ! [2026-07-02 08:58:39] Negative values detected
#> ℹ [2026-07-02 08:58:39] Calculating dynamic features for "Lineage2"...
#> ℹ [2026-07-02 08:58:39] Using 1 core
#> ⠙ [2026-07-02 08:58:39] Running for Arxes1 [1/3] ■■■ 33% | ETA: 0s
#> ✔ [2026-07-02 08:58:39] Completed 3 tasks in 114ms
#>
#> ℹ [2026-07-02 08:58:39] Building results
#> ✔ [2026-07-02 08:58:39] Find dynamic features done
#> Warning: No shared levels found between `names(values)` of the manual scale and the
#> data's fill values.
#> Warning: No shared levels found between `names(values)` of the manual scale and the
#> data's fill values.
#> Warning: No shared levels found between `names(values)` of the manual scale and the
#> data's fill values.
#> Warning: No shared levels found between `names(values)` of the manual scale and the
#> data's fill values.
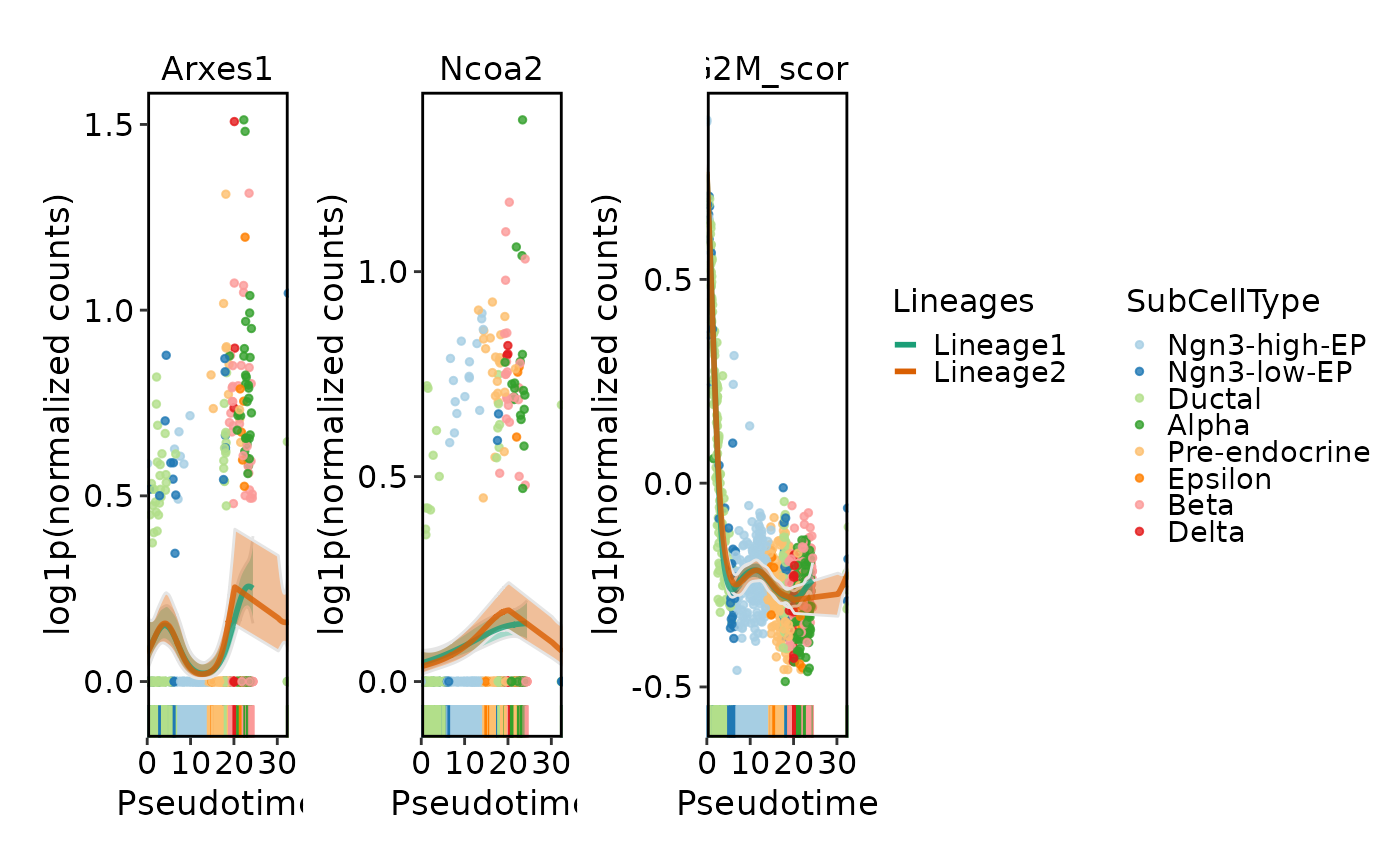 DynamicPlot(
pancreas_sub,
lineages = c("Lineage1", "Lineage2"),
features = c("Arxes1", "Ncoa2", "G2M_score"),
group.by = "SubCellType",
compare_lineages = FALSE,
compare_features = FALSE
)
#> ℹ [2026-07-02 08:58:40] Start find dynamic features
#> ℹ [2026-07-02 08:58:42] Data type is raw counts
#> ℹ [2026-07-02 08:58:42] Number of candidate features (union): 3
#> ℹ [2026-07-02 08:58:42] Data type is raw counts
#> ! [2026-07-02 08:58:42] Negative values detected
#> ℹ [2026-07-02 08:58:42] Calculating dynamic features for "Lineage1"...
#> ℹ [2026-07-02 08:58:42] Using 1 core
#> ⠙ [2026-07-02 08:58:42] Running for Arxes1 [1/3] ■■■ 33% | ETA: 0s
#> ✔ [2026-07-02 08:58:42] Completed 3 tasks in 112ms
#>
#> ℹ [2026-07-02 08:58:42] Building results
#> ✔ [2026-07-02 08:58:43] Find dynamic features done
#> ℹ [2026-07-02 08:58:43] Start find dynamic features
#> ℹ [2026-07-02 08:58:44] Data type is raw counts
#> ℹ [2026-07-02 08:58:44] Number of candidate features (union): 3
#> ℹ [2026-07-02 08:58:45] Data type is raw counts
#> ! [2026-07-02 08:58:45] Negative values detected
#> ℹ [2026-07-02 08:58:45] Calculating dynamic features for "Lineage2"...
#> ℹ [2026-07-02 08:58:45] Using 1 core
#> ⠙ [2026-07-02 08:58:45] Running for Arxes1 [1/3] ■■■ 33% | ETA: 0s
#> ✔ [2026-07-02 08:58:45] Completed 3 tasks in 117ms
#>
#> ℹ [2026-07-02 08:58:45] Building results
#> ✔ [2026-07-02 08:58:45] Find dynamic features done
#> Warning: No shared levels found between `names(values)` of the manual scale and the
#> data's fill values.
#> Warning: No shared levels found between `names(values)` of the manual scale and the
#> data's fill values.
#> Warning: No shared levels found between `names(values)` of the manual scale and the
#> data's fill values.
#> Warning: No shared levels found between `names(values)` of the manual scale and the
#> data's fill values.
#> Warning: No shared levels found between `names(values)` of the manual scale and the
#> data's fill values.
#> Warning: No shared levels found between `names(values)` of the manual scale and the
#> data's fill values.
#> Warning: No shared levels found between `names(values)` of the manual scale and the
#> data's fill values.
DynamicPlot(
pancreas_sub,
lineages = c("Lineage1", "Lineage2"),
features = c("Arxes1", "Ncoa2", "G2M_score"),
group.by = "SubCellType",
compare_lineages = FALSE,
compare_features = FALSE
)
#> ℹ [2026-07-02 08:58:40] Start find dynamic features
#> ℹ [2026-07-02 08:58:42] Data type is raw counts
#> ℹ [2026-07-02 08:58:42] Number of candidate features (union): 3
#> ℹ [2026-07-02 08:58:42] Data type is raw counts
#> ! [2026-07-02 08:58:42] Negative values detected
#> ℹ [2026-07-02 08:58:42] Calculating dynamic features for "Lineage1"...
#> ℹ [2026-07-02 08:58:42] Using 1 core
#> ⠙ [2026-07-02 08:58:42] Running for Arxes1 [1/3] ■■■ 33% | ETA: 0s
#> ✔ [2026-07-02 08:58:42] Completed 3 tasks in 112ms
#>
#> ℹ [2026-07-02 08:58:42] Building results
#> ✔ [2026-07-02 08:58:43] Find dynamic features done
#> ℹ [2026-07-02 08:58:43] Start find dynamic features
#> ℹ [2026-07-02 08:58:44] Data type is raw counts
#> ℹ [2026-07-02 08:58:44] Number of candidate features (union): 3
#> ℹ [2026-07-02 08:58:45] Data type is raw counts
#> ! [2026-07-02 08:58:45] Negative values detected
#> ℹ [2026-07-02 08:58:45] Calculating dynamic features for "Lineage2"...
#> ℹ [2026-07-02 08:58:45] Using 1 core
#> ⠙ [2026-07-02 08:58:45] Running for Arxes1 [1/3] ■■■ 33% | ETA: 0s
#> ✔ [2026-07-02 08:58:45] Completed 3 tasks in 117ms
#>
#> ℹ [2026-07-02 08:58:45] Building results
#> ✔ [2026-07-02 08:58:45] Find dynamic features done
#> Warning: No shared levels found between `names(values)` of the manual scale and the
#> data's fill values.
#> Warning: No shared levels found between `names(values)` of the manual scale and the
#> data's fill values.
#> Warning: No shared levels found between `names(values)` of the manual scale and the
#> data's fill values.
#> Warning: No shared levels found between `names(values)` of the manual scale and the
#> data's fill values.
#> Warning: No shared levels found between `names(values)` of the manual scale and the
#> data's fill values.
#> Warning: No shared levels found between `names(values)` of the manual scale and the
#> data's fill values.
#> Warning: No shared levels found between `names(values)` of the manual scale and the
#> data's fill values.