RunSlingshot
Usage
RunSlingshot(
  srt,
  group.by,
  reduction = NULL,
  dims = NULL,
  start = NULL,
  end = NULL,
  prefix = NULL,
  reverse = FALSE,
  align_start = FALSE,
  show_plot = TRUE,
  lineage_palette = "Dark2",
  seed = 11,
  ...,
  verbose = TRUE
)
Arguments
- srt
A Seurat object.
- group.by
Name of one or more meta.data columns to group (color) cells by.
- reduction
Which dimensionality reduction to use. If not specified, will use the reduction returned by DefaultReduction.
- dims
The dimensions to use for the Slingshot algorithm. Default is
NULL, which uses first two dimensions.- start
The starting group for the Slingshot algorithm. Default is
NULL.- end
The ending group for the Slingshot algorithm. Default is
NULL.- prefix
The prefix to add to the column names of the resulting pseudotime variable. Default is
NULL.- reverse
Logical value indicating whether to reverse the pseudotime variable. Default is
FALSE.- align_start
Logical value indicating whether to align the starting pseudotime values at the maximum pseudotime. Default is
FALSE.- show_plot
Logical value indicating whether to show the dimensionality plot. Default is
TRUE.- lineage_palette
The color palette to use for the lineages in the plot. Default is
"Dark2".- seed
Random seed for reproducibility. Default is
11.- ...
Additional arguments to be passed to the slingshot::slingshot function.
- verbose
Whether to print the message. Default is
TRUE.
Examples
data(pancreas_sub)
pancreas_sub <- standard_scop(pancreas_sub)
#> ℹ [2026-07-02 10:06:27] Start standard processing workflow...
#> ℹ [2026-07-02 10:06:28] Checking a list of <Seurat>...
#> ! [2026-07-02 10:06:28] Data 1/1 of the `srt_list` is "unknown"
#> ℹ [2026-07-02 10:06:28] Perform `NormalizeData()` with `normalization.method = 'LogNormalize'` on 1/1 of `srt_list`...
#> ℹ [2026-07-02 10:06:28] Perform `FindVariableFeatures()` on 1/1 of `srt_list`...
#> ℹ [2026-07-02 10:06:28] Use the separate HVF from `srt_list`
#> ℹ [2026-07-02 10:06:29] Number of available HVF: 2000
#> ℹ [2026-07-02 10:06:29] Finished check
#> ℹ [2026-07-02 10:06:29] Perform `ScaleData()`
#> ℹ [2026-07-02 10:06:29] Perform pca linear dimension reduction
#> ℹ [2026-07-02 10:06:30] Use stored estimated dimensions 1:23 for Standardpca
#> ℹ [2026-07-02 10:06:30] Perform `Seurat::FindClusters()` with `cluster_algorithm = 'louvain'` and `cluster_resolution = 0.6`
#> ℹ [2026-07-02 10:06:30] Reorder clusters...
#> ℹ [2026-07-02 10:06:30] Skip `log1p()` because `layer = data` is not "counts"
#> ℹ [2026-07-02 10:06:30] Perform umap nonlinear dimension reduction
#> ✔ [2026-07-02 10:06:37] Standard processing workflow completed
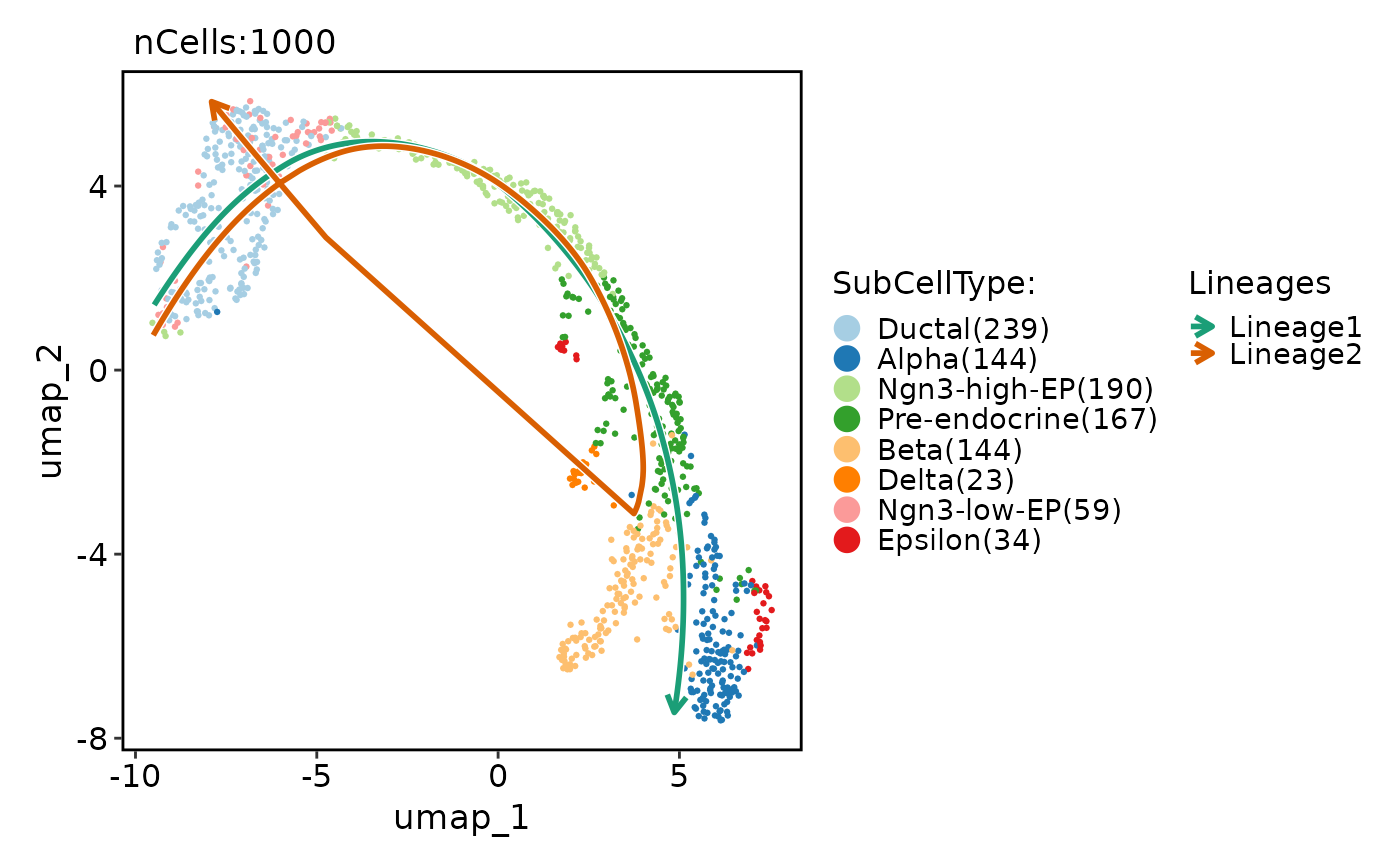
pancreas_sub <- RunSlingshot(
pancreas_sub,
group.by = "SubCellType",
reduction = "UMAP"
)
#> Warning: Removed 14 rows containing missing values or values outside the scale range
#> (`geom_path()`).
#> Warning: Removed 14 rows containing missing values or values outside the scale range
#> (`geom_path()`).
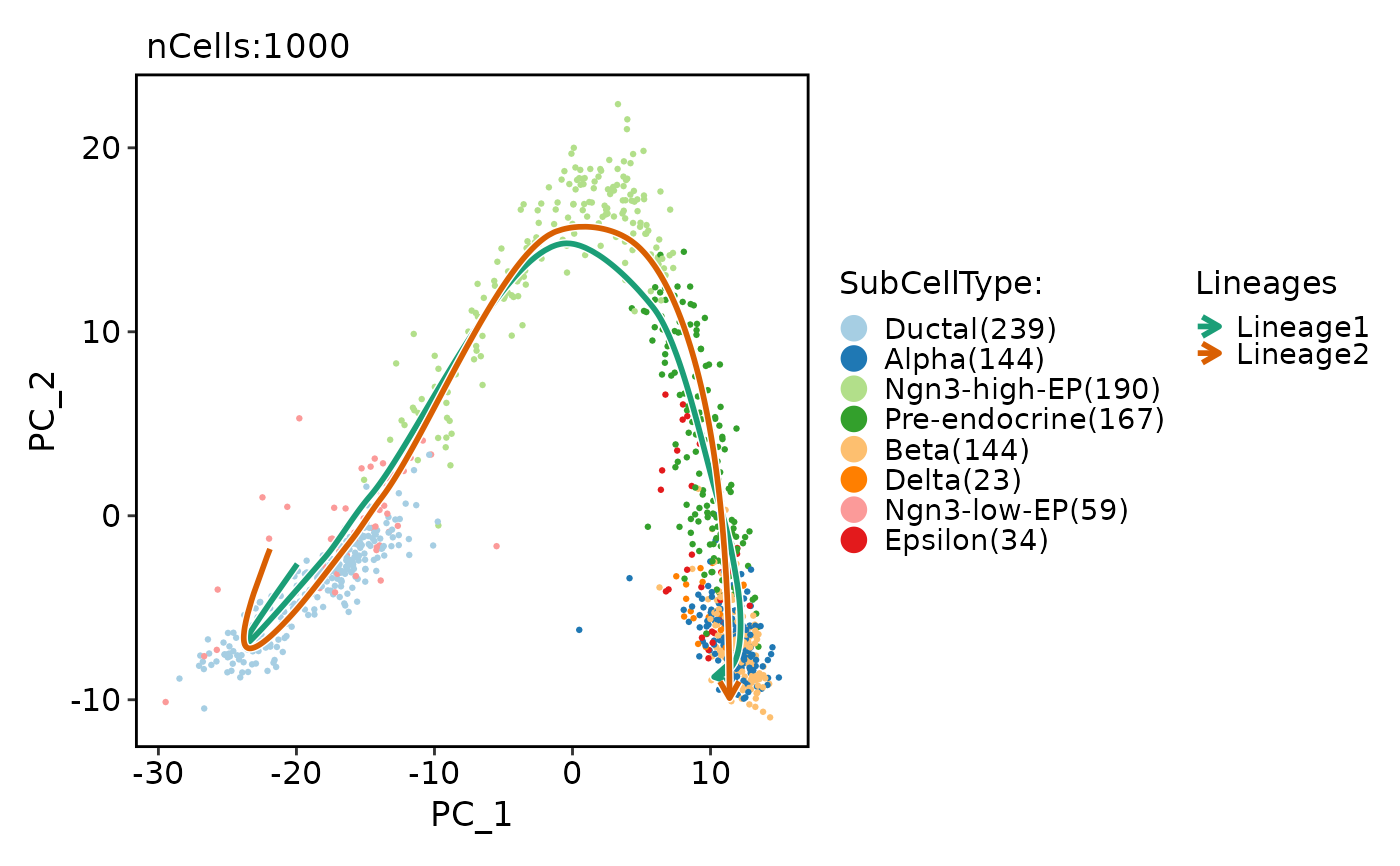
 pancreas_sub <- RunSlingshot(
pancreas_sub,
group.by = "SubCellType",
reduction = "PCA"
)
#> Warning: Removed 11 rows containing missing values or values outside the scale range
#> (`geom_path()`).
#> Warning: Removed 11 rows containing missing values or values outside the scale range
#> (`geom_path()`).
pancreas_sub <- RunSlingshot(
pancreas_sub,
group.by = "SubCellType",
reduction = "PCA"
)
#> Warning: Removed 11 rows containing missing values or values outside the scale range
#> (`geom_path()`).
#> Warning: Removed 11 rows containing missing values or values outside the scale range
#> (`geom_path()`).
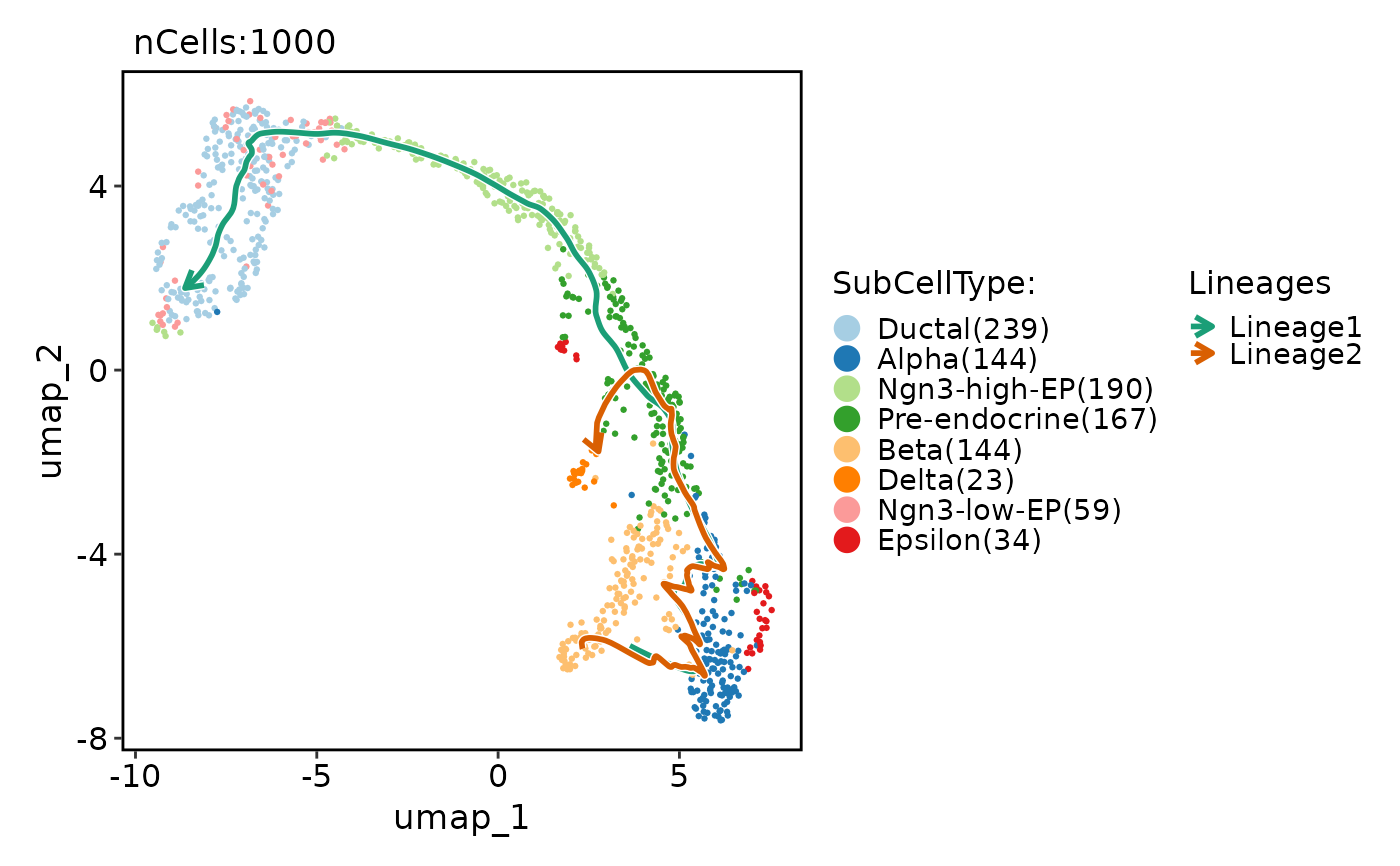
 CellDimPlot(
pancreas_sub,
group.by = "SubCellType",
reduction = "UMAP",
lineages = paste0("Lineage", 1:2),
lineages_span = 0.1
)
CellDimPlot(
pancreas_sub,
group.by = "SubCellType",
reduction = "UMAP",
lineages = paste0("Lineage", 1:2),
lineages_span = 0.1
)
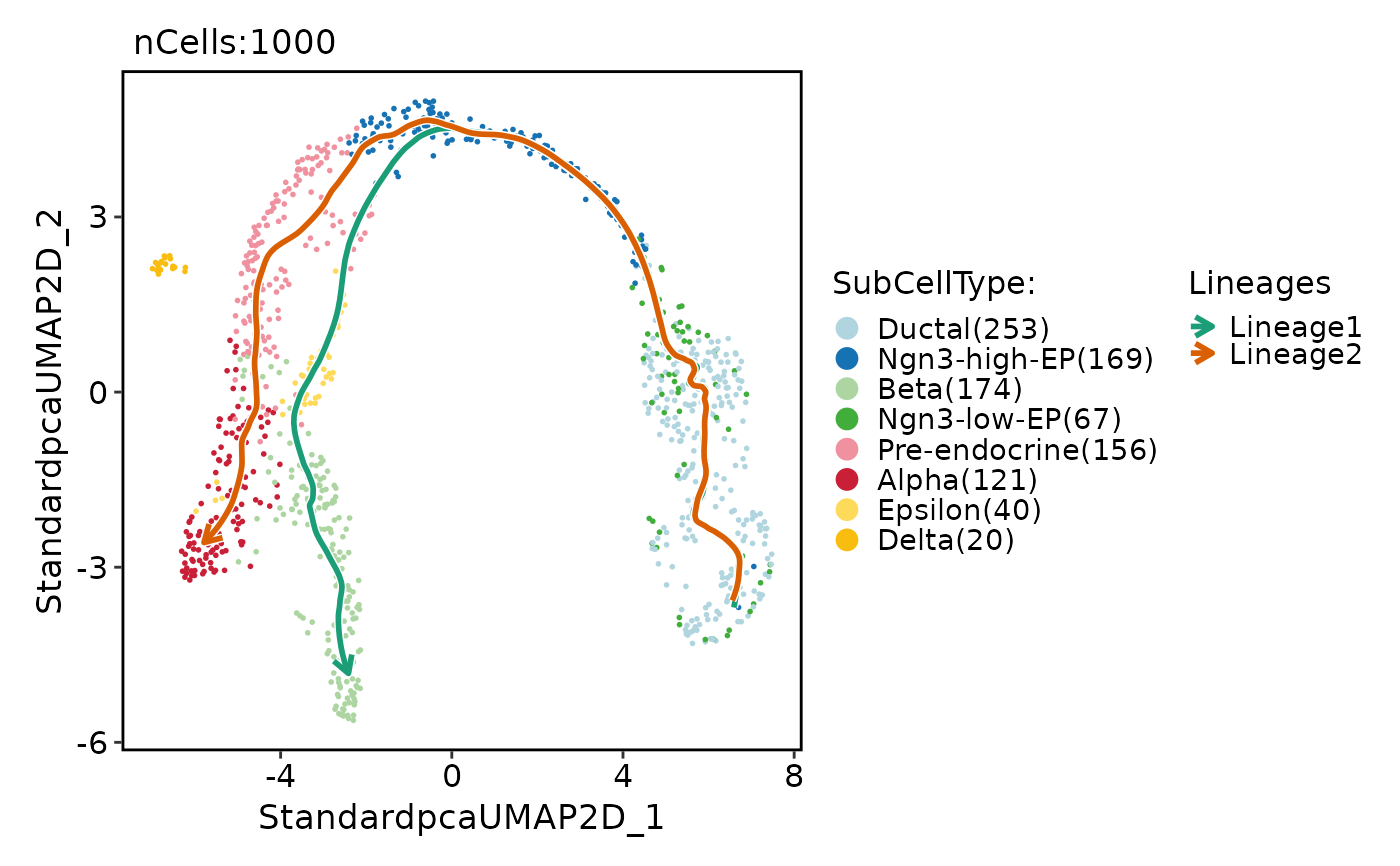
 # 3D lineage
pancreas_sub <- RunSlingshot(
pancreas_sub,
group.by = "SubCellType",
reduction = "StandardpcaUMAP3D"
)
#> Warning: Removed 14 rows containing missing values or values outside the scale range
#> (`geom_path()`).
#> Warning: Removed 14 rows containing missing values or values outside the scale range
#> (`geom_path()`).
# 3D lineage
pancreas_sub <- RunSlingshot(
pancreas_sub,
group.by = "SubCellType",
reduction = "StandardpcaUMAP3D"
)
#> Warning: Removed 14 rows containing missing values or values outside the scale range
#> (`geom_path()`).
#> Warning: Removed 14 rows containing missing values or values outside the scale range
#> (`geom_path()`).
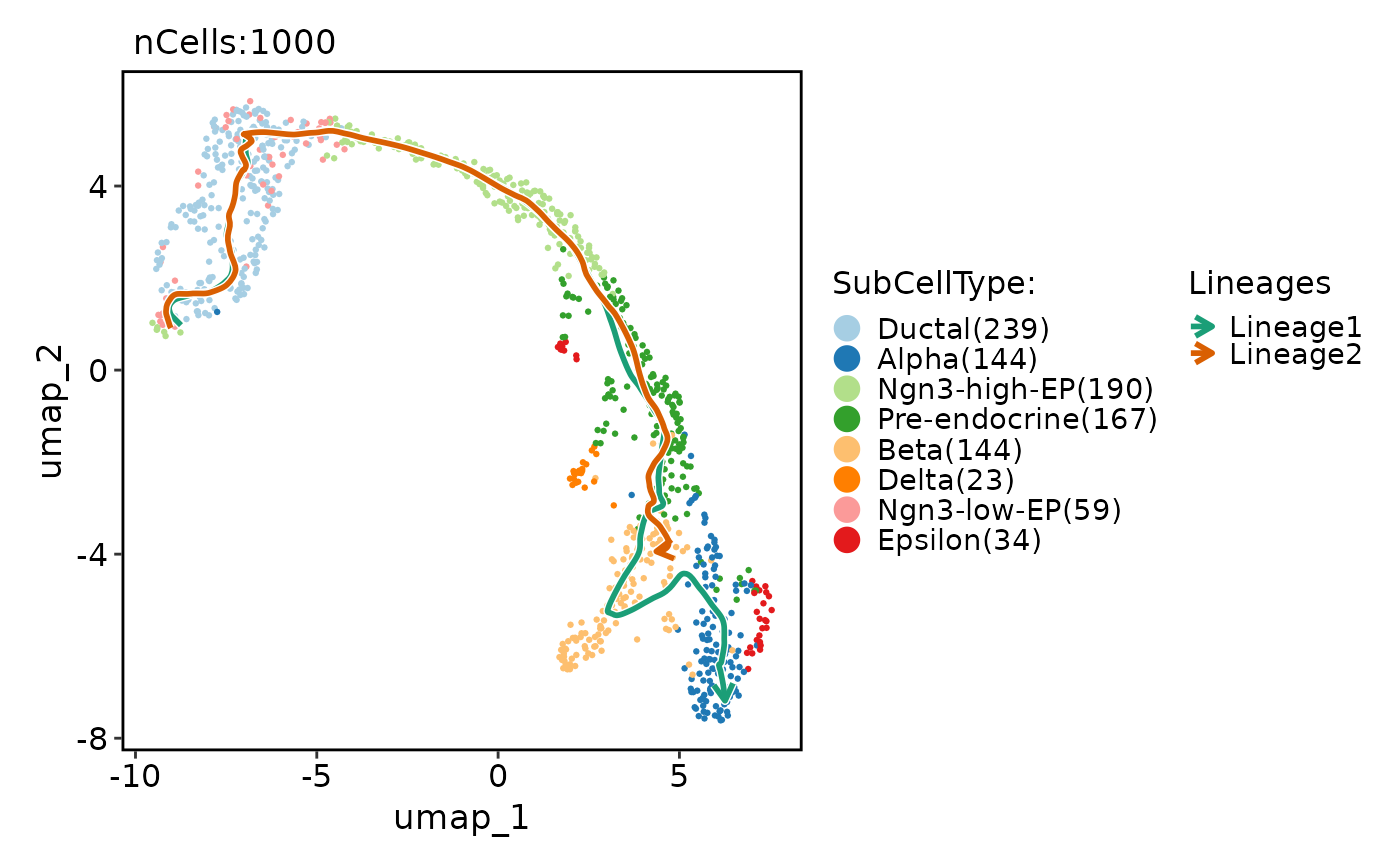
 CellDimPlot(
pancreas_sub,
group.by = "SubCellType",
reduction = "UMAP",
lineages = paste0("Lineage", 1:2),
lineages_span = 0.1,
lineages_trim = c(0.05, 0.95)
)
CellDimPlot(
pancreas_sub,
group.by = "SubCellType",
reduction = "UMAP",
lineages = paste0("Lineage", 1:2),
lineages_span = 0.1,
lineages_trim = c(0.05, 0.95)
)