Heatmap plot for dynamic features along lineages
Usage
DynamicHeatmap(
  srt,
  lineages,
  features = NULL,
  use_fitted = FALSE,
  border = TRUE,
  heatmap_border = NULL,
  cell_annotation_border = NULL,
  feature_annotation_border = NULL,
  heatmap_border_palcolor = "black",
  cell_annotation_border_palcolor = "black",
  feature_annotation_border_palcolor = "black",
  heatmap_border_size = 1,
  cell_annotation_border_size = 1,
  feature_annotation_border_size = 1,
  flip = FALSE,
  min_expcells = 20,
  r.sq = 0.2,
  dev.expl = 0.2,
  padjust = 0.05,
  num_intersections = NULL,
  cell_density = 1,
  cell_bins = 100,
  order_by = c("peaktime", "valleytime"),
  layer = "counts",
  assay = NULL,
  exp_method = c("zscore", "raw", "fc", "log2fc", "log1p"),
  exp_legend_title = NULL,
  limits = NULL,
  lib_normalize = identical(layer, "counts"),
  libsize = NULL,
  family = NULL,
  suffix = lineages,
  n_candidates = 1000,
  minfreq = 5,
  fit_method = c("gam", "pretsa"),
  knot = 0,
  max_knot_allowed = 10,
  padjust_method = "fdr",
  cluster_features_by = NULL,
  cluster_rows = FALSE,
  cluster_row_slices = FALSE,
  cluster_columns = FALSE,
  cluster_column_slices = FALSE,
  show_row_names = FALSE,
  show_column_names = FALSE,
  row_names_side = ifelse(flip, "left", "right"),
  column_names_side = ifelse(flip, "bottom", "top"),
  row_names_rot = 0,
  column_names_rot = 90,
  row_title = NULL,
  column_title = NULL,
  row_title_side = "left",
  column_title_side = "top",
  row_title_rot = 0,
  column_title_rot = ifelse(flip, 90, 0),
  feature_split = NULL,
  feature_split_by = NULL,
  n_split = NULL,
  split_order = NULL,
  split_method = c("mfuzz", "kmeans", "kmeans-peaktime", "hclust", "hclust-peaktime"),
  decreasing = FALSE,
  fuzzification = NULL,
  anno_terms = FALSE,
  anno_keys = FALSE,
  anno_features = FALSE,
  terms_width = grid::unit(4, "in"),
  terms_fontsize = 8,
  terms_stat = "none",
  terms_stat_digits = 2,
  terms_stat_test = TRUE,
  keys_width = grid::unit(2, "in"),
  keys_fontsize = c(6, 10),
  features_width = grid::unit(2, "in"),
  features_fontsize = c(6, 10),
  IDtype = "symbol",
  species = "Homo_sapiens",
  db_update = FALSE,
  db_version = "latest",
  db_combine = FALSE,
  convert_species = FALSE,
  Ensembl_version = NULL,
  mirror = NULL,
  db = "GO_BP",
  TERM2GENE = NULL,
  TERM2NAME = NULL,
  minGSSize = 10,
  maxGSSize = 500,
  GO_simplify = FALSE,
  GO_simplify_cutoff = "p.adjust < 0.05",
  simplify_method = "Wang",
  simplify_similarityCutoff = 0.7,
  pvalueCutoff = NULL,
  padjustCutoff = 0.05,
  topTerm = 5,
  show_termid = FALSE,
  topWord = 20,
  words_excluded = NULL,
  nlabel = 20,
  features_label = NULL,
  label_size = 10,
  label_color = "black",
  pseudotime_label = NULL,
  pseudotime_label_color = "black",
  pseudotime_label_linetype = 2,
  pseudotime_label_linewidth = 3,
  heatmap_palette = "viridis",
  heatmap_palcolor = NULL,
  pseudotime_palette = "cividis",
  pseudotime_palcolor = NULL,
  feature_split_palette = "simspec",
  feature_split_palcolor = NULL,
  cell_annotation = NULL,
  cell_annotation_palette = "Chinese",
  cell_annotation_palcolor = NULL,
  cell_annotation_params = if (flip) {
     list(width = grid::unit(5, "mm"))
 } else {

       list(height = grid::unit(5, "mm"))
 },
  feature_annotation = NULL,
  feature_annotation_palette = "Dark2",
  feature_annotation_palcolor = NULL,
  feature_annotation_params = if (flip) {
     list(height = grid::unit(5, "mm"))
 } else
    {
     list(width = grid::unit(5, "mm"))
 },
  separate_annotation = NULL,
  separate_annotation_palette = "Chinese",
  separate_annotation_palcolor = NULL,
  separate_annotation_params = if (flip) {
     list(width = grid::unit(10, "mm"))
 }
    else {
     list(height = grid::unit(10, "mm"))
 },
  reverse_ht = NULL,
  use_raster = NULL,
  raster_device = "png",
  raster_by_magick = TRUE,
  height = NULL,
  width = NULL,
  units = "inch",
  cores = 1,
  verbose = TRUE,
  seed = 11,
  legend.position = "right",
  ht_params = list(),
  ...
)
Arguments
- srt
A Seurat object.
- lineages
A character vector specifying the lineage names for which dynamic features should be calculated.
- features
A character vector specifying the features to plot. By default, this parameter is set to NULL, and the dynamic features will be determined by the parameters
min_expcells,r.sq,dev.expl,padjustandnum_intersections.- use_fitted
Whether to use fitted values. Default is
FALSE.- border
Whether to add borders to the heatmap body and annotations. Kept for backward compatibility. The more specific
heatmap_border,cell_annotation_border, andfeature_annotation_borderarguments inherit from this value when left asNULL.- heatmap_border, cell_annotation_border, feature_annotation_border
Whether to draw borders for the heatmap body, cell annotations, and feature annotations, respectively. Defaults inherit from
border.- heatmap_border_palcolor, cell_annotation_border_palcolor, feature_annotation_border_palcolor
Border colors for the heatmap body, cell annotations, and feature annotations when their matching border argument is
TRUE. Default is"black".- heatmap_border_size, cell_annotation_border_size, feature_annotation_border_size
Border line widths for the heatmap body, cell annotations, and feature annotations when their matching border argument is
TRUE. Default is1.- flip
Whether to flip the heatmap. Default is
FALSE.- min_expcells
The minimum number of expected cells. Default is
20.- r.sq
The R-squared threshold. Default is
0.2.- dev.expl
The deviance explained threshold. Default is
0.2.- padjust
The p-value adjustment threshold. Default is
0.05.- num_intersections
This parameter is a numeric vector used to determine the number of intersections among lineages. It helps in selecting which dynamic features will be used. By default, when this parameter is set to
NULL, all dynamic features that pass the specified threshold will be used for each lineage.- cell_density
The cell density within each cell bin. By default, this parameter is set to
1, which means that all cells will be included within each cell bin.- cell_bins
The number of cell bins. Default is
100.- order_by
The order of the heatmap. Default is
"peaktime".- layer
Which layer to use. Default is
"counts".- assay
Which assay to use. If
NULL, the default assay of the Seurat object will be used. When the object also containsChromatinAssay, the default assay and additionalChromatinAssaywill be preprocessed sequentially.- exp_method
A character vector specifying the method for calculating expression values. Options are
"zscore","raw","fc","log2fc", or"log1p". Default is"zscore".- exp_legend_title
A character vector specifying the title for the legend of expression value. Default is
NULL.- limits
A two-length numeric vector specifying the limits for the color scale. Default is
NULL.- lib_normalize
Whether to normalize the data by library size.
- libsize
A numeric vector specifying the library size for each cell. Default is
NULL.- family
A character or character vector specifying the family of distributions to use for the GAM. If family is set to NULL, the appropriate family will be automatically determined based on the data. If length(family) is 1, the same family will be used for all features. Otherwise, family must have the same length as features.
- suffix
A character vector specifying the suffix to append to the output layer names for each lineage. Default is the lineage names.
- n_candidates
A number of candidate features to select when features is
NULL. Default is1000.- minfreq
An integer specifying the minimum frequency threshold for candidate features. Features with a frequency less than minfreq will be excluded. Default is
5.- fit_method
The method used for fitting features. Either
"gam"(generalized additive models) or"pretsa"(Pattern recognition in Temporal and Spatial Analyses). Default is"gam".- knot
For
fit_method = "pretsa": B-spline knots.0or"auto". Default is0.- max_knot_allowed
For
fit_method = "pretsa"whenknot = "auto": max knots. Default is10.- padjust_method
The method used for p-value adjustment. Default is
"fdr".- cluster_features_by
Which lineage to use when clustering features. By default, this parameter is set to
NULL, which means that all lineages will be used.- cluster_rows
Whether to cluster rows in the heatmap. Default is
FALSE.- cluster_row_slices
Whether to cluster row slices in the heatmap. Default is
FALSE.- cluster_columns
Whether to cluster columns in the heatmap. Default is
FALSE.- cluster_column_slices
Whether to cluster column slices in the heatmap. Default is
FALSE.- show_row_names
Whether to show row names in the heatmap. Default is
FALSE.- show_column_names
Whether to show column names in the heatmap. Default is
FALSE.- row_names_side
A character vector specifying the side to place row names.
- column_names_side
A character vector specifying the side to place column names.
- row_names_rot
The rotation angle for row names. Default is
0.- column_names_rot
The rotation angle for column names. Default is
90.- row_title
A character vector specifying the title for rows. Default is
NULL.- column_title
A character vector specifying the title for columns. Default is
NULL.- row_title_side
A character vector specifying the side to place row title. Default is
"left".- column_title_side
A character vector specifying the side to place column title. Default is
"top".- row_title_rot
The rotation angle for row title. Default is
0.- column_title_rot
The rotation angle for column title.
- feature_split
A factor specifying how to split the features. Default is
NULL.- feature_split_by
A character vector specifying which group.by to use when splitting features (into n_split feature clusters). Default is
NULL.- n_split
A number of feature splits (feature clusters) to create. Default is
NULL.- split_order
A numeric vector specifying the order of splits. Default is
NULL.- split_method
A character vector specifying the method for splitting features. Options are
"kmeans","hclust", or"mfuzz". Default is"kmeans".- decreasing
Whether to sort feature splits in decreasing order. Default is
FALSE.- fuzzification
The fuzzification coefficient. Default is
NULL.- anno_terms
Whether to include term annotations. Default is
FALSE.- anno_keys
Whether to include key annotations. Default is
FALSE.- anno_features
Whether to include feature annotations. Default is
FALSE.- terms_width
A unit specifying the width of term annotations. Default is
unit(4, "in").- terms_fontsize
A numeric vector specifying the font size(s) for term annotations. Default is
8.- terms_stat
Which enrichment statistic to show after each term. Use
"none"to hide the bar background,"score"for-log10of the active p-value metric, or any column from the enrichment result such as"p.adjust","pvalue","qvalue","GeneRatio","RichFactor","FoldEnrichment","zScore", or"Count".- terms_stat_digits
Number of significant digits for numeric term statistics.
- terms_stat_test
Logical. Whether to show the numeric term statistic value at the right side of each term when
terms_statis enabled.- keys_width
A unit specifying the width of key annotations. Default is
unit(2, "in").- keys_fontsize
A two-length numeric vector specifying the minimum and maximum font size(s) for key annotations. Default is
c(6, 10).- features_width
A unit specifying the width of feature annotations. Default is
unit(2, "in").- features_fontsize
A two-length numeric vector specifying the minimum and maximum font size(s) for feature annotations. Default is
c(6, 10).- IDtype
A character vector specifying the type of IDs for features. Default is
"symbol".- species
A character vector specifying the species for features. Default is
"Homo_sapiens".- db_update
Whether the gene annotation databases should be forcefully updated. If set to FALSE, the function will attempt to load the cached databases instead. Default is
FALSE.- db_version
A character vector specifying the version of the gene annotation databases to be retrieved. Default is
"latest".- db_combine
Whether to use a combined database. Default is
FALSE.- convert_species
Whether to use a species-converted database when the annotation is missing for the specified species. Default is
TRUE.- Ensembl_version
An integer specifying the Ensembl version. Default is
NULL. IfNULL, the latest version will be used.- mirror
A character vector specifying the mirror for the Ensembl database. Default is
NULL.- db
A character vector specifying the database to use. Default is
"GO_BP".- TERM2GENE
A data.frame specifying the TERM2GENE mapping for the database. Default is
NULL.- TERM2NAME
A data.frame specifying the TERM2NAME mapping for the database. Default is
NULL.- minGSSize
An integer specifying the minimum gene set size for the database. Default is
10.- maxGSSize
An integer specifying the maximum gene set size for the database. Default is
500.- GO_simplify
Whether to simplify gene ontology terms. Default is
FALSE.- GO_simplify_cutoff
A character vector specifying the cutoff for GO simplification. Default is
"p.adjust < 0.05".- simplify_method
A character vector specifying the method for GO simplification. Default is
"Wang".- simplify_similarityCutoff
The similarity cutoff for GO simplification. Default is
0.7.- pvalueCutoff
A numeric vector specifying the p-value cutoff(s) for significance. Default is
NULL.- padjustCutoff
The adjusted p-value cutoff for significance. Default is
0.05.- topTerm
A number of top terms to include. Default is
5.- show_termid
Whether to show term IDs. Default is
FALSE.- topWord
A number of top words to include. Default is
20.- words_excluded
A character vector specifying the words to exclude. Default is
NULL.- nlabel
A number of labels to include. Default is
20.- features_label
A character vector specifying the features to label. Default is
NULL.- label_size
The size of labels. Default is
10.- label_color
A character vector specifying the color of labels. Default is
"black".- pseudotime_label
The pseudotime label. Default is
NULL.- pseudotime_label_color
The pseudotime label color. Default is
"black".- pseudotime_label_linetype
The pseudotime label line type. Default is
2.- pseudotime_label_linewidth
The pseudotime label line width. Default is
3.- heatmap_palette
A character vector specifying the palette to use for the heatmap. Default is
"RdBu".- heatmap_palcolor
A character vector specifying the heatmap color to use. Default is
NULL.- pseudotime_palette
The color palette to use for pseudotime. Default is
"cividis".- pseudotime_palcolor
The colors to use for the pseudotime in the heatmap. Default is
NULL.- feature_split_palette
A character vector specifying the palette to use for feature splits. Default is
"simspec".- feature_split_palcolor
A character vector specifying the feature split color to use. Default is
NULL.- cell_annotation
A character vector specifying the cell annotation(s) to include. Default is
NULL.- cell_annotation_palette
A character vector specifying the palette to use for cell annotations. The length of the vector should match the number of cell_annotation. Default is
"Chinese".- cell_annotation_palcolor
A list of character vector specifying the cell annotation color(s) to use. The length of the list should match the number of cell_annotation. Default is
NULL.- cell_annotation_params
A list specifying additional parameters for cell annotations. Default is a list with
width = unit(1, "cm")if flip is TRUE, else a list withheight = unit(1, "cm").- feature_annotation
A character vector specifying the feature annotation(s) to include. Default is
NULL.- feature_annotation_palette
A character vector specifying the palette to use for feature annotations. The length of the vector should match the number of feature_annotation. Default is
"Dark2".- feature_annotation_palcolor
A list of character vector specifying the feature annotation color to use. The length of the list should match the number of feature_annotation. Default is
NULL.- feature_annotation_params
A list specifying additional parameters for feature annotations. Default is
list().- separate_annotation
Names of the annotations to be displayed in separate annotation blocks. Each name should match a column name in the metadata of the
Seuratobject.- separate_annotation_palette
The color palette to use for separate annotations. Default is
"Chinese".- separate_annotation_palcolor
The colors to use for each level of the separate annotations. Default is
NULL.- separate_annotation_params
Other parameters to ComplexHeatmap::HeatmapAnnotation when creating a separate annotation blocks.
- reverse_ht
Whether to reverse the heatmap. Default is
NULL.- use_raster
Whether to use a raster device for plotting. Default is
NULL.- raster_device
A character vector specifying the raster device to use. Default is
"png".- raster_by_magick
Whether to use the 'magick' package for raster. Default is
FALSE.- height
The height of the heatmap in the specified units. If not provided, the height will be automatically determined based on the number of rows in the heatmap and the default unit.
- width
The width of the heatmap in the specified units. If not provided, the width will be automatically determined based on the number of columns in the heatmap and the default unit.
- units
The units to use for the width and height of the heatmap. Default is
"inch", Options are"mm","cm", or"inch".- cores
The number of cores to use for parallelization with foreach::foreach. Default is
1.- verbose
Whether to print the message. Default is
TRUE.- seed
Random seed for reproducibility. Default is
11.- legend.position
A character vector specifying the side to place the legends. Options are
"right","left","top", or"bottom". Default is"right". When row names are long and shown on the right side, the gap between the heatmap and the legend is automatically increased to avoid overlap.- ht_params
Additional parameters to customize the appearance of the heatmap. This should be a list with named elements, where the names correspond to parameter names in the ComplexHeatmap::Heatmap function. Any conflicting parameters will override the defaults set by this function. Default is
list().- ...
Additional arguments passed to the other functions.
Examples
data(pancreas_sub)
pancreas_sub <- standard_scop(pancreas_sub)
#> ℹ [2026-07-02 08:55:07] Start standard processing workflow...
#> ℹ [2026-07-02 08:55:08] Checking a list of <Seurat>...
#> ! [2026-07-02 08:55:08] Data 1/1 of the `srt_list` is "unknown"
#> ℹ [2026-07-02 08:55:08] Perform `NormalizeData()` with `normalization.method = 'LogNormalize'` on 1/1 of `srt_list`...
#> ℹ [2026-07-02 08:55:08] Perform `FindVariableFeatures()` on 1/1 of `srt_list`...
#> ℹ [2026-07-02 08:55:08] Use the separate HVF from `srt_list`
#> ℹ [2026-07-02 08:55:09] Number of available HVF: 2000
#> ℹ [2026-07-02 08:55:09] Finished check
#> ℹ [2026-07-02 08:55:09] Perform `ScaleData()`
#> ℹ [2026-07-02 08:55:09] Perform pca linear dimension reduction
#> ℹ [2026-07-02 08:55:09] Use stored estimated dimensions 1:23 for Standardpca
#> ℹ [2026-07-02 08:55:10] Perform `Seurat::FindClusters()` with `cluster_algorithm = 'louvain'` and `cluster_resolution = 0.6`
#> ℹ [2026-07-02 08:55:10] Reorder clusters...
#> ℹ [2026-07-02 08:55:10] Skip `log1p()` because `layer = data` is not "counts"
#> ℹ [2026-07-02 08:55:10] Perform umap nonlinear dimension reduction
#> ✔ [2026-07-02 08:55:15] Standard processing workflow completed
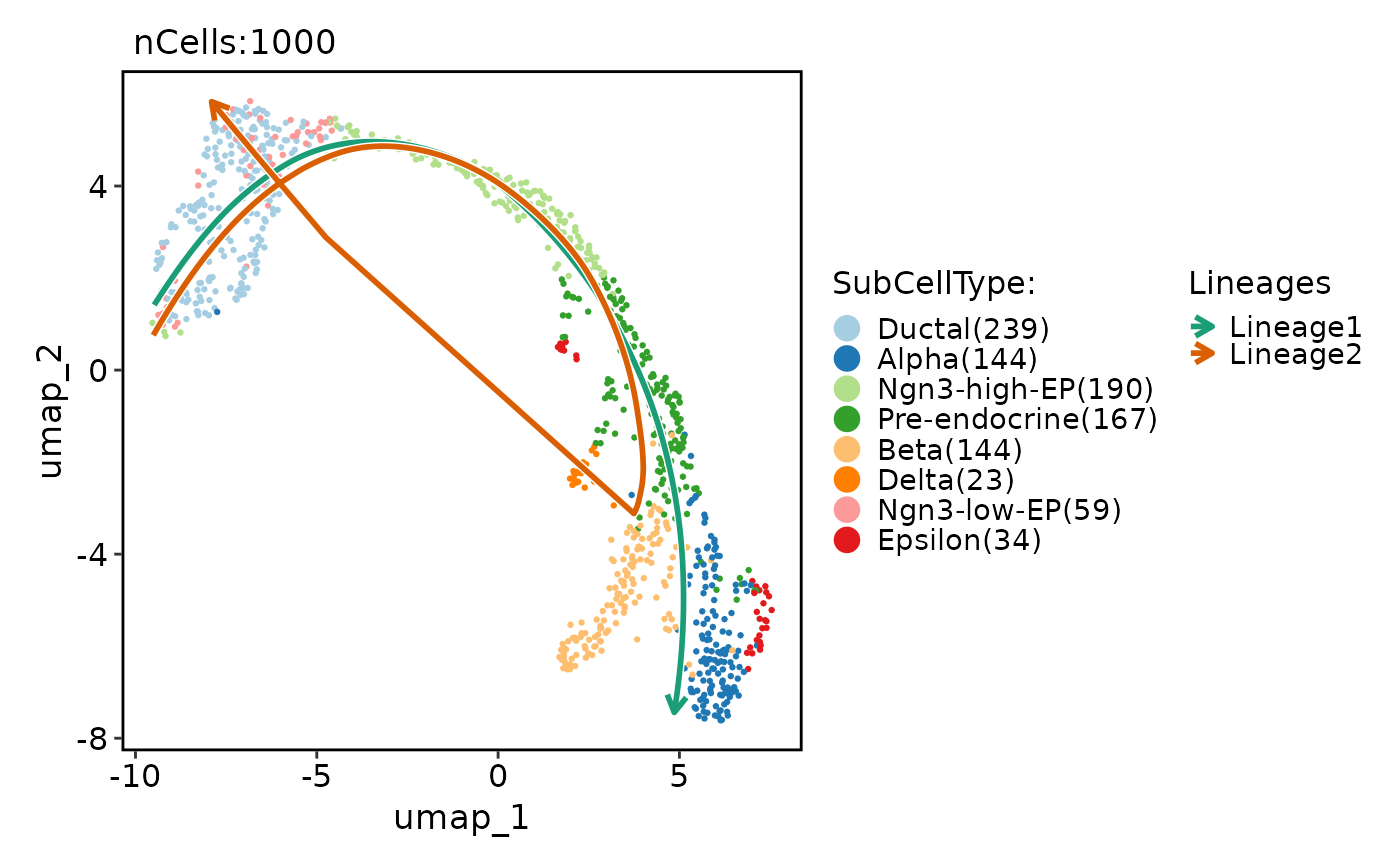
pancreas_sub <- RunSlingshot(
pancreas_sub,
group.by = "SubCellType",
reduction = "UMAP"
)
#> Warning: Removed 18 rows containing missing values or values outside the scale range
#> (`geom_path()`).
#> Warning: Removed 18 rows containing missing values or values outside the scale range
#> (`geom_path()`).
#> Warning: Removed 4 rows containing missing values or values outside the scale range
#> (`geom_path()`).
#> Warning: Removed 4 rows containing missing values or values outside the scale range
#> (`geom_path()`).
 pancreas_sub <- RunDynamicFeatures(
pancreas_sub,
lineages = c("Lineage1", "Lineage2"), ,
fit_method = "pretsa",
n_candidates = 200
)
#> ℹ [2026-07-02 08:55:17] Start find dynamic features
#> ℹ [2026-07-02 08:55:17] Data type is raw counts
#> ℹ [2026-07-02 08:55:18] Number of candidate features (union): 226
#> ℹ [2026-07-02 08:55:19] Data type is raw counts
#> ℹ [2026-07-02 08:55:19] Calculating dynamic features for "Lineage1"...
#> ℹ [2026-07-02 08:55:19] Calculating dynamic features for "Lineage2"...
#> ✔ [2026-07-02 08:55:19] Find dynamic features done
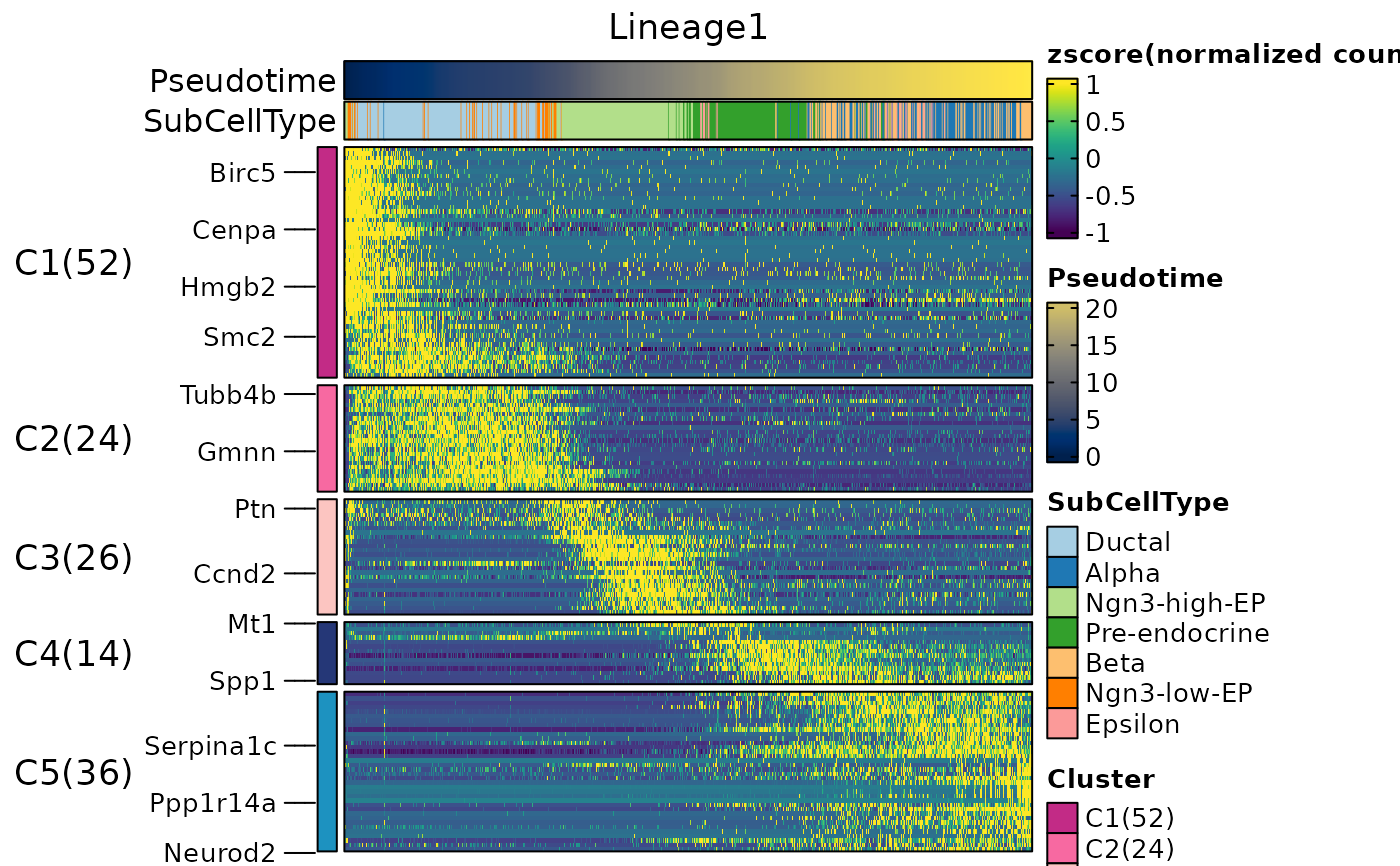
ht1 <- DynamicHeatmap(
pancreas_sub,
exp_legend_title = "Z-score",
lineages = "Lineage1",
n_split = 5,
split_method = "kmeans-peaktime",
cell_annotation = "SubCellType",
width = 2,
height = 3
)
#> ℹ [2026-07-02 08:55:19] [1] 128 features from Lineage1 passed the threshold (exp_ncells>[1] 20 & r.sq>[1] 0.2 & dev.expl>[1] 0.2 & padjust<[1] 0.05):
#> ℹ Gcg,Iapp,Pyy,Gast,Rbp4,Lrpprc,Chgb,Slc38a5,2810417H13Rik,Chga...
ht1$plot
pancreas_sub <- RunDynamicFeatures(
pancreas_sub,
lineages = c("Lineage1", "Lineage2"), ,
fit_method = "pretsa",
n_candidates = 200
)
#> ℹ [2026-07-02 08:55:17] Start find dynamic features
#> ℹ [2026-07-02 08:55:17] Data type is raw counts
#> ℹ [2026-07-02 08:55:18] Number of candidate features (union): 226
#> ℹ [2026-07-02 08:55:19] Data type is raw counts
#> ℹ [2026-07-02 08:55:19] Calculating dynamic features for "Lineage1"...
#> ℹ [2026-07-02 08:55:19] Calculating dynamic features for "Lineage2"...
#> ✔ [2026-07-02 08:55:19] Find dynamic features done
ht1 <- DynamicHeatmap(
pancreas_sub,
exp_legend_title = "Z-score",
lineages = "Lineage1",
n_split = 5,
split_method = "kmeans-peaktime",
cell_annotation = "SubCellType",
width = 2,
height = 3
)
#> ℹ [2026-07-02 08:55:19] [1] 128 features from Lineage1 passed the threshold (exp_ncells>[1] 20 & r.sq>[1] 0.2 & dev.expl>[1] 0.2 & padjust<[1] 0.05):
#> ℹ Gcg,Iapp,Pyy,Gast,Rbp4,Lrpprc,Chgb,Slc38a5,2810417H13Rik,Chga...
ht1$plot
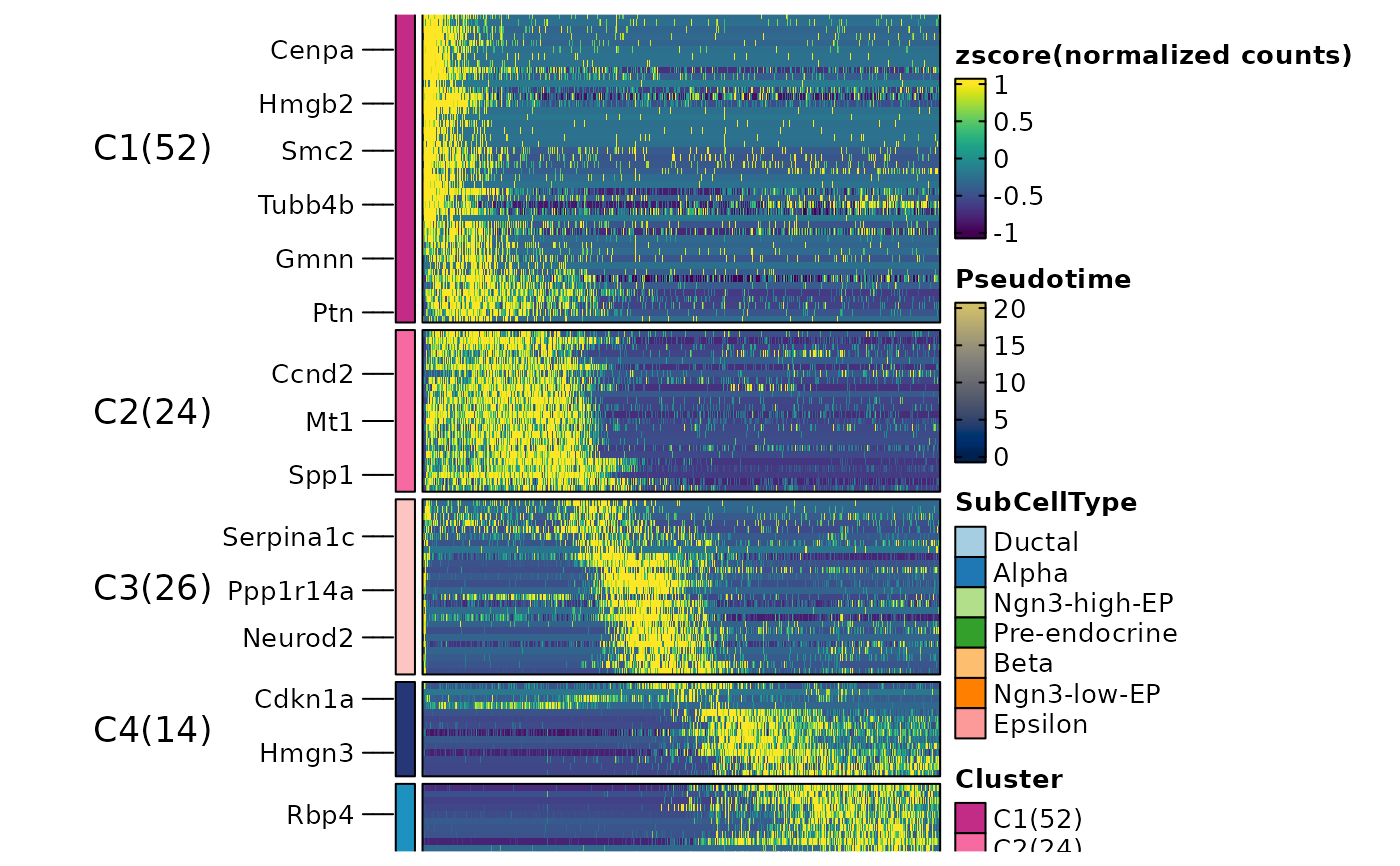
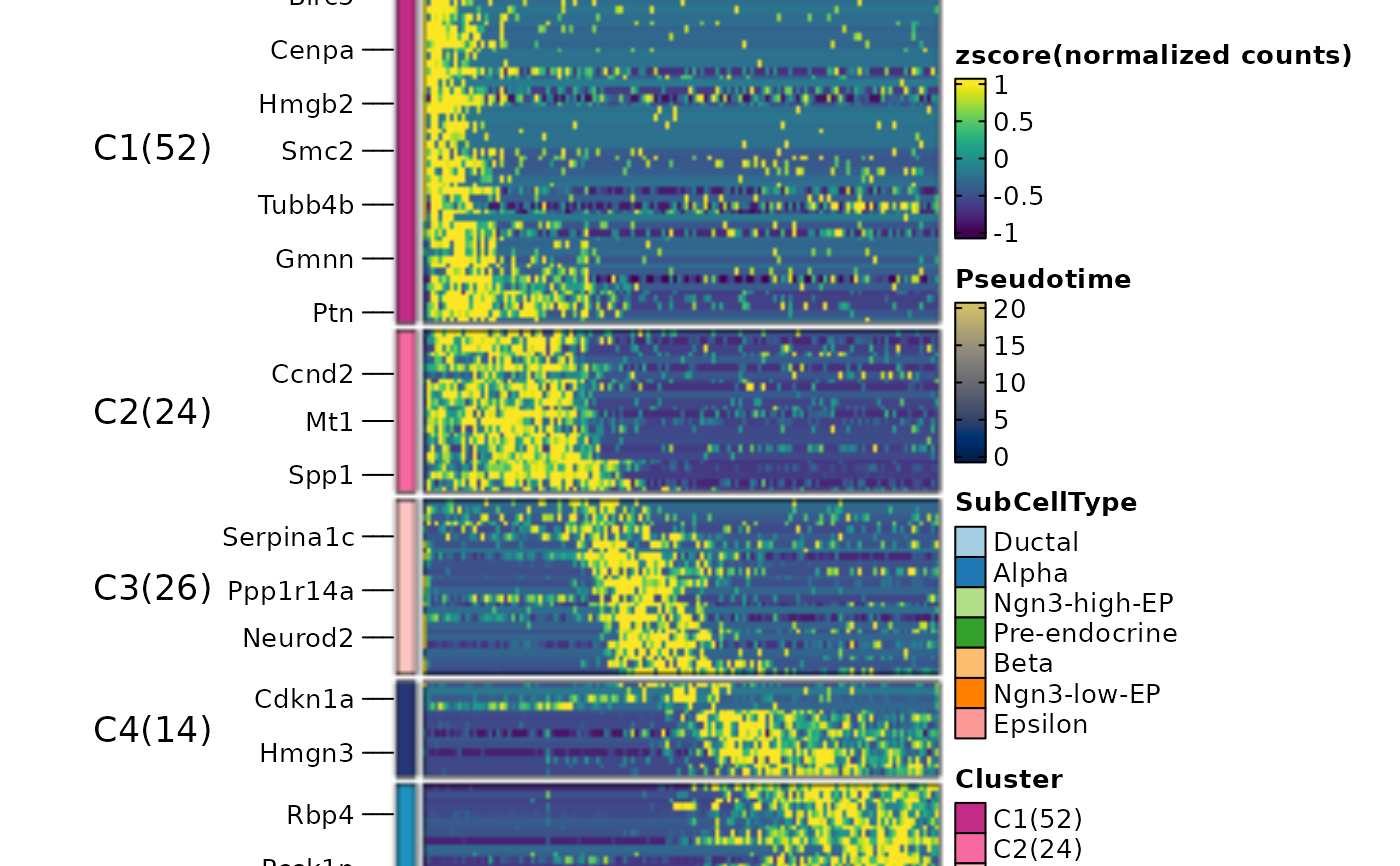
 thisplot::panel_fix(ht1$plot, raster = TRUE, dpi = 50)
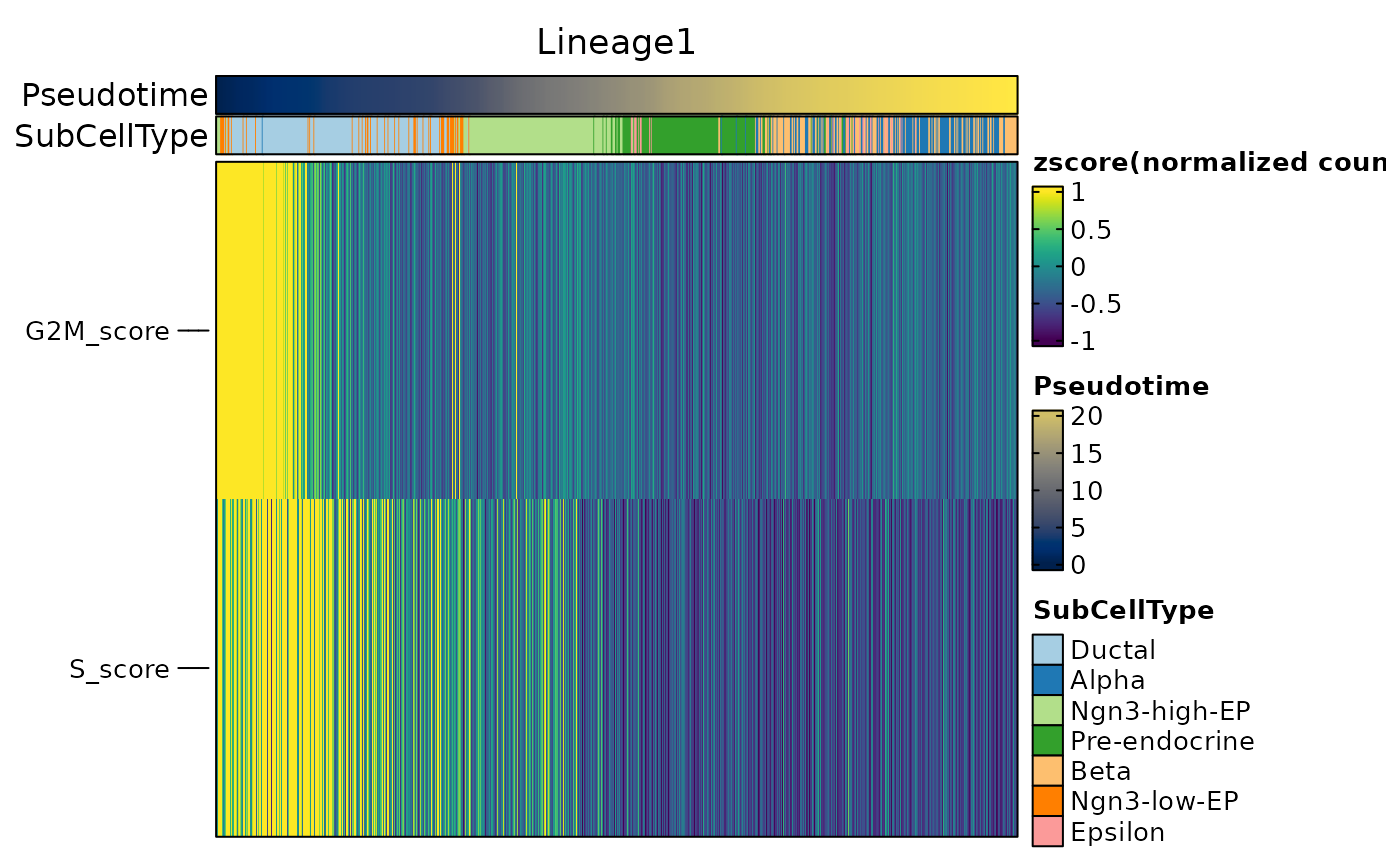
 ht2 <- DynamicHeatmap(
pancreas_sub,
exp_legend_title = "Z-score",
lineages = "Lineage1",
features = c(
"Sox9",
"Neurod2",
"Isl1",
"Rbp4",
"Pyy",
"S_score",
"G2M_score"
),
cell_annotation = "SubCellType"
)
#> ℹ [2026-07-02 08:55:22] Start find dynamic features
#> ℹ [2026-07-02 08:55:23] Data type is raw counts
#> ℹ [2026-07-02 08:55:24] Number of candidate features (union): 2
#> ℹ [2026-07-02 08:55:24] Data type is raw counts
#> ! [2026-07-02 08:55:24] Negative values detected
#> ! [2026-07-02 08:55:24] Negative values detected
#> ℹ [2026-07-02 08:55:24] Calculating dynamic features for "Lineage1"...
#> ℹ [2026-07-02 08:55:24] Using 1 core
#> ⠙ [2026-07-02 08:55:24] Running for S_score [1/2] ■■■■■ 50% | ETA: 0s
#> ✔ [2026-07-02 08:55:24] Completed 2 tasks in 93ms
#>
#> ℹ [2026-07-02 08:55:24] Building results
#> ✔ [2026-07-02 08:55:24] Find dynamic features done
#> ℹ [2026-07-02 08:55:24] Some features were missing in at least one lineage:
#> ℹ Isl1,Neurod2,Pyy,Rbp4,Sox9...
ht2$plot
ht2 <- DynamicHeatmap(
pancreas_sub,
exp_legend_title = "Z-score",
lineages = "Lineage1",
features = c(
"Sox9",
"Neurod2",
"Isl1",
"Rbp4",
"Pyy",
"S_score",
"G2M_score"
),
cell_annotation = "SubCellType"
)
#> ℹ [2026-07-02 08:55:22] Start find dynamic features
#> ℹ [2026-07-02 08:55:23] Data type is raw counts
#> ℹ [2026-07-02 08:55:24] Number of candidate features (union): 2
#> ℹ [2026-07-02 08:55:24] Data type is raw counts
#> ! [2026-07-02 08:55:24] Negative values detected
#> ! [2026-07-02 08:55:24] Negative values detected
#> ℹ [2026-07-02 08:55:24] Calculating dynamic features for "Lineage1"...
#> ℹ [2026-07-02 08:55:24] Using 1 core
#> ⠙ [2026-07-02 08:55:24] Running for S_score [1/2] ■■■■■ 50% | ETA: 0s
#> ✔ [2026-07-02 08:55:24] Completed 2 tasks in 93ms
#>
#> ℹ [2026-07-02 08:55:24] Building results
#> ✔ [2026-07-02 08:55:24] Find dynamic features done
#> ℹ [2026-07-02 08:55:24] Some features were missing in at least one lineage:
#> ℹ Isl1,Neurod2,Pyy,Rbp4,Sox9...
ht2$plot
 ht3 <- DynamicHeatmap(
pancreas_sub,
exp_legend_title = "Z-score",
lineages = c("Lineage1", "Lineage2"),
n_split = 5,
nlabel = 10,
split_method = "kmeans",
cluster_rows = TRUE,
cell_annotation = "SubCellType",
width = 1,
height = 2
)
#> ℹ [2026-07-02 08:55:25] [1] 152 features from Lineage1,Lineage2 passed the threshold (exp_ncells>[1] 20 & r.sq>[1] 0.2 & dev.expl>[1] 0.2 & padjust<[1] 0.05):
#> ℹ Gcg,Iapp,Pyy,Gast,Rbp4,Lrpprc,Chgb,Slc38a5,2810417H13Rik,Chga...
ht3$plot
ht3 <- DynamicHeatmap(
pancreas_sub,
exp_legend_title = "Z-score",
lineages = c("Lineage1", "Lineage2"),
n_split = 5,
nlabel = 10,
split_method = "kmeans",
cluster_rows = TRUE,
cell_annotation = "SubCellType",
width = 1,
height = 2
)
#> ℹ [2026-07-02 08:55:25] [1] 152 features from Lineage1,Lineage2 passed the threshold (exp_ncells>[1] 20 & r.sq>[1] 0.2 & dev.expl>[1] 0.2 & padjust<[1] 0.05):
#> ℹ Gcg,Iapp,Pyy,Gast,Rbp4,Lrpprc,Chgb,Slc38a5,2810417H13Rik,Chga...
ht3$plot
 ht4 <- DynamicHeatmap(
pancreas_sub,
exp_legend_title = "Z-score",
lineages = c("Lineage1", "Lineage2"),
reverse_ht = "Lineage1",
cell_annotation = "SubCellType",
n_split = 3,
nlabel = 10,
split_method = "mfuzz",
species = "Mus_musculus",
db = "GO_BP",
anno_terms = TRUE,
width = 1,
height = 2
)
#> ℹ [2026-07-02 08:55:30] [1] 152 features from Lineage1,Lineage2 passed the threshold (exp_ncells>[1] 20 & r.sq>[1] 0.2 & dev.expl>[1] 0.2 & padjust<[1] 0.05):
#> ℹ Gcg,Iapp,Pyy,Gast,Rbp4,Lrpprc,Chgb,Slc38a5,2810417H13Rik,Chga...
#> ℹ [2026-07-02 08:55:31] Start Enrichment analysis
#> ℹ [2026-07-02 08:55:31] Species: "Mus_musculus"
#> ℹ [2026-07-02 08:55:31] Loading cached: GO_BP version: 3.23.0 nterm:14957 created: 2026-07-02 08:44:56
#> ℹ [2026-07-02 08:55:32] Permform enrichment...
#> ℹ [2026-07-02 08:55:33] Using 1 core
#> ⠙ [2026-07-02 08:55:33] Running for 1 [1/3] ■■■ 33% | ETA: 1s
#> ✔ [2026-07-02 08:55:33] Completed 3 tasks in 1.5s
#>
#> ℹ [2026-07-02 08:55:33] Building results
#> ✔ [2026-07-02 08:55:35] Enrichment analysis done
ht5 <- DynamicHeatmap(
pancreas_sub,
exp_legend_title = "Z-score",
lineages = "Lineage1",
cell_annotation = "SubCellType",
n_split = 2,
split_method = "mfuzz",
species = "Mus_musculus",
db = "GO_BP",
cores = 2,
nlabel = 10,
anno_terms = TRUE,
anno_keys = TRUE,
anno_features = TRUE,
width = 1,
height = 2,
terms_width = grid::unit(1, "in"),
terms_fontsize = 6,
keys_width = grid::unit(0.5, "in"),
keys_fontsize = c(3, 6),
features_width = grid::unit(0.5, "in"),
features_fontsize = c(3, 6)
)
#> ℹ [2026-07-02 08:55:37] [1] 128 features from Lineage1 passed the threshold (exp_ncells>[1] 20 & r.sq>[1] 0.2 & dev.expl>[1] 0.2 & padjust<[1] 0.05):
#> ℹ Gcg,Iapp,Pyy,Gast,Rbp4,Lrpprc,Chgb,Slc38a5,2810417H13Rik,Chga...
#> ℹ [2026-07-02 08:55:38] Start Enrichment analysis
#> ℹ [2026-07-02 08:55:38] Species: "Mus_musculus"
#> ℹ [2026-07-02 08:55:38] Loading cached: GO_BP version: 3.23.0 nterm:14957 created: 2026-07-02 08:44:56
#> ℹ [2026-07-02 08:55:39] Permform enrichment...
#> ℹ [2026-07-02 08:55:41] Using 2 cores
#> ⠙ [2026-07-02 08:55:41] Running for 1 [1/2] ■■■■■ 50% | ETA: 1s
#> ✔ [2026-07-02 08:55:41] Completed 2 tasks in 1s
#>
#> ℹ [2026-07-02 08:55:41] Building results
#> ✔ [2026-07-02 08:55:42] Enrichment analysis done
pancreas_sub <- AnnotateFeatures(
pancreas_sub,
species = "Mus_musculus",
db = c("CSPA", "TF")
)
#> ℹ [2026-07-02 08:57:50] Species: "Mus_musculus"
#> ℹ [2026-07-02 08:57:50] Loading cached: TF version: AnimalTFDB4 nterm:2 created: 2026-07-02 08:17:13
#> ℹ [2026-07-02 08:57:55] Preparing database: CSPA
ht6 <- DynamicHeatmap(
pancreas_sub,
exp_legend_title = "Z-score",
lineages = c("Lineage1", "Lineage2"),
reverse_ht = "Lineage1",
use_fitted = TRUE,
n_split = 3,
nlabel = 10,
split_method = "mfuzz",
heatmap_palette = "viridis",
cell_annotation = c(
"SubCellType", "Phase", "G2M_score"
),
cell_annotation_palette = c(
"Chinese", "simspec", "Purples"
),
separate_annotation = list(
"SubCellType", c("Arxes1", "Ncoa2")
),
separate_annotation_palette = c(
"Chinese", "Set1"
),
separate_annotation_params = list(
height = grid::unit(10, "mm")
),
feature_annotation = c("TF", "CSPA"),
feature_annotation_palcolor = list(
c("gold", "steelblue"),
c("forestgreen")
),
pseudotime_label = 25,
pseudotime_label_color = "red",
width = 1,
height = 2
)
#> ℹ [2026-07-02 08:57:57] [1] 152 features from Lineage1,Lineage2 passed the threshold (exp_ncells>[1] 20 & r.sq>[1] 0.2 & dev.expl>[1] 0.2 & padjust<[1] 0.05):
#> ℹ Gcg,Iapp,Pyy,Gast,Rbp4,Lrpprc,Chgb,Slc38a5,2810417H13Rik,Chga...
#> ℹ [2026-07-02 08:57:57] Start find dynamic features
#> ℹ [2026-07-02 08:57:59] Data type is raw counts
#> ℹ [2026-07-02 08:57:59] Number of candidate features (union): 2
#> ℹ [2026-07-02 08:58:00] Data type is raw counts
#> ℹ [2026-07-02 08:58:00] Calculating dynamic features for "Lineage1"...
#> ℹ [2026-07-02 08:58:00] Using 1 core
#> ⠙ [2026-07-02 08:58:00] Running for Arxes1 [1/2] ■■■■■ 50% | ETA: 0s
#> ✔ [2026-07-02 08:58:00] Completed 2 tasks in 230ms
#>
#> ℹ [2026-07-02 08:58:00] Building results
#> ✔ [2026-07-02 08:58:00] Find dynamic features done
#> ℹ [2026-07-02 08:58:00] Start find dynamic features
#> ℹ [2026-07-02 08:58:02] Data type is raw counts
#> ℹ [2026-07-02 08:58:02] Number of candidate features (union): 2
#> ℹ [2026-07-02 08:58:03] Data type is raw counts
#> ℹ [2026-07-02 08:58:03] Calculating dynamic features for "Lineage2"...
#> ℹ [2026-07-02 08:58:03] Using 1 core
#> ⠙ [2026-07-02 08:58:03] Running for Arxes1 [1/2] ■■■■■ 50% | ETA: 0s
#> ✔ [2026-07-02 08:58:03] Completed 2 tasks in 122ms
#>
#> ℹ [2026-07-02 08:58:03] Building results
#> ✔ [2026-07-02 08:58:03] Find dynamic features done
#> Picking joint bandwidth of 15.9
#> Picking joint bandwidth of 18.1
#> Picking joint bandwidth of 15.9
#> Picking joint bandwidth of 18.1
ht7 <- DynamicHeatmap(
pancreas_sub,
exp_legend_title = "Z-score",
lineages = c("Lineage1", "Lineage2"),
reverse_ht = "Lineage1",
use_fitted = TRUE,
n_split = 3,
nlabel = 10,
split_method = "mfuzz",
heatmap_palette = "viridis",
cell_annotation = c(
"SubCellType", "Phase", "G2M_score"
),
cell_annotation_palette = c(
"Chinese", "simspec", "Purples"
),
separate_annotation = list(
"SubCellType", c("Arxes1", "Ncoa2")
),
separate_annotation_palette = c("Chinese", "Set1"),
separate_annotation_params = list(width = grid::unit(10, "mm")),
feature_annotation = c("TF", "CSPA"),
feature_annotation_palcolor = list(
c("gold", "steelblue"),
c("forestgreen")
),
pseudotime_label = 25,
pseudotime_label_color = "red",
flip = TRUE,
column_title_rot = 90,
width = 2,
height = 1
)
#> ℹ [2026-07-02 08:58:07] [1] 152 features from Lineage1,Lineage2 passed the threshold (exp_ncells>[1] 20 & r.sq>[1] 0.2 & dev.expl>[1] 0.2 & padjust<[1] 0.05):
#> ℹ Gcg,Iapp,Pyy,Gast,Rbp4,Lrpprc,Chgb,Slc38a5,2810417H13Rik,Chga...
#> ℹ [2026-07-02 08:58:08] Start find dynamic features
#> ℹ [2026-07-02 08:58:09] Data type is raw counts
#> ℹ [2026-07-02 08:58:10] Number of candidate features (union): 2
#> ℹ [2026-07-02 08:58:10] Data type is raw counts
#> ℹ [2026-07-02 08:58:10] Calculating dynamic features for "Lineage1"...
#> ℹ [2026-07-02 08:58:10] Using 1 core
#> ⠙ [2026-07-02 08:58:10] Running for Arxes1 [1/2] ■■■■■ 50% | ETA: 0s
#> ✔ [2026-07-02 08:58:10] Completed 2 tasks in 139ms
#>
#> ℹ [2026-07-02 08:58:10] Building results
#> ✔ [2026-07-02 08:58:11] Find dynamic features done
#> ℹ [2026-07-02 08:58:11] Start find dynamic features
#> ℹ [2026-07-02 08:58:12] Data type is raw counts
#> ℹ [2026-07-02 08:58:13] Number of candidate features (union): 2
#> ℹ [2026-07-02 08:58:13] Data type is raw counts
#> ℹ [2026-07-02 08:58:13] Calculating dynamic features for "Lineage2"...
#> ℹ [2026-07-02 08:58:13] Using 1 core
#> ⠙ [2026-07-02 08:58:13] Running for Arxes1 [1/2] ■■■■■ 50% | ETA: 0s
#> ✔ [2026-07-02 08:58:13] Completed 2 tasks in 129ms
#>
#> ℹ [2026-07-02 08:58:13] Building results
#> ✔ [2026-07-02 08:58:14] Find dynamic features done
#> Picking joint bandwidth of 15.9
#> Picking joint bandwidth of 18.1
#> Picking joint bandwidth of 15.9
#> Picking joint bandwidth of 18.1
ht4 <- DynamicHeatmap(
pancreas_sub,
exp_legend_title = "Z-score",
lineages = c("Lineage1", "Lineage2"),
reverse_ht = "Lineage1",
cell_annotation = "SubCellType",
n_split = 3,
nlabel = 10,
split_method = "mfuzz",
species = "Mus_musculus",
db = "GO_BP",
anno_terms = TRUE,
width = 1,
height = 2
)
#> ℹ [2026-07-02 08:55:30] [1] 152 features from Lineage1,Lineage2 passed the threshold (exp_ncells>[1] 20 & r.sq>[1] 0.2 & dev.expl>[1] 0.2 & padjust<[1] 0.05):
#> ℹ Gcg,Iapp,Pyy,Gast,Rbp4,Lrpprc,Chgb,Slc38a5,2810417H13Rik,Chga...
#> ℹ [2026-07-02 08:55:31] Start Enrichment analysis
#> ℹ [2026-07-02 08:55:31] Species: "Mus_musculus"
#> ℹ [2026-07-02 08:55:31] Loading cached: GO_BP version: 3.23.0 nterm:14957 created: 2026-07-02 08:44:56
#> ℹ [2026-07-02 08:55:32] Permform enrichment...
#> ℹ [2026-07-02 08:55:33] Using 1 core
#> ⠙ [2026-07-02 08:55:33] Running for 1 [1/3] ■■■ 33% | ETA: 1s
#> ✔ [2026-07-02 08:55:33] Completed 3 tasks in 1.5s
#>
#> ℹ [2026-07-02 08:55:33] Building results
#> ✔ [2026-07-02 08:55:35] Enrichment analysis done
ht5 <- DynamicHeatmap(
pancreas_sub,
exp_legend_title = "Z-score",
lineages = "Lineage1",
cell_annotation = "SubCellType",
n_split = 2,
split_method = "mfuzz",
species = "Mus_musculus",
db = "GO_BP",
cores = 2,
nlabel = 10,
anno_terms = TRUE,
anno_keys = TRUE,
anno_features = TRUE,
width = 1,
height = 2,
terms_width = grid::unit(1, "in"),
terms_fontsize = 6,
keys_width = grid::unit(0.5, "in"),
keys_fontsize = c(3, 6),
features_width = grid::unit(0.5, "in"),
features_fontsize = c(3, 6)
)
#> ℹ [2026-07-02 08:55:37] [1] 128 features from Lineage1 passed the threshold (exp_ncells>[1] 20 & r.sq>[1] 0.2 & dev.expl>[1] 0.2 & padjust<[1] 0.05):
#> ℹ Gcg,Iapp,Pyy,Gast,Rbp4,Lrpprc,Chgb,Slc38a5,2810417H13Rik,Chga...
#> ℹ [2026-07-02 08:55:38] Start Enrichment analysis
#> ℹ [2026-07-02 08:55:38] Species: "Mus_musculus"
#> ℹ [2026-07-02 08:55:38] Loading cached: GO_BP version: 3.23.0 nterm:14957 created: 2026-07-02 08:44:56
#> ℹ [2026-07-02 08:55:39] Permform enrichment...
#> ℹ [2026-07-02 08:55:41] Using 2 cores
#> ⠙ [2026-07-02 08:55:41] Running for 1 [1/2] ■■■■■ 50% | ETA: 1s
#> ✔ [2026-07-02 08:55:41] Completed 2 tasks in 1s
#>
#> ℹ [2026-07-02 08:55:41] Building results
#> ✔ [2026-07-02 08:55:42] Enrichment analysis done
pancreas_sub <- AnnotateFeatures(
pancreas_sub,
species = "Mus_musculus",
db = c("CSPA", "TF")
)
#> ℹ [2026-07-02 08:57:50] Species: "Mus_musculus"
#> ℹ [2026-07-02 08:57:50] Loading cached: TF version: AnimalTFDB4 nterm:2 created: 2026-07-02 08:17:13
#> ℹ [2026-07-02 08:57:55] Preparing database: CSPA
ht6 <- DynamicHeatmap(
pancreas_sub,
exp_legend_title = "Z-score",
lineages = c("Lineage1", "Lineage2"),
reverse_ht = "Lineage1",
use_fitted = TRUE,
n_split = 3,
nlabel = 10,
split_method = "mfuzz",
heatmap_palette = "viridis",
cell_annotation = c(
"SubCellType", "Phase", "G2M_score"
),
cell_annotation_palette = c(
"Chinese", "simspec", "Purples"
),
separate_annotation = list(
"SubCellType", c("Arxes1", "Ncoa2")
),
separate_annotation_palette = c(
"Chinese", "Set1"
),
separate_annotation_params = list(
height = grid::unit(10, "mm")
),
feature_annotation = c("TF", "CSPA"),
feature_annotation_palcolor = list(
c("gold", "steelblue"),
c("forestgreen")
),
pseudotime_label = 25,
pseudotime_label_color = "red",
width = 1,
height = 2
)
#> ℹ [2026-07-02 08:57:57] [1] 152 features from Lineage1,Lineage2 passed the threshold (exp_ncells>[1] 20 & r.sq>[1] 0.2 & dev.expl>[1] 0.2 & padjust<[1] 0.05):
#> ℹ Gcg,Iapp,Pyy,Gast,Rbp4,Lrpprc,Chgb,Slc38a5,2810417H13Rik,Chga...
#> ℹ [2026-07-02 08:57:57] Start find dynamic features
#> ℹ [2026-07-02 08:57:59] Data type is raw counts
#> ℹ [2026-07-02 08:57:59] Number of candidate features (union): 2
#> ℹ [2026-07-02 08:58:00] Data type is raw counts
#> ℹ [2026-07-02 08:58:00] Calculating dynamic features for "Lineage1"...
#> ℹ [2026-07-02 08:58:00] Using 1 core
#> ⠙ [2026-07-02 08:58:00] Running for Arxes1 [1/2] ■■■■■ 50% | ETA: 0s
#> ✔ [2026-07-02 08:58:00] Completed 2 tasks in 230ms
#>
#> ℹ [2026-07-02 08:58:00] Building results
#> ✔ [2026-07-02 08:58:00] Find dynamic features done
#> ℹ [2026-07-02 08:58:00] Start find dynamic features
#> ℹ [2026-07-02 08:58:02] Data type is raw counts
#> ℹ [2026-07-02 08:58:02] Number of candidate features (union): 2
#> ℹ [2026-07-02 08:58:03] Data type is raw counts
#> ℹ [2026-07-02 08:58:03] Calculating dynamic features for "Lineage2"...
#> ℹ [2026-07-02 08:58:03] Using 1 core
#> ⠙ [2026-07-02 08:58:03] Running for Arxes1 [1/2] ■■■■■ 50% | ETA: 0s
#> ✔ [2026-07-02 08:58:03] Completed 2 tasks in 122ms
#>
#> ℹ [2026-07-02 08:58:03] Building results
#> ✔ [2026-07-02 08:58:03] Find dynamic features done
#> Picking joint bandwidth of 15.9
#> Picking joint bandwidth of 18.1
#> Picking joint bandwidth of 15.9
#> Picking joint bandwidth of 18.1
ht7 <- DynamicHeatmap(
pancreas_sub,
exp_legend_title = "Z-score",
lineages = c("Lineage1", "Lineage2"),
reverse_ht = "Lineage1",
use_fitted = TRUE,
n_split = 3,
nlabel = 10,
split_method = "mfuzz",
heatmap_palette = "viridis",
cell_annotation = c(
"SubCellType", "Phase", "G2M_score"
),
cell_annotation_palette = c(
"Chinese", "simspec", "Purples"
),
separate_annotation = list(
"SubCellType", c("Arxes1", "Ncoa2")
),
separate_annotation_palette = c("Chinese", "Set1"),
separate_annotation_params = list(width = grid::unit(10, "mm")),
feature_annotation = c("TF", "CSPA"),
feature_annotation_palcolor = list(
c("gold", "steelblue"),
c("forestgreen")
),
pseudotime_label = 25,
pseudotime_label_color = "red",
flip = TRUE,
column_title_rot = 90,
width = 2,
height = 1
)
#> ℹ [2026-07-02 08:58:07] [1] 152 features from Lineage1,Lineage2 passed the threshold (exp_ncells>[1] 20 & r.sq>[1] 0.2 & dev.expl>[1] 0.2 & padjust<[1] 0.05):
#> ℹ Gcg,Iapp,Pyy,Gast,Rbp4,Lrpprc,Chgb,Slc38a5,2810417H13Rik,Chga...
#> ℹ [2026-07-02 08:58:08] Start find dynamic features
#> ℹ [2026-07-02 08:58:09] Data type is raw counts
#> ℹ [2026-07-02 08:58:10] Number of candidate features (union): 2
#> ℹ [2026-07-02 08:58:10] Data type is raw counts
#> ℹ [2026-07-02 08:58:10] Calculating dynamic features for "Lineage1"...
#> ℹ [2026-07-02 08:58:10] Using 1 core
#> ⠙ [2026-07-02 08:58:10] Running for Arxes1 [1/2] ■■■■■ 50% | ETA: 0s
#> ✔ [2026-07-02 08:58:10] Completed 2 tasks in 139ms
#>
#> ℹ [2026-07-02 08:58:10] Building results
#> ✔ [2026-07-02 08:58:11] Find dynamic features done
#> ℹ [2026-07-02 08:58:11] Start find dynamic features
#> ℹ [2026-07-02 08:58:12] Data type is raw counts
#> ℹ [2026-07-02 08:58:13] Number of candidate features (union): 2
#> ℹ [2026-07-02 08:58:13] Data type is raw counts
#> ℹ [2026-07-02 08:58:13] Calculating dynamic features for "Lineage2"...
#> ℹ [2026-07-02 08:58:13] Using 1 core
#> ⠙ [2026-07-02 08:58:13] Running for Arxes1 [1/2] ■■■■■ 50% | ETA: 0s
#> ✔ [2026-07-02 08:58:13] Completed 2 tasks in 129ms
#>
#> ℹ [2026-07-02 08:58:13] Building results
#> ✔ [2026-07-02 08:58:14] Find dynamic features done
#> Picking joint bandwidth of 15.9
#> Picking joint bandwidth of 18.1
#> Picking joint bandwidth of 15.9
#> Picking joint bandwidth of 18.1