This function calculates gene-set scores from the specified database (db) for each lineage using the specified scoring method (score_method).
It then treats these scores as expression values and uses them as input to the RunDynamicFeatures function to identify dynamically enriched terms along the lineage.
Usage
RunDynamicEnrichment(
  srt,
  lineages,
  score_method = "AUCell",
  layer = "data",
  assay = NULL,
  min_expcells = 20,
  r.sq = 0.2,
  dev.expl = 0.2,
  padjust = 0.05,
  IDtype = "symbol",
  species = "Homo_sapiens",
  db = "GO_BP",
  db_update = FALSE,
  db_version = "latest",
  convert_species = TRUE,
  Ensembl_version = NULL,
  mirror = NULL,
  features = NULL,
  TERM2GENE = NULL,
  TERM2NAME = NULL,
  minGSSize = 10,
  maxGSSize = 500,
  backend = c("cpp", "r"),
  cpp_strategy = c("sparse", "topk", "full"),
  cores = 1,
  verbose = TRUE,
  seed = 11,
  ...
)
Arguments
- srt
A
Seuratobject orSummarizedExperimentobject containing the results of differential expression analysis (RunDEtest()). If specified, the genes and groups will be extracted from the object automatically. If not specified, thegeneIDandgeneID_groupsarguments must be provided.- lineages
A character vector specifying the lineage names for which dynamic features should be calculated.
- score_method
The method to use for scoring. Can be
"Seurat","AUCell","UCell","GSVA","ssGSEA","zscore","PLAGE", or"VISION". Multiple methods can be supplied at once; each method will be written to a method-suffixed assay before dynamic-feature fitting. Default is"AUCell".- layer
Which layer to use. Default is
"counts".- assay
Which assay to use. If
NULL, the default assay of the Seurat object will be used. When the object also containsChromatinAssay, the default assay and additionalChromatinAssaywill be preprocessed sequentially.- min_expcells
The minimum number of expected cells. Default is
20.- r.sq
The R-squared threshold. Default is
0.2.- dev.expl
The deviance explained threshold. Default is
0.2.- padjust
The p-value adjustment threshold. Default is
0.05.- IDtype
A character vector specifying the type of gene IDs in the
srtobject orgeneIDargument. This argument is used to convert the gene IDs to a different type ifIDtypeis different fromresult_IDtype.- species
A character vector specifying the species for which the gene annotation databases should be prepared. Can be
"Homo_sapiens"or"Mus_musculus".- db
A character vector specifying the annotation sources to be included in the gene annotation databases. Can be one or more of
"GO", "GO_BP", "GO_CC", "GO_MF", "KEGG", "WikiPathway", "Reactome", "CORUM", "MP", "DO", "HPO", "PFAM", "CSPA", "Surfaceome", "SPRomeDB", "VerSeDa", "TFLink", "hTFtarget", "TRRUST", "JASPAR", "ENCODE", "MSigDB", "CellTalk", "CellChat", "Chromosome", "GeneType", "Enzyme", "TF", "CytoTRACE2". MSigDB subcollections can be requested as"MSigDB_<collection>", such as"MSigDB_H"for human Hallmark and"MSigDB_MH"for mouse Hallmark. Note:"CytoTRACE2"is species-independent and downloads pre-trained model data required by RunCytoTRACE.- db_update
Whether the gene annotation databases should be forcefully updated. If set to FALSE, the function will attempt to load the cached databases instead. Default is
FALSE.- db_version
A character vector specifying the version of the gene annotation databases to be retrieved. Default is
"latest".- convert_species
Whether to use a species-converted database when the annotation is missing for the specified species. Default is
TRUE.- Ensembl_version
An integer specifying the Ensembl version. Default is
NULL. IfNULL, the latest version will be used.- mirror
Specify an Ensembl mirror to connect to. The valid options here are
"www","uswest","useast","asia".- features
A named list of feature lists for custom enrichment gene sets. If provided, it takes precedence over
TERM2GENEanddb.- TERM2GENE
A data frame specifying the gene-term mapping for a custom database. The first column should contain the term IDs, and the second column should contain the gene IDs.
- TERM2NAME
A data frame specifying the term-name mapping for a custom database. The first column should contain the term IDs, and the second column should contain the corresponding term names.
- minGSSize
The minimum size of a gene set to be considered in the enrichment analysis.
- maxGSSize
The maximum size of a gene set to be considered in the enrichment analysis.
- backend
Enrichment backend.
"cpp"is the default and uses a fast native hypergeometric ORA implementation and returns the enrichment table withoutenrichResultobjects."r"usesclusterProfiler::enricher()and returnsenrichResultobjects inresults.GO_simplify = TRUEcurrently uses the R backend.- cpp_strategy
AUCell scoring strategy used when
backend = "cpp"."sparse"ranks non-zero genes and approximates zero ties without densifying the expression matrix."aucell"calls the officialAUCell::AUCell_buildRankings()andAUCell::AUCell_calcAUC()path for exact consistency with the R backend,"topk"ranks only genes that can contribute to AUCell AUC, and"full"ranks all genes.- cores
The number of cores to use for parallelization with foreach::foreach. Default is
1.- verbose
Whether to print the message. Default is
TRUE.- seed
Random seed for reproducibility. Default is
11.- ...
Passed to other functions.
Examples
data(pancreas_sub)
pancreas_sub <- standard_scop(pancreas_sub)
#> ℹ [2026-07-02 09:39:27] Start standard processing workflow...
#> ℹ [2026-07-02 09:39:28] Checking a list of <Seurat>...
#> ! [2026-07-02 09:39:28] Data 1/1 of the `srt_list` is "unknown"
#> ℹ [2026-07-02 09:39:28] Perform `NormalizeData()` with `normalization.method = 'LogNormalize'` on 1/1 of `srt_list`...
#> ℹ [2026-07-02 09:39:28] Perform `FindVariableFeatures()` on 1/1 of `srt_list`...
#> ℹ [2026-07-02 09:39:28] Use the separate HVF from `srt_list`
#> ℹ [2026-07-02 09:39:28] Number of available HVF: 2000
#> ℹ [2026-07-02 09:39:28] Finished check
#> ℹ [2026-07-02 09:39:28] Perform `ScaleData()`
#> ℹ [2026-07-02 09:39:28] Perform pca linear dimension reduction
#> ℹ [2026-07-02 09:39:29] Use stored estimated dimensions 1:23 for Standardpca
#> ℹ [2026-07-02 09:39:29] Perform `Seurat::FindClusters()` with `cluster_algorithm = 'louvain'` and `cluster_resolution = 0.6`
#> ℹ [2026-07-02 09:39:29] Reorder clusters...
#> ℹ [2026-07-02 09:39:30] Skip `log1p()` because `layer = data` is not "counts"
#> ℹ [2026-07-02 09:39:30] Perform umap nonlinear dimension reduction
#> ✔ [2026-07-02 09:39:36] Standard processing workflow completed
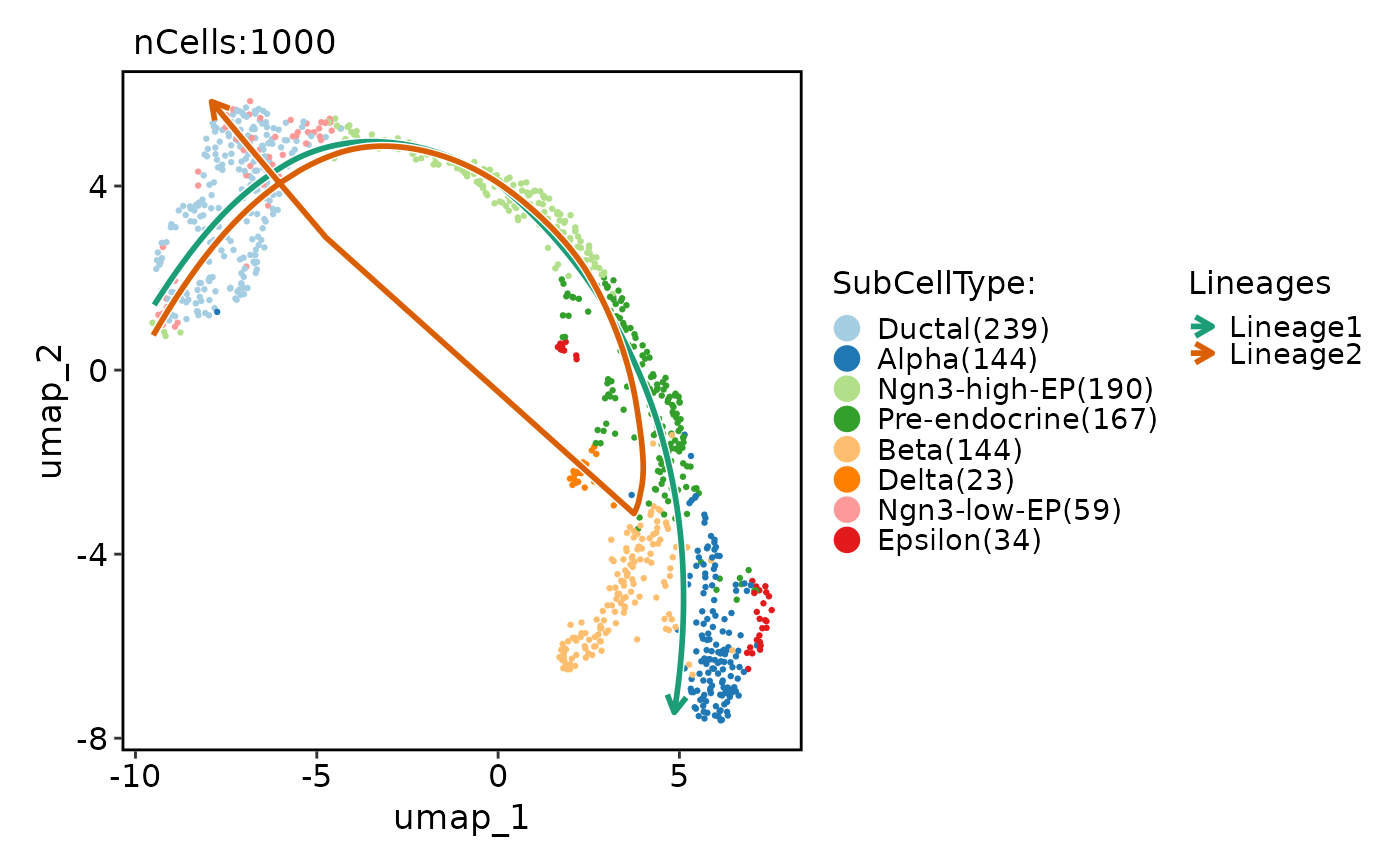
pancreas_sub <- RunSlingshot(
pancreas_sub,
group.by = "CellType",
reduction = "UMAP"
)
#> Warning: Removed 17 rows containing missing values or values outside the scale range
#> (`geom_path()`).
#> Warning: Removed 17 rows containing missing values or values outside the scale range
#> (`geom_path()`).
 pancreas_sub <- RunDynamicFeatures(
pancreas_sub,
lineages = "Lineage1",
fit_method = "pretsa",
n_candidates = 200
)
#> ℹ [2026-07-02 09:39:37] Start find dynamic features
#> ℹ [2026-07-02 09:39:38] Data type is raw counts
#> ℹ [2026-07-02 09:39:38] Number of candidate features (union): 200
#> ℹ [2026-07-02 09:39:38] Data type is raw counts
#> ℹ [2026-07-02 09:39:38] Calculating dynamic features for "Lineage1"...
#> ✔ [2026-07-02 09:39:39] Find dynamic features done
ht1 <- DynamicHeatmap(
pancreas_sub,
lineages = "Lineage1",
cell_annotation = "CellType",
n_split = 3
)
#> ℹ [2026-07-02 09:39:39] [1] 134 features from Lineage1 passed the threshold (exp_ncells>[1] 20 & r.sq>[1] 0.2 & dev.expl>[1] 0.2 & padjust<[1] 0.05):
#> ℹ Ins1,Ins2,Nnat,Iapp,Lrpprc,Npy,Chgb,Slc38a5,2810417H13Rik,Rbp4...
#> ℹ [2026-07-02 09:39:40]
#> ℹ The size of the heatmap is fixed because certain elements are not scalable.
#> ℹ The width and height of the heatmap are determined by the size of the current viewport.
#> ℹ If you want to have more control over the size, you can manually set the parameters 'width' and 'height'.
pancreas_sub <- RunDynamicEnrichment(
pancreas_sub,
lineages = "Lineage1",
score_method = "AUCell",
db = "GO_BP",
species = "Mus_musculus"
)
#> ℹ [2026-07-02 09:39:41] Species: "Mus_musculus"
#> ℹ [2026-07-02 09:39:41] Loading cached: GO_BP version: 3.23.0 nterm:14957 created: 2026-07-02 08:59:44
#> ℹ [2026-07-02 09:39:44] Start cell scoring
#> ℹ [2026-07-02 09:39:44] Data type is log-normalized
#> ℹ [2026-07-02 09:39:45] Number of feature lists to be scored: 2729
#> Warning: Feature names cannot have underscores ('_'), replacing with dashes ('-')
#> Warning: Feature names cannot have underscores ('_'), replacing with dashes ('-')
#> ✔ [2026-07-02 09:39:52] Cell scoring completed
#> ℹ [2026-07-02 09:39:52] Start find dynamic features
#> ℹ [2026-07-02 09:39:53] Data type is log-normalized
#> ℹ [2026-07-02 09:39:53] Number of candidate features (union): 2729
#> ℹ [2026-07-02 09:39:53] Data type is log-normalized
#> ℹ [2026-07-02 09:39:53] Calculating dynamic features for "Lineage1"...
#> ℹ [2026-07-02 09:39:53] Using 1 core
#> ⠙ [2026-07-02 09:39:53] Running for GO-BP-2..deoxyribonucleotide.biosynthetic.p…
#> ⠹ [2026-07-02 09:39:53] Running for GO-BP-anterior.posterior.axis.specification…
#> ⠸ [2026-07-02 09:39:53] Running for GO-BP-cellular.response.to.glucose.stimulus…
#> ⠼ [2026-07-02 09:39:53] Running for GO-BP-endochondral.bone.morphogenesis [518/…
#> ⠴ [2026-07-02 09:39:53] Running for GO-BP-hindbrain.development [705/2729] ■■ …
#> ⠦ [2026-07-02 09:39:53] Running for GO-BP-meiosis.I [891/2729] ■■■ 33% …
#> ⠧ [2026-07-02 09:39:53] Running for GO-BP-negative.regulation.of.blood.coagulat…
#> ⠇ [2026-07-02 09:39:53] Running for GO-BP-negative.regulation.of.small.molecule…
#> ⠏ [2026-07-02 09:39:53] Running for GO-BP-photoperiodism [1453/2729] ■■■■■ …
#> ⠋ [2026-07-02 09:39:53] Running for GO-BP-positive.regulation.of.molecular.func…
#> ⠙ [2026-07-02 09:39:53] Running for GO-BP-protein.containing.complex.disassembl…
#> ⠹ [2026-07-02 09:39:53] Running for GO-BP-regulation.of.cyclin.dependent.protei…
#> ⠸ [2026-07-02 09:39:53] Running for GO-BP-regulation.of.nervous.system.process …
#> ⠼ [2026-07-02 09:39:53] Running for GO-BP-renal.system.vasculature.development …
#> ⠴ [2026-07-02 09:39:53] Running for GO-BP-specification.of.animal.organ.identit…
#> ✔ [2026-07-02 09:39:53] Completed 2729 tasks in 43.7s
#>
#> ℹ [2026-07-02 09:39:53] Building results
#> ✔ [2026-07-02 09:40:37] Find dynamic features done
#> ✔ [2026-07-02 09:40:37] Dynamic enrichment analysis completed
ht2 <- DynamicHeatmap(
pancreas_sub,
assay = "GO_BP",
lineages = "Lineage1_GO_BP",
cell_annotation = "CellType",
n_split = 3,
split_method = "kmeans-peaktime"
)
#> ℹ [2026-07-02 09:40:37] [1] 1893 features from Lineage1_GO_BP passed the threshold (exp_ncells>[1] 20 & r.sq>[1] 0.2 & dev.expl>[1] 0.2 & padjust<[1] 0.05):
#> ℹ GO-BP-2..deoxyribonucleotide.biosynthetic.process,GO-BP-2..deoxyribonucleotide.metabolic.process,GO-BP-ADP.catabolic.process,GO-BP-ADP.metabolic.process,GO-BP-ATP.metabolic.process,GO-BP-ATP.synthesis.coupled.electron.transport,GO-BP-B.cell.activation,GO-BP-B.cell.proliferation,GO-BP-CENP.A.containing.chromatin.assembly,GO-BP-D.glucose.import.across.plasma.membrane...
#> ! [2026-07-02 09:40:37] The values in the 'counts' layer are non-integer. Set the library size to 1.
#> ℹ [2026-07-02 09:40:38]
#> ℹ The size of the heatmap is fixed because certain elements are not scalable.
#> ℹ The width and height of the heatmap are determined by the size of the current viewport.
#> ℹ If you want to have more control over the size, you can manually set the parameters 'width' and 'height'.
pancreas_sub <- RunDynamicFeatures(
pancreas_sub,
lineages = "Lineage1",
fit_method = "pretsa",
n_candidates = 200
)
#> ℹ [2026-07-02 09:39:37] Start find dynamic features
#> ℹ [2026-07-02 09:39:38] Data type is raw counts
#> ℹ [2026-07-02 09:39:38] Number of candidate features (union): 200
#> ℹ [2026-07-02 09:39:38] Data type is raw counts
#> ℹ [2026-07-02 09:39:38] Calculating dynamic features for "Lineage1"...
#> ✔ [2026-07-02 09:39:39] Find dynamic features done
ht1 <- DynamicHeatmap(
pancreas_sub,
lineages = "Lineage1",
cell_annotation = "CellType",
n_split = 3
)
#> ℹ [2026-07-02 09:39:39] [1] 134 features from Lineage1 passed the threshold (exp_ncells>[1] 20 & r.sq>[1] 0.2 & dev.expl>[1] 0.2 & padjust<[1] 0.05):
#> ℹ Ins1,Ins2,Nnat,Iapp,Lrpprc,Npy,Chgb,Slc38a5,2810417H13Rik,Rbp4...
#> ℹ [2026-07-02 09:39:40]
#> ℹ The size of the heatmap is fixed because certain elements are not scalable.
#> ℹ The width and height of the heatmap are determined by the size of the current viewport.
#> ℹ If you want to have more control over the size, you can manually set the parameters 'width' and 'height'.
pancreas_sub <- RunDynamicEnrichment(
pancreas_sub,
lineages = "Lineage1",
score_method = "AUCell",
db = "GO_BP",
species = "Mus_musculus"
)
#> ℹ [2026-07-02 09:39:41] Species: "Mus_musculus"
#> ℹ [2026-07-02 09:39:41] Loading cached: GO_BP version: 3.23.0 nterm:14957 created: 2026-07-02 08:59:44
#> ℹ [2026-07-02 09:39:44] Start cell scoring
#> ℹ [2026-07-02 09:39:44] Data type is log-normalized
#> ℹ [2026-07-02 09:39:45] Number of feature lists to be scored: 2729
#> Warning: Feature names cannot have underscores ('_'), replacing with dashes ('-')
#> Warning: Feature names cannot have underscores ('_'), replacing with dashes ('-')
#> ✔ [2026-07-02 09:39:52] Cell scoring completed
#> ℹ [2026-07-02 09:39:52] Start find dynamic features
#> ℹ [2026-07-02 09:39:53] Data type is log-normalized
#> ℹ [2026-07-02 09:39:53] Number of candidate features (union): 2729
#> ℹ [2026-07-02 09:39:53] Data type is log-normalized
#> ℹ [2026-07-02 09:39:53] Calculating dynamic features for "Lineage1"...
#> ℹ [2026-07-02 09:39:53] Using 1 core
#> ⠙ [2026-07-02 09:39:53] Running for GO-BP-2..deoxyribonucleotide.biosynthetic.p…
#> ⠹ [2026-07-02 09:39:53] Running for GO-BP-anterior.posterior.axis.specification…
#> ⠸ [2026-07-02 09:39:53] Running for GO-BP-cellular.response.to.glucose.stimulus…
#> ⠼ [2026-07-02 09:39:53] Running for GO-BP-endochondral.bone.morphogenesis [518/…
#> ⠴ [2026-07-02 09:39:53] Running for GO-BP-hindbrain.development [705/2729] ■■ …
#> ⠦ [2026-07-02 09:39:53] Running for GO-BP-meiosis.I [891/2729] ■■■ 33% …
#> ⠧ [2026-07-02 09:39:53] Running for GO-BP-negative.regulation.of.blood.coagulat…
#> ⠇ [2026-07-02 09:39:53] Running for GO-BP-negative.regulation.of.small.molecule…
#> ⠏ [2026-07-02 09:39:53] Running for GO-BP-photoperiodism [1453/2729] ■■■■■ …
#> ⠋ [2026-07-02 09:39:53] Running for GO-BP-positive.regulation.of.molecular.func…
#> ⠙ [2026-07-02 09:39:53] Running for GO-BP-protein.containing.complex.disassembl…
#> ⠹ [2026-07-02 09:39:53] Running for GO-BP-regulation.of.cyclin.dependent.protei…
#> ⠸ [2026-07-02 09:39:53] Running for GO-BP-regulation.of.nervous.system.process …
#> ⠼ [2026-07-02 09:39:53] Running for GO-BP-renal.system.vasculature.development …
#> ⠴ [2026-07-02 09:39:53] Running for GO-BP-specification.of.animal.organ.identit…
#> ✔ [2026-07-02 09:39:53] Completed 2729 tasks in 43.7s
#>
#> ℹ [2026-07-02 09:39:53] Building results
#> ✔ [2026-07-02 09:40:37] Find dynamic features done
#> ✔ [2026-07-02 09:40:37] Dynamic enrichment analysis completed
ht2 <- DynamicHeatmap(
pancreas_sub,
assay = "GO_BP",
lineages = "Lineage1_GO_BP",
cell_annotation = "CellType",
n_split = 3,
split_method = "kmeans-peaktime"
)
#> ℹ [2026-07-02 09:40:37] [1] 1893 features from Lineage1_GO_BP passed the threshold (exp_ncells>[1] 20 & r.sq>[1] 0.2 & dev.expl>[1] 0.2 & padjust<[1] 0.05):
#> ℹ GO-BP-2..deoxyribonucleotide.biosynthetic.process,GO-BP-2..deoxyribonucleotide.metabolic.process,GO-BP-ADP.catabolic.process,GO-BP-ADP.metabolic.process,GO-BP-ATP.metabolic.process,GO-BP-ATP.synthesis.coupled.electron.transport,GO-BP-B.cell.activation,GO-BP-B.cell.proliferation,GO-BP-CENP.A.containing.chromatin.assembly,GO-BP-D.glucose.import.across.plasma.membrane...
#> ! [2026-07-02 09:40:37] The values in the 'counts' layer are non-integer. Set the library size to 1.
#> ℹ [2026-07-02 09:40:38]
#> ℹ The size of the heatmap is fixed because certain elements are not scalable.
#> ℹ The width and height of the heatmap are determined by the size of the current viewport.
#> ℹ If you want to have more control over the size, you can manually set the parameters 'width' and 'height'.