Visualizes data using various plot types such as bar plots, rose plots, ring plots, pie charts, trend plots, area plots, dot plots, sankey plots, chord plots, venn diagrams, and upset plots.
Usage
StatPlot(
  meta.data,
  stat.by,
  group.by = NULL,
  split.by = NULL,
  bg.by = NULL,
  flip = FALSE,
  NA_color = "grey",
  NA_stat = TRUE,
  keep_empty = FALSE,
  individual = FALSE,
  stat_level = NULL,
  plot_type = c("bar", "rose", "ring", "pie", "trend", "area", "dot", "sankey", "chord",
    "venn", "upset"),
  stat_type = c("percent", "count"),
  position = c("stack", "dodge"),
  palette = "Paired",
  palcolor = NULL,
  alpha = 1,
  bg_palette = "Paired",
  bg_palcolor = NULL,
  bg_alpha = 0.2,
  label = FALSE,
  label.size = 3.5,
  label.fg = "black",
  label.bg = "white",
  label.bg.r = 0.1,
  aspect.ratio = NULL,
  title = NULL,
  subtitle = NULL,
  xlab = NULL,
  ylab = NULL,
  legend.position = "right",
  legend.direction = "vertical",
  theme_use = "theme_scop",
  theme_args = list(),
  combine = TRUE,
  nrow = NULL,
  ncol = NULL,
  byrow = TRUE,
  force = FALSE,
  seed = 11
)
Arguments
- meta.data
The data frame containing the data to be plotted.
- stat.by
The column name(s) in
meta.dataspecifying the variable(s) to be plotted.- group.by
Name of one or more meta.data columns to group (color) cells by.
- split.by
Name of a column in meta.data column to split plot by. Default is
NULL.- bg.by
The column name in
meta.dataspecifying the background variable for bar plots.- flip
Whether to flip the plot. Default is
FALSE.- NA_color
The color to use for missing values.
- NA_stat
Whether to include missing values in the plot. Default is
TRUE.- keep_empty
Whether to keep empty groups in the plot. Default is
FALSE.- individual
Whether to plot individual groups separately. Default is
FALSE.- stat_level
The level(s) of the variable(s) specified in
stat.byto include in the plot. Default isNULL.- plot_type
The type of plot to create. Can be one of
"bar","rose","ring","pie","trend","area","dot","sankey","chord","venn", or"upset".- stat_type
The type of statistic to compute for the plot. Can be one of
"percent"or"count".- position
The position adjustment for the plot. Can be one of
"stack"or"dodge".- palette
Color palette name. Available palettes can be found in thisplot::show_palettes. Default is
"Paired".- palcolor
Custom colors used to create a color palette. Default is
NULL.- alpha
The transparency level for the plot.
- bg_palette
The name of the background color palette to use for bar plots.
- bg_palcolor
The color to use in the background color palette.
- bg_alpha
The transparency level for the background color in bar plots.
- label
Whether to add labels on the plot. Default is
FALSE.- label.size
The size of the labels.
- label.fg
The foreground color of the labels.
- label.bg
The background color of the labels.
- label.bg.r
The radius of the rounded corners of the label background.
- aspect.ratio
Aspect ratio of the panel. Default is
NULL.- title
The text for the title. Default is
NULL.- subtitle
The text for the subtitle for the plot which will be displayed below the title. Default is
NULL.- xlab
The x-axis label of the plot. Default is
NULL.- ylab
The y-axis label of the plot. Default is
NULL.- legend.position
The position of legends, one of
"none","left","right","bottom","top". Default is"right".- legend.direction
The direction of the legend in the plot. Can be one of
"vertical"or"horizontal".- theme_use
Theme used. Can be a character string or a theme function. Default is
"theme_scop".- theme_args
Other arguments passed to the
theme_use. Default islist().- combine
Combine plots into a single
patchworkobject. IfFALSE, return a list of ggplot objects.- nrow
Number of rows in the combined plot. Default is
NULL, which means determined automatically based on the number of plots.- ncol
Number of columns in the combined plot. Default is
NULL, which means determined automatically based on the number of plots.- byrow
Whether to arrange the plots by row in the combined plot. Default is
TRUE.- force
Whether to force drawing regardless of maximum levels in any cell group is greater than 100. Default is
FALSE.- seed
Random seed for reproducibility. Default is
11.
Examples
data(pancreas_sub)
pancreas_sub <- standard_scop(pancreas_sub)
#> ℹ [2026-02-11 04:19:53] Start standard scop workflow...
#> ℹ [2026-02-11 04:19:54] Checking a list of <Seurat>...
#> ! [2026-02-11 04:19:54] Data 1/1 of the `srt_list` is "unknown"
#> ℹ [2026-02-11 04:19:54] Perform `NormalizeData()` with `normalization.method = 'LogNormalize'` on the data 1/1 of the `srt_list`...
#> ℹ [2026-02-11 04:19:56] Perform `Seurat::FindVariableFeatures()` on the data 1/1 of the `srt_list`...
#> ℹ [2026-02-11 04:19:57] Use the separate HVF from srt_list
#> ℹ [2026-02-11 04:19:57] Number of available HVF: 2000
#> ℹ [2026-02-11 04:19:57] Finished check
#> ℹ [2026-02-11 04:19:57] Perform `Seurat::ScaleData()`
#> ℹ [2026-02-11 04:19:58] Perform pca linear dimension reduction
#> ℹ [2026-02-11 04:19:59] Perform `Seurat::FindClusters()` with `cluster_algorithm = 'louvain'` and `cluster_resolution = 0.6`
#> ℹ [2026-02-11 04:19:59] Reorder clusters...
#> ℹ [2026-02-11 04:19:59] Perform umap nonlinear dimension reduction
#> ℹ [2026-02-11 04:19:59] Non-linear dimensionality reduction (umap) using (Standardpca) dims (1-50) as input
#> ℹ [2026-02-11 04:20:03] Non-linear dimensionality reduction (umap) using (Standardpca) dims (1-50) as input
#> ✔ [2026-02-11 04:20:08] Run scop standard workflow completed
meta.data <- pancreas_sub@meta.data
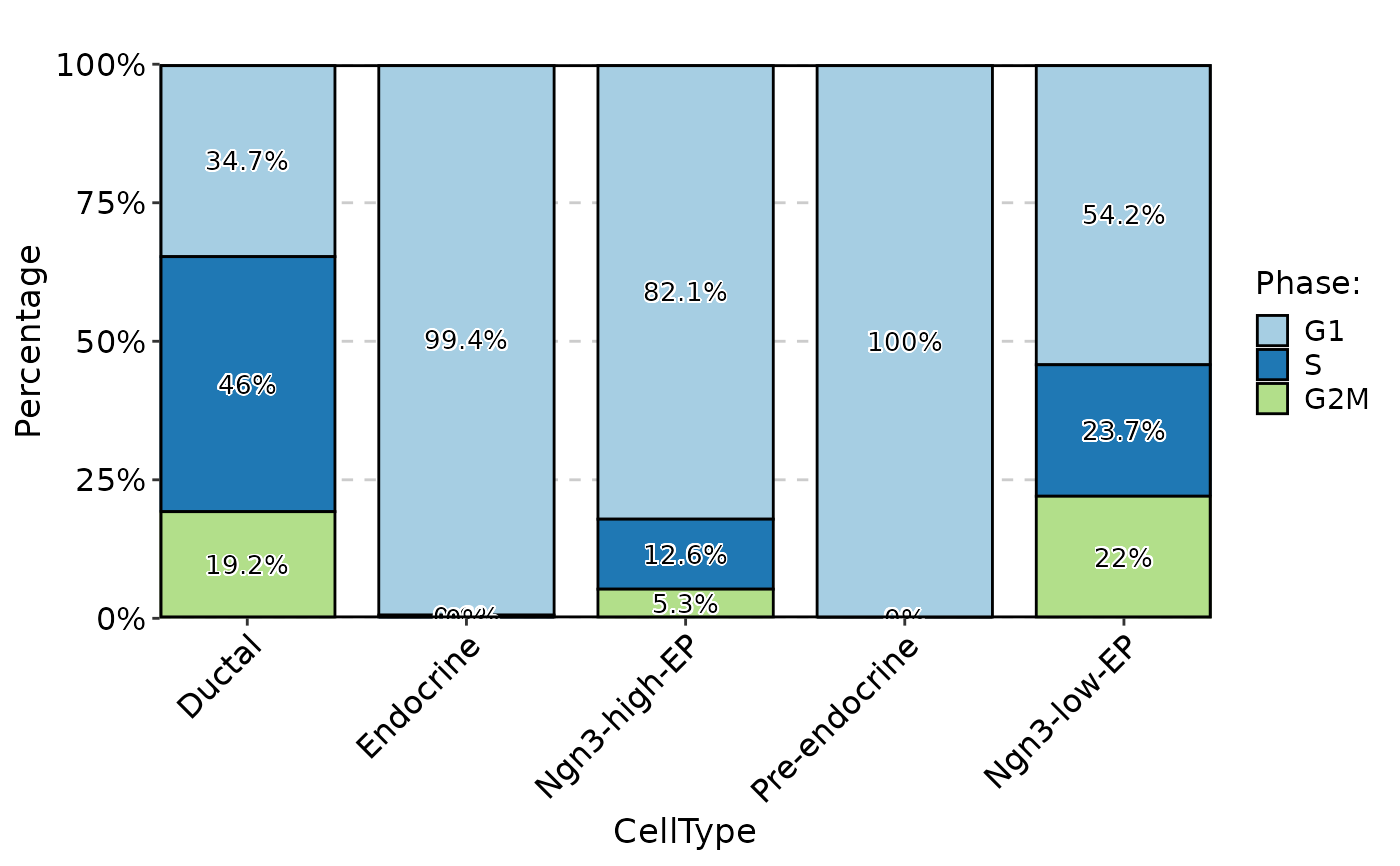
StatPlot(
meta.data,
stat.by = "Phase",
group.by = "CellType",
plot_type = "bar",
label = TRUE
)
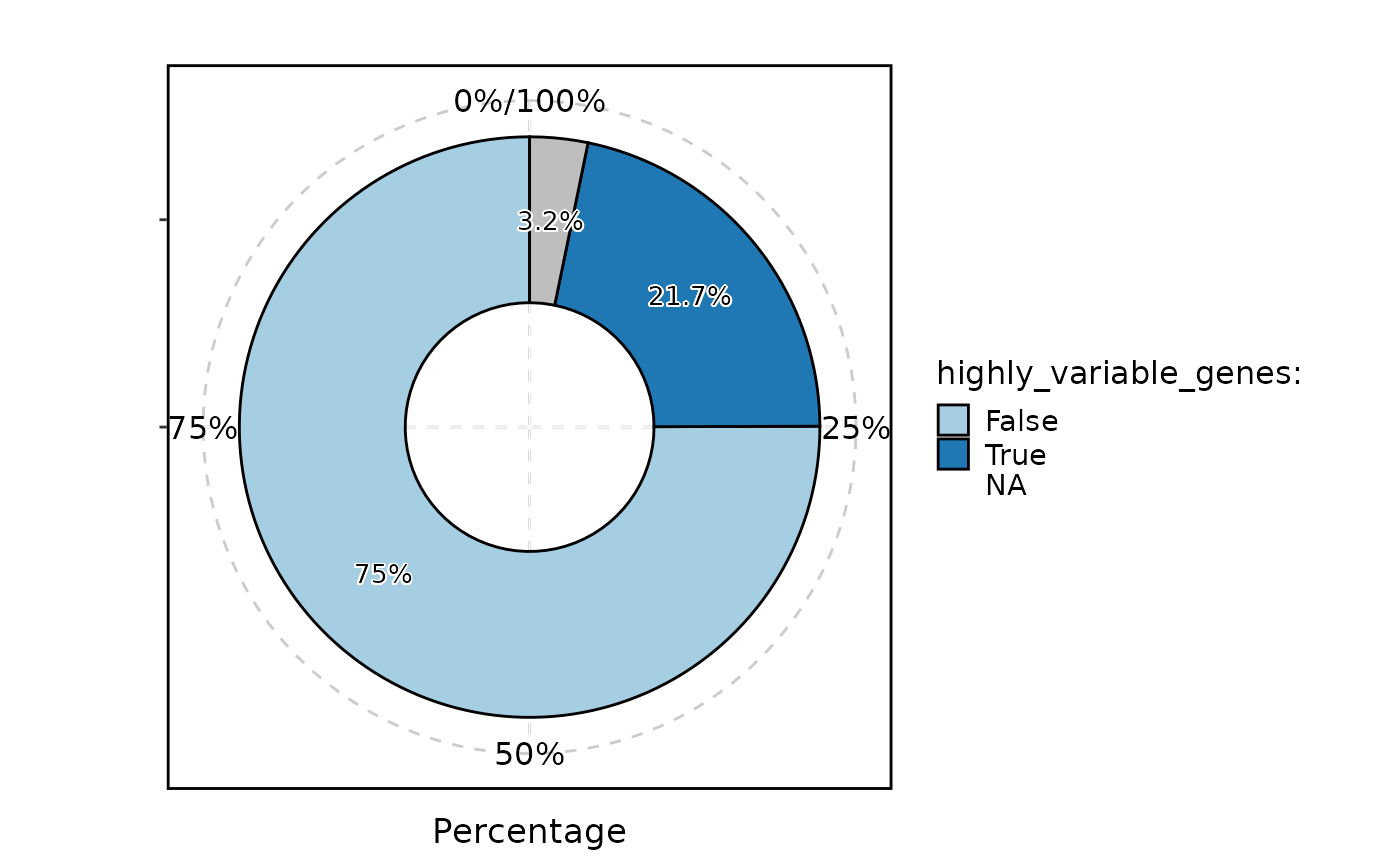
 StatPlot(
GetFeaturesData(pancreas_sub, "RNA"),
stat.by = "highly_variable_genes",
plot_type = "ring",
label = TRUE,
NA_stat = FALSE
)
StatPlot(
GetFeaturesData(pancreas_sub, "RNA"),
stat.by = "highly_variable_genes",
plot_type = "ring",
label = TRUE,
NA_stat = FALSE
)
 if (FALSE) { # \dontrun{
pancreas_sub <- AnnotateFeatures(
pancreas_sub,
species = "Mus_musculus",
IDtype = "symbol",
db = c("CSPA", "TF")
)
StatPlot(
GetFeaturesData(pancreas_sub, "RNA"),
stat.by = "TF",
group.by = "CSPA",
stat_type = "count",
plot_type = "bar",
position = "dodge",
label = TRUE,
NA_stat = FALSE
)
} # }
if (FALSE) { # \dontrun{
pancreas_sub <- AnnotateFeatures(
pancreas_sub,
species = "Mus_musculus",
IDtype = "symbol",
db = c("CSPA", "TF")
)
StatPlot(
GetFeaturesData(pancreas_sub, "RNA"),
stat.by = "TF",
group.by = "CSPA",
stat_type = "count",
plot_type = "bar",
position = "dodge",
label = TRUE,
NA_stat = FALSE
)
} # }