Statistical plot of cells
Usage
CellStatPlot(
  srt,
  stat.by,
  group.by = NULL,
  split.by = NULL,
  bg.by = NULL,
  cells = NULL,
  flip = FALSE,
  NA_color = "grey",
  NA_stat = TRUE,
  keep_empty = FALSE,
  individual = FALSE,
  stat_level = NULL,
  plot_type = c("bar", "rose", "ring", "pie", "trend", "trend_alluvial", "area", "dot",
    "sankey", "chord", "venn", "upset"),
  stat_type = c("percent", "count"),
  position = c("stack", "dodge"),
  palette = "Chinese",
  palcolor = NULL,
  alpha = 1,
  bg_palette = "Chinese",
  bg_palcolor = NULL,
  bg_alpha = 0.2,
  label = FALSE,
  label.size = 3.5,
  label.fg = "black",
  label.bg = "white",
  label.bg.r = 0.1,
  aspect.ratio = NULL,
  title = NULL,
  subtitle = NULL,
  xlab = NULL,
  ylab = NULL,
  legend.position = "right",
  legend.direction = "vertical",
  theme_use = "theme_scop",
  theme_args = list(),
  x_text_angle = 45,
  grid_major = TRUE,
  grid_major_colour = "grey80",
  grid_major_linetype = 2,
  grid_major_linewidth = 0.3,
  combine = TRUE,
  nrow = NULL,
  ncol = NULL,
  byrow = TRUE,
  force = FALSE,
  seed = 11,
  ...
)
Arguments
- srt
A Seurat object.
- stat.by
A character vector specifying the features to plot.
- group.by
Name of one or more meta.data columns to group (color) cells by.
- split.by
Name of a column in meta.data column to split plot by. Default is
NULL.- bg.by
A character vector specifying the variable to use as the background color. Default is
NULL.- cells
A character vector of cell names to use. Default is
NULL.- flip
A logical specifying whether to flip the plot vertically. Default is
FALSE.- NA_color
The color to use for missing values.
- NA_stat
Whether to include missing values in the plot. Default is
TRUE.- keep_empty
Whether to keep empty levels in the plot. Default is
FALSE.- individual
Whether to create individual plots for each group. Default is
FALSE.- stat_level
The level(s) of the variable(s) specified in
stat.byto include in the plot. Default isNULL.- plot_type
The type of plot to create. Can be one of
"bar","rose","ring","pie","trend","trend_alluvial","area","dot","sankey","chord","venn", or"upset".- stat_type
The type of statistic to compute for the plot. Can be one of
"percent"or"count".- position
The position adjustment for the plot. Can be one of
"stack"or"dodge".- palette
Color palette name. Available palettes can be found in thisplot::show_palettes. Default is
"Chinese".- palcolor
Custom colors used to create a color palette. Default is
NULL.- alpha
The transparency of the plot. Default is
1.- bg_palette
A string specifying the color palette to use for the background. Default is
"Chinese".- bg_palcolor
A character vector specifying specific colors to use for the background. Default is
NULL.- bg_alpha
The transparency of the background. Default is
0.2.- label
Whether to add labels on the plot. Default is
FALSE.- label.size
The size of the labels.
- label.fg
The foreground color of the labels.
- label.bg
The background color of the labels.
- label.bg.r
The radius of the rounded corners of the label background.
- aspect.ratio
Aspect ratio of the panel. Default is
NULL.- title
The text for the title. Default is
NULL.- subtitle
The text for the subtitle for the plot which will be displayed below the title. Default is
NULL.- xlab
The x-axis label of the plot. Default is
NULL.- ylab
A string specifying the label of the y-axis. Default is
"Expression level".- legend.position
The position of legends, one of
"none","left","right","bottom","top". Default is"right".- legend.direction
The direction of the legend in the plot. Can be one of
"vertical"or"horizontal".- theme_use
Theme used. Can be a character string or a theme function. Default is
"theme_scop".- theme_args
Other arguments passed to the
theme_use. Default islist().- x_text_angle
Rotation angle for x-axis labels. Default is
45.- grid_major
Whether to show major panel grid lines. Default is
TRUE.- grid_major_colour
Color of major panel grid lines.
- grid_major_linetype
Linetype of major panel grid lines.
- grid_major_linewidth
Line width of major panel grid lines.
- combine
Combine plots into a single
patchworkobject. IfFALSE, return a list of ggplot objects.- nrow
Number of rows in the combined plot. Default is
NULL, which means determined automatically based on the number of plots.- ncol
Number of columns in the combined plot. Default is
NULL, which means determined automatically based on the number of plots.- byrow
Whether to arrange the plots by row in the combined plot. Default is
TRUE.- force
Whether to force drawing regardless of maximum levels in any cell group is greater than 100. Default is
FALSE.- seed
Random seed for reproducibility. Default is
11.- ...
Additional arguments passed to the other functions.
Examples
data(pancreas_sub)
pancreas_sub <- standard_scop(pancreas_sub)
#> ℹ [2026-07-02 08:31:21] Start standard processing workflow...
#> ℹ [2026-07-02 08:31:22] Checking a list of <Seurat>...
#> ! [2026-07-02 08:31:22] Data 1/1 of the `srt_list` is "unknown"
#> ℹ [2026-07-02 08:31:22] Perform `NormalizeData()` with `normalization.method = 'LogNormalize'` on 1/1 of `srt_list`...
#> ℹ [2026-07-02 08:31:22] Perform `FindVariableFeatures()` on 1/1 of `srt_list`...
#> ℹ [2026-07-02 08:31:22] Use the separate HVF from `srt_list`
#> ℹ [2026-07-02 08:31:22] Number of available HVF: 2000
#> ℹ [2026-07-02 08:31:22] Finished check
#> ℹ [2026-07-02 08:31:22] Perform `ScaleData()`
#> ℹ [2026-07-02 08:31:22] Perform pca linear dimension reduction
#> ℹ [2026-07-02 08:31:23] Use stored estimated dimensions 1:23 for Standardpca
#> ℹ [2026-07-02 08:31:23] Perform `Seurat::FindClusters()` with `cluster_algorithm = 'louvain'` and `cluster_resolution = 0.6`
#> ℹ [2026-07-02 08:31:23] Reorder clusters...
#> ℹ [2026-07-02 08:31:23] Skip `log1p()` because `layer = data` is not "counts"
#> ℹ [2026-07-02 08:31:23] Perform umap nonlinear dimension reduction
#> ✔ [2026-07-02 08:31:28] Standard processing workflow completed
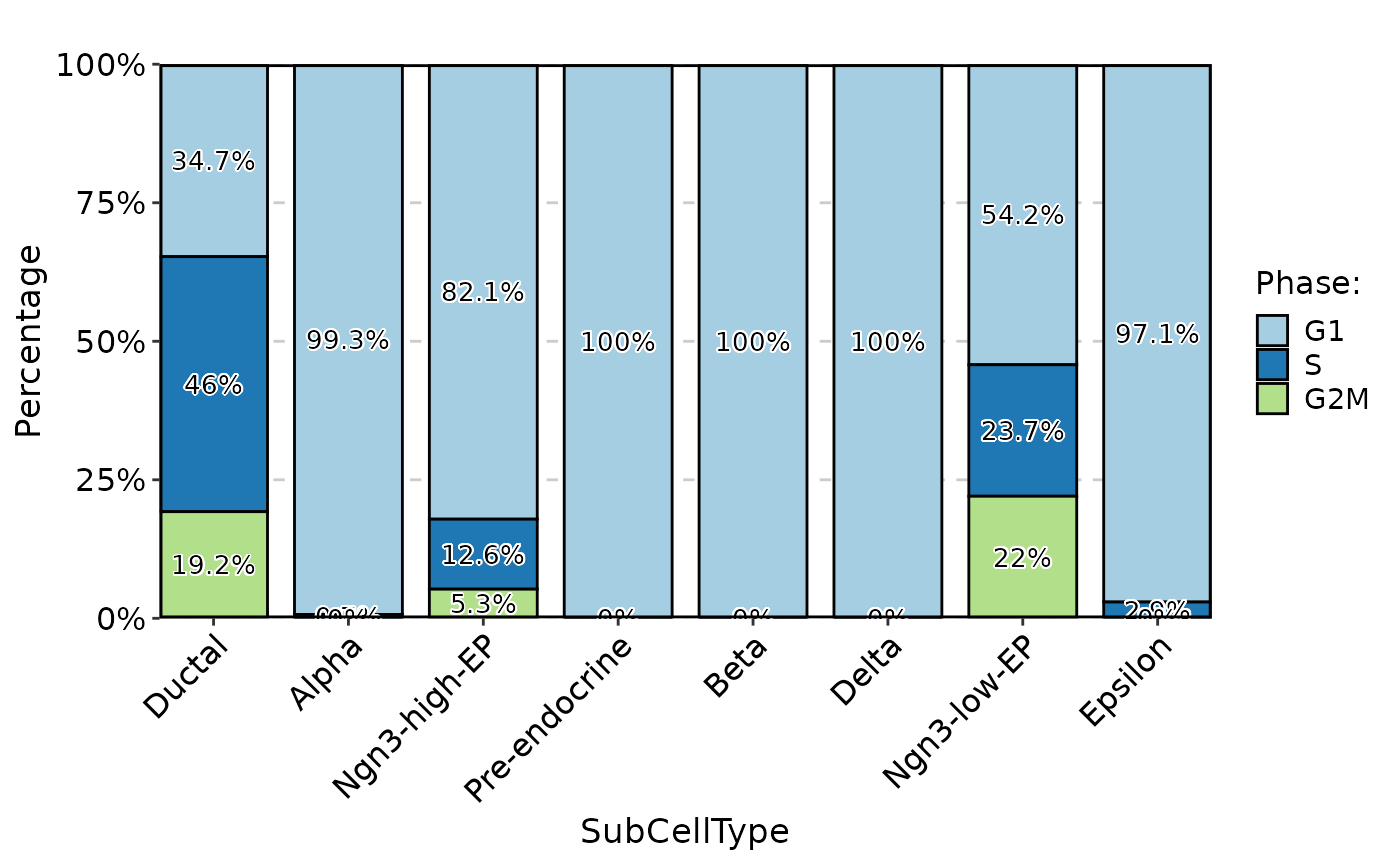
p1 <- CellStatPlot(
pancreas_sub,
stat.by = "Phase",
group.by = "SubCellType",
label = TRUE
)
p1
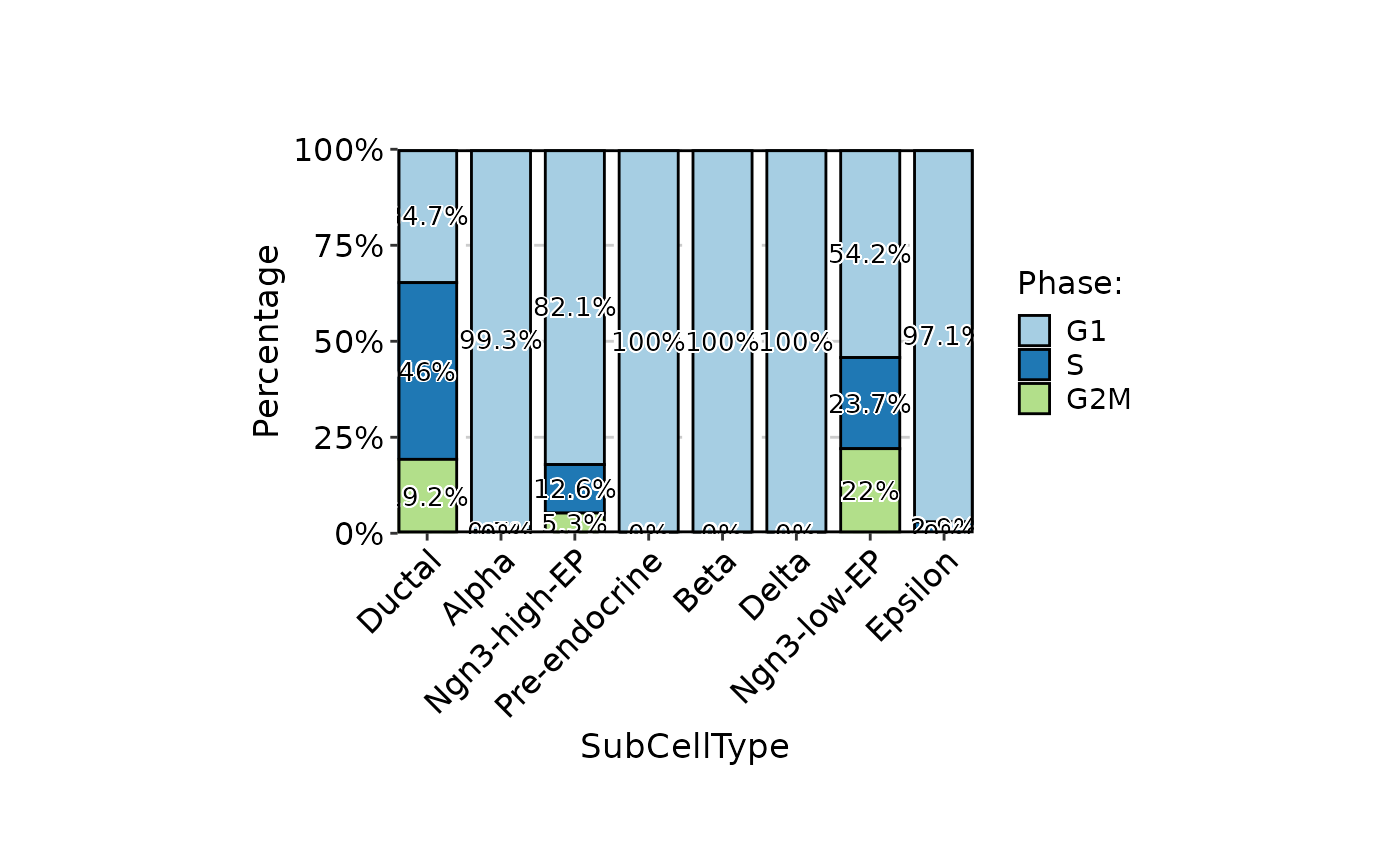
 thisplot::panel_fix(
p1,
height = 2, width = 3
)
thisplot::panel_fix(
p1,
height = 2, width = 3
)
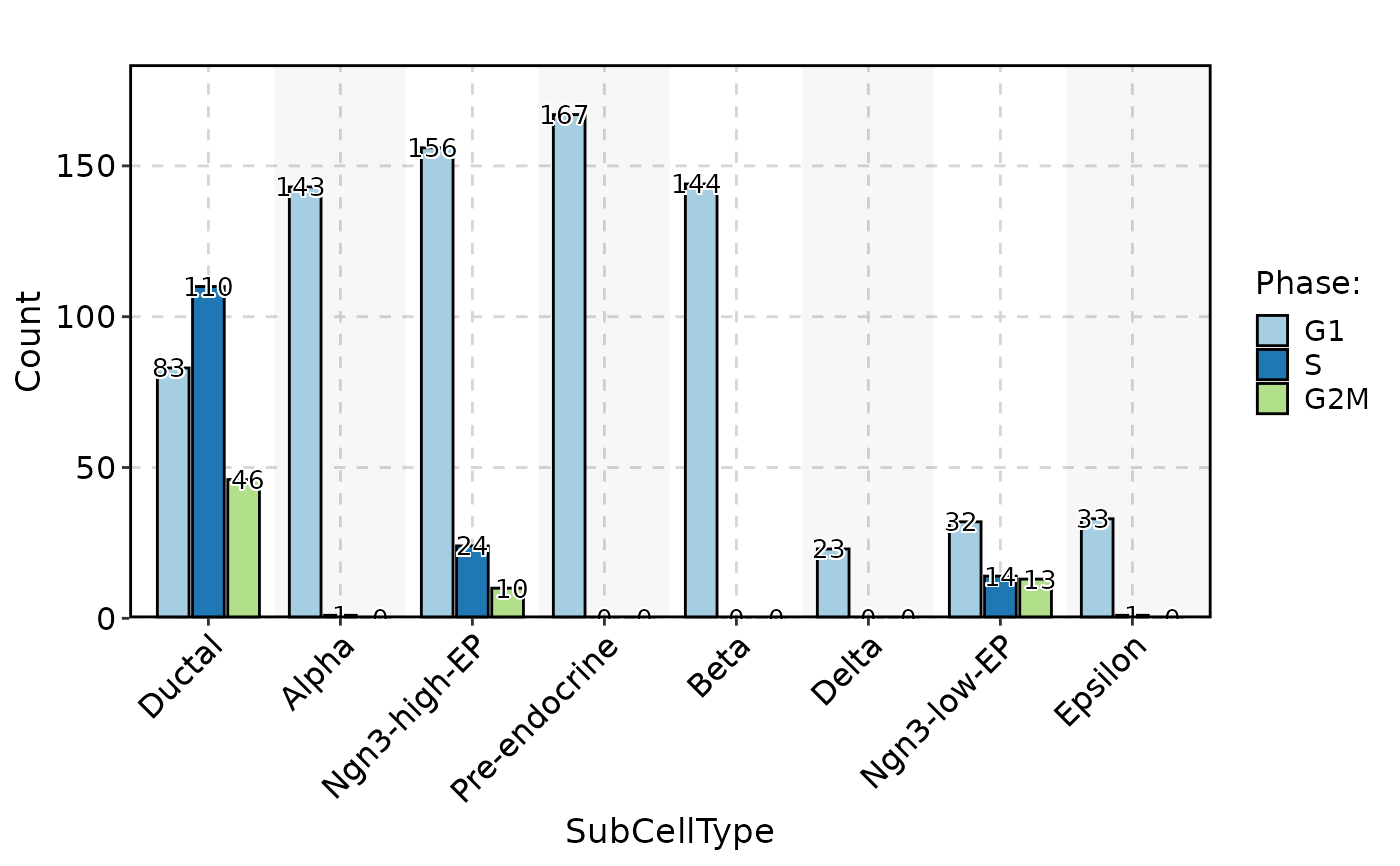
 CellStatPlot(
pancreas_sub,
stat.by = "Phase",
group.by = "SubCellType",
stat_type = "count",
position = "dodge",
label = TRUE
)
CellStatPlot(
pancreas_sub,
stat.by = "Phase",
group.by = "SubCellType",
stat_type = "count",
position = "dodge",
label = TRUE
)
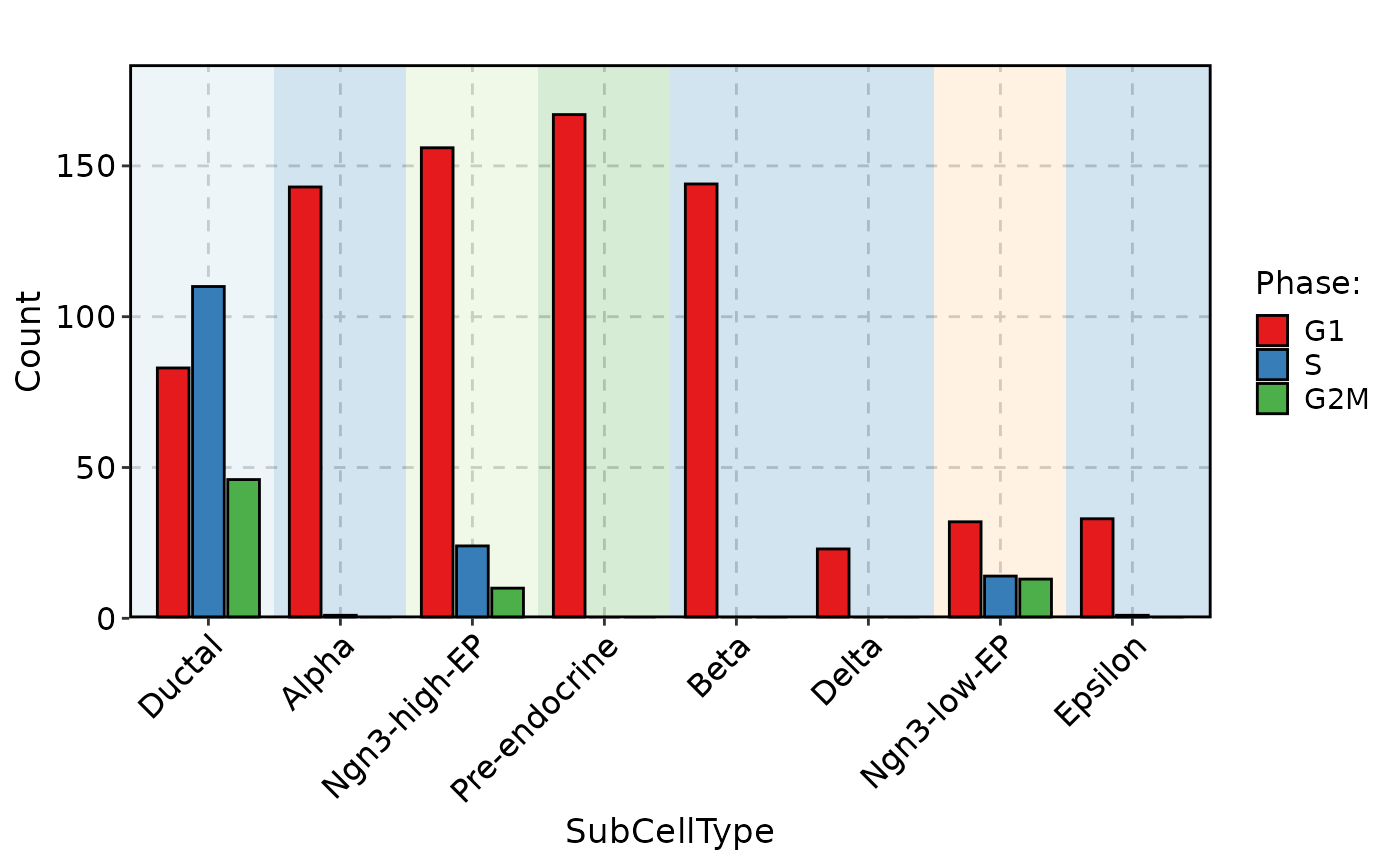
 CellStatPlot(
pancreas_sub,
stat.by = "Phase",
group.by = "SubCellType",
bg.by = "CellType",
palette = "Set1",
stat_type = "count",
position = "dodge"
)
CellStatPlot(
pancreas_sub,
stat.by = "Phase",
group.by = "SubCellType",
bg.by = "CellType",
palette = "Set1",
stat_type = "count",
position = "dodge"
)
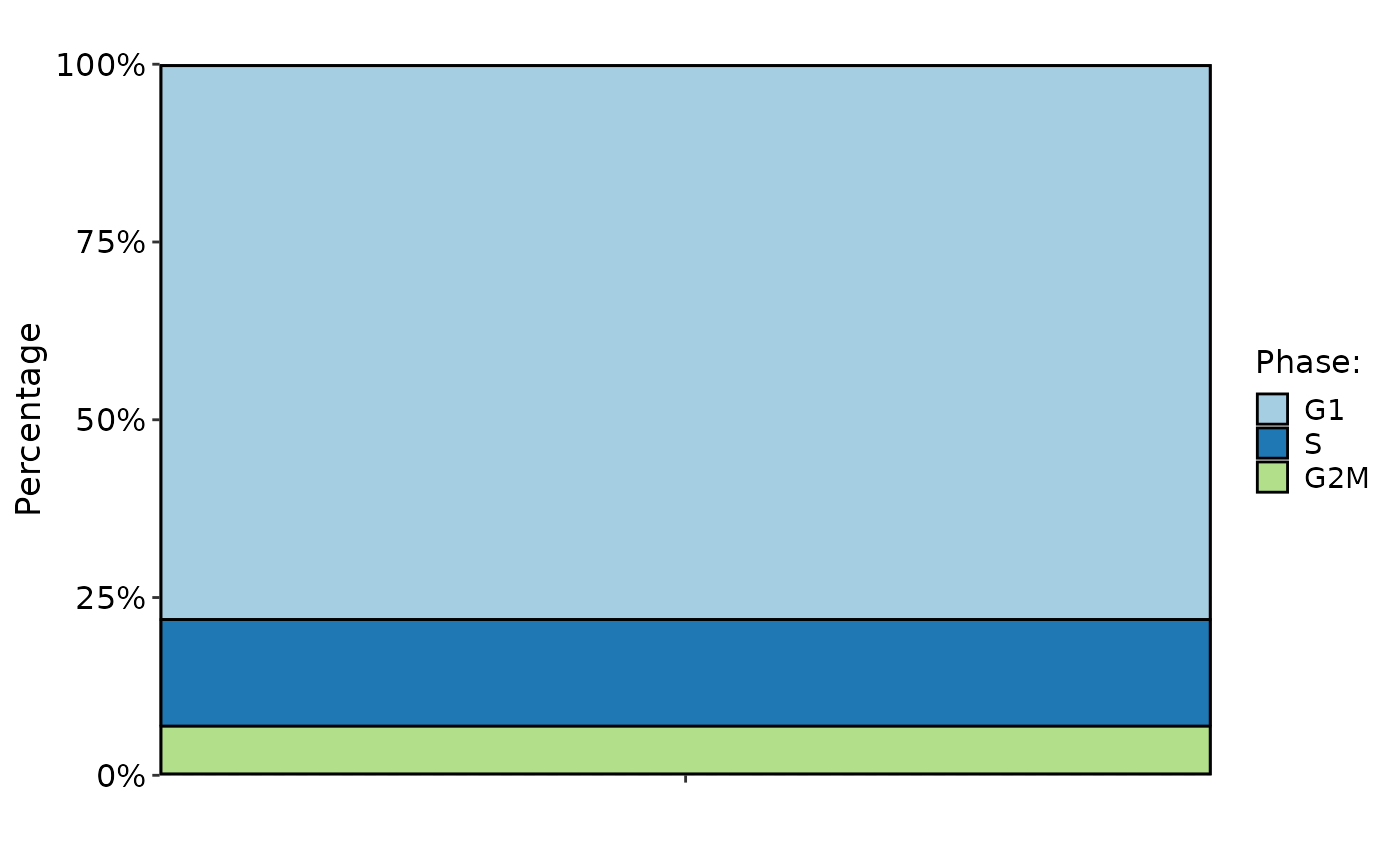
 CellStatPlot(
pancreas_sub,
stat.by = "Phase",
plot_type = "bar"
)
CellStatPlot(
pancreas_sub,
stat.by = "Phase",
plot_type = "bar"
)
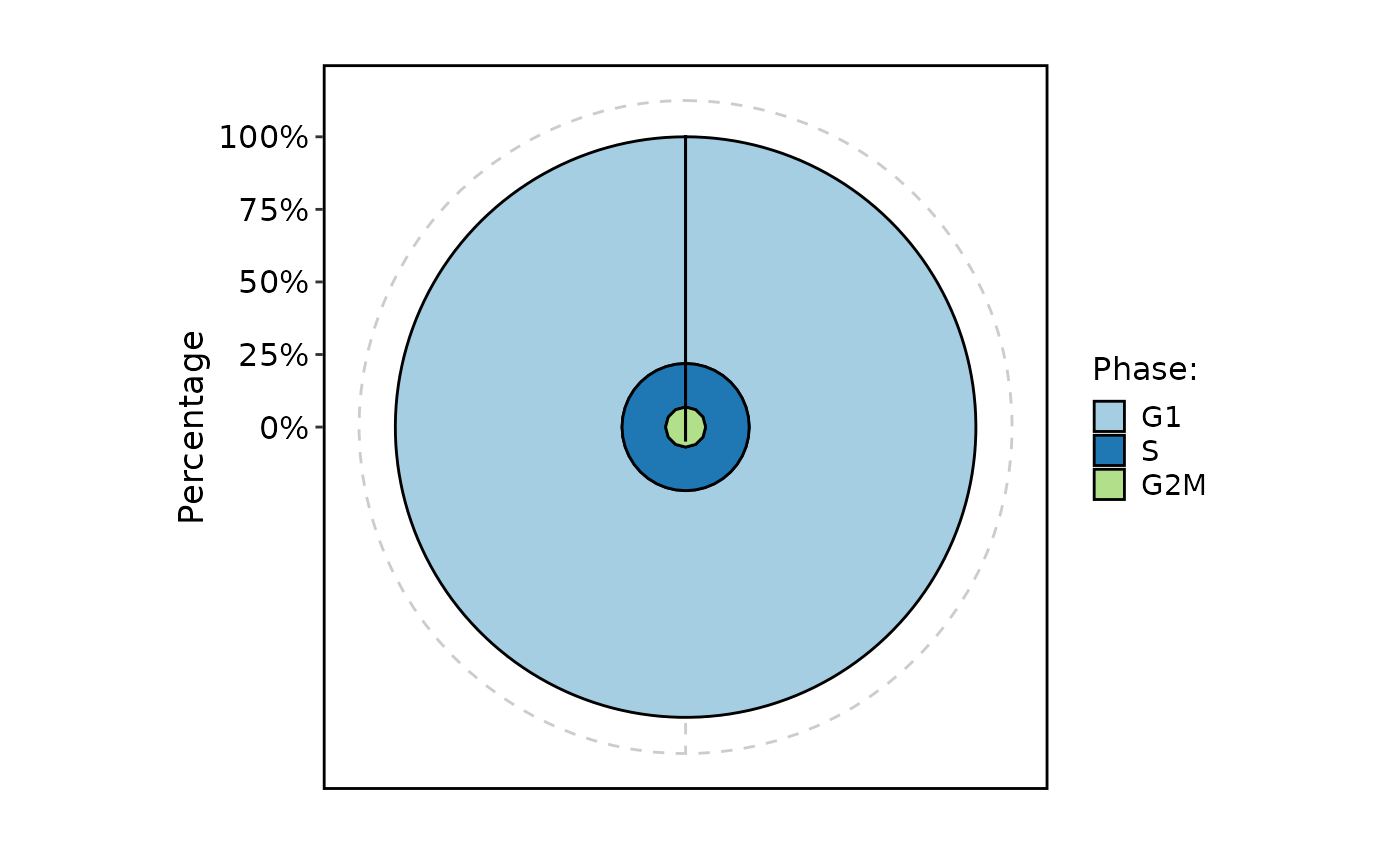
 CellStatPlot(
pancreas_sub,
stat.by = "Phase",
plot_type = "rose"
)
CellStatPlot(
pancreas_sub,
stat.by = "Phase",
plot_type = "rose"
)
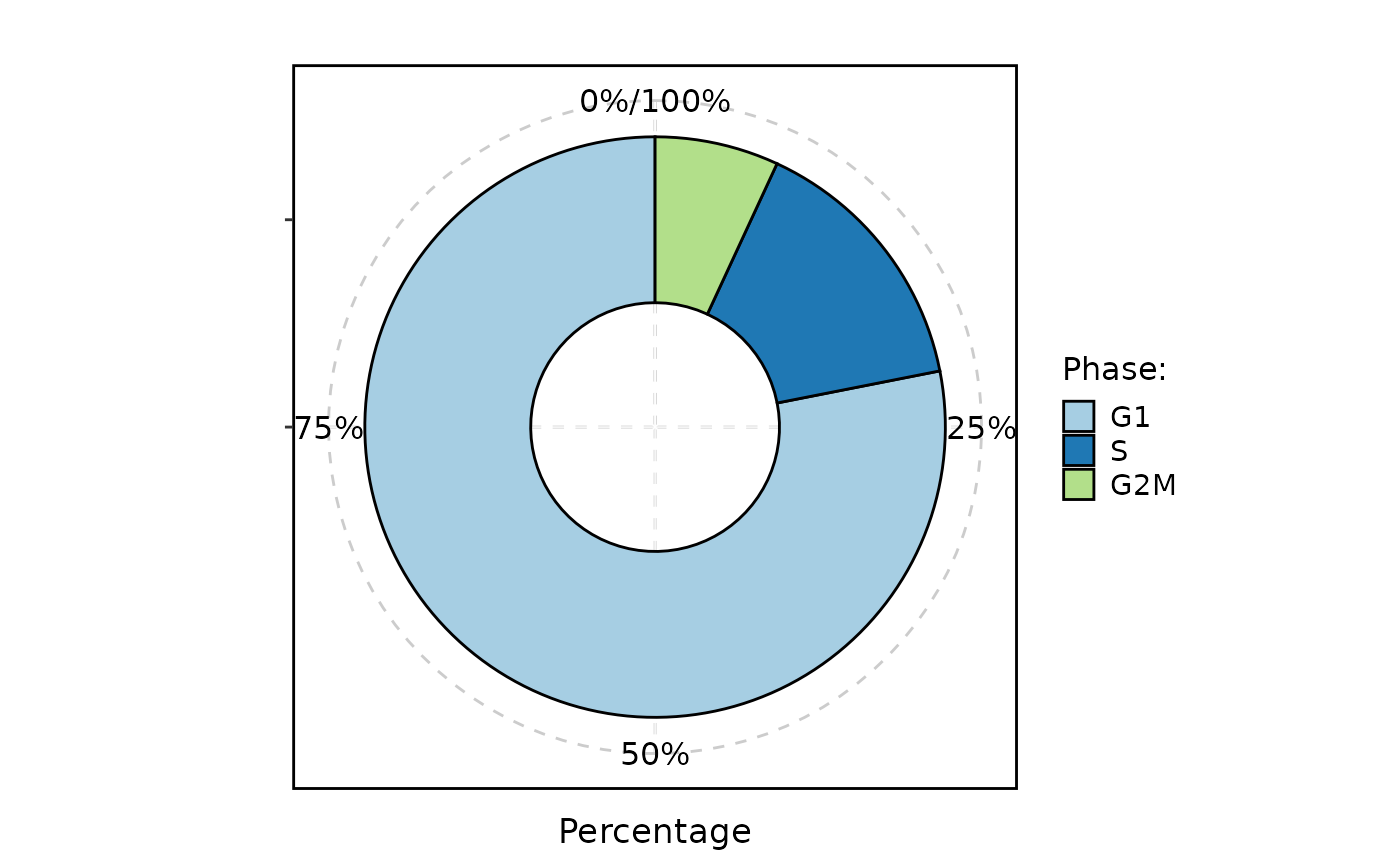
 CellStatPlot(
pancreas_sub,
stat.by = "Phase",
plot_type = "ring"
)
#> Warning: Removed 1 row containing missing values or values outside the scale range
#> (`geom_col()`).
CellStatPlot(
pancreas_sub,
stat.by = "Phase",
plot_type = "ring"
)
#> Warning: Removed 1 row containing missing values or values outside the scale range
#> (`geom_col()`).
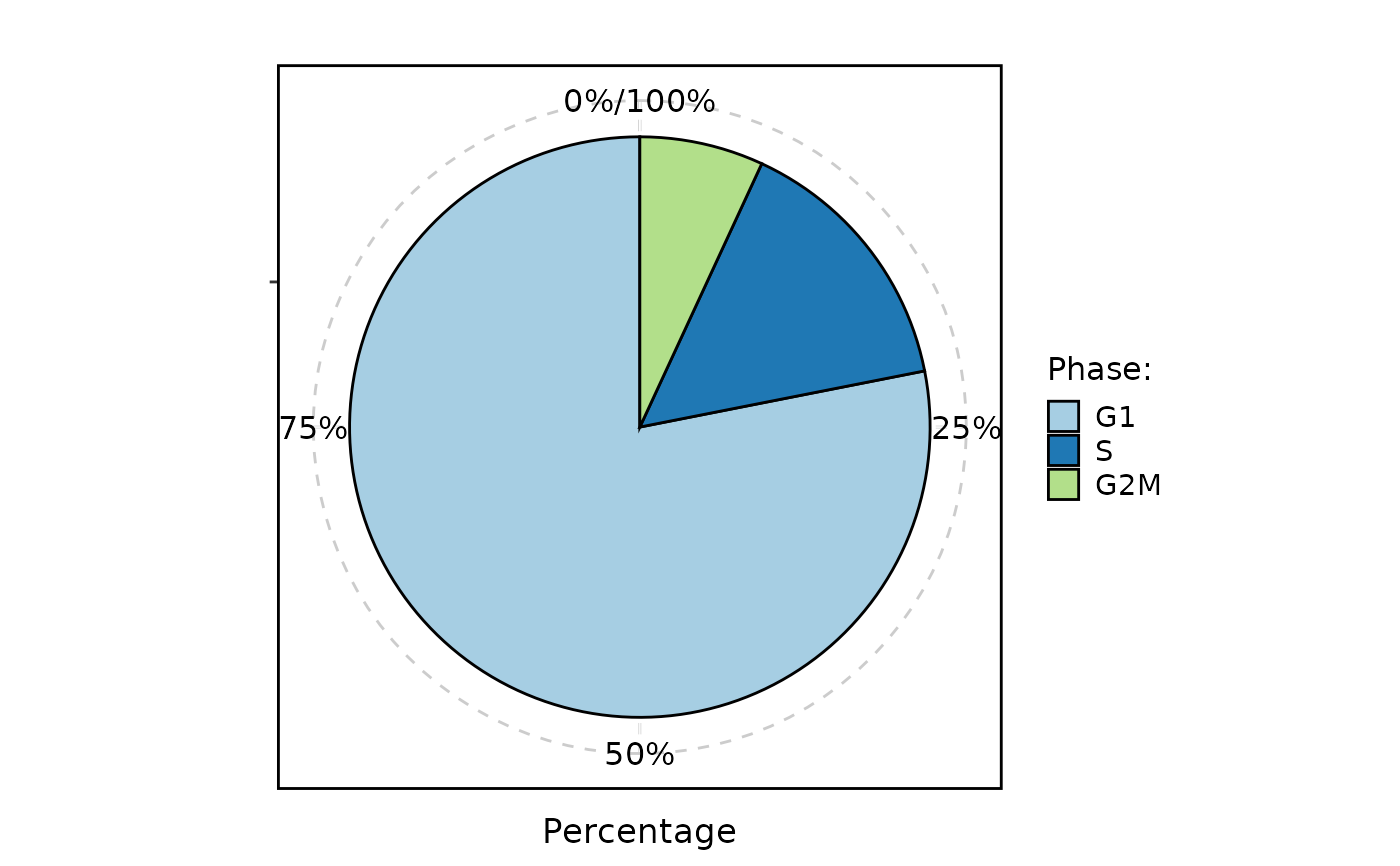
 CellStatPlot(
pancreas_sub,
stat.by = "Phase",
plot_type = "pie"
)
CellStatPlot(
pancreas_sub,
stat.by = "Phase",
plot_type = "pie"
)
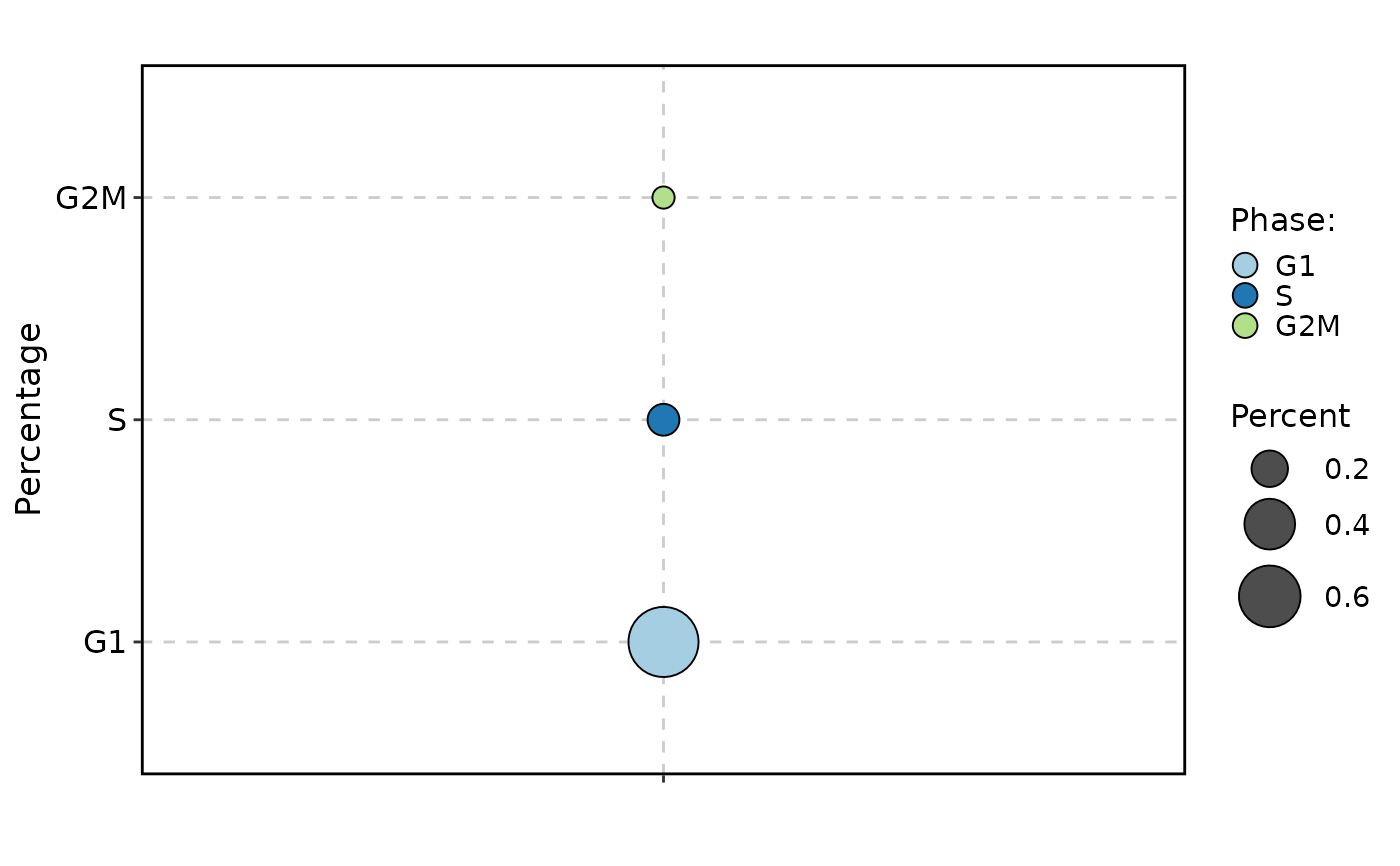
 CellStatPlot(
pancreas_sub,
stat.by = "Phase",
plot_type = "dot"
)
CellStatPlot(
pancreas_sub,
stat.by = "Phase",
plot_type = "dot"
)
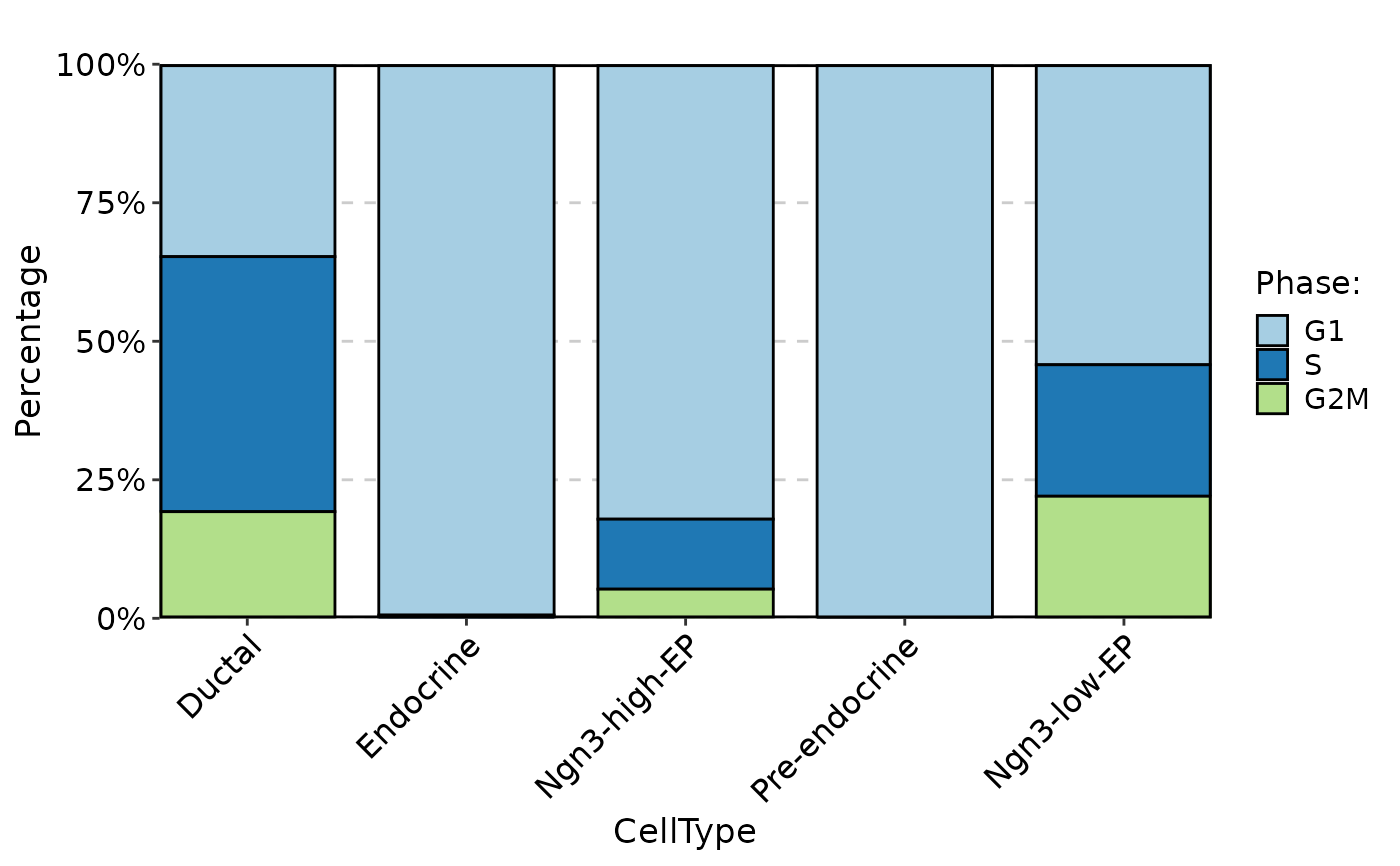
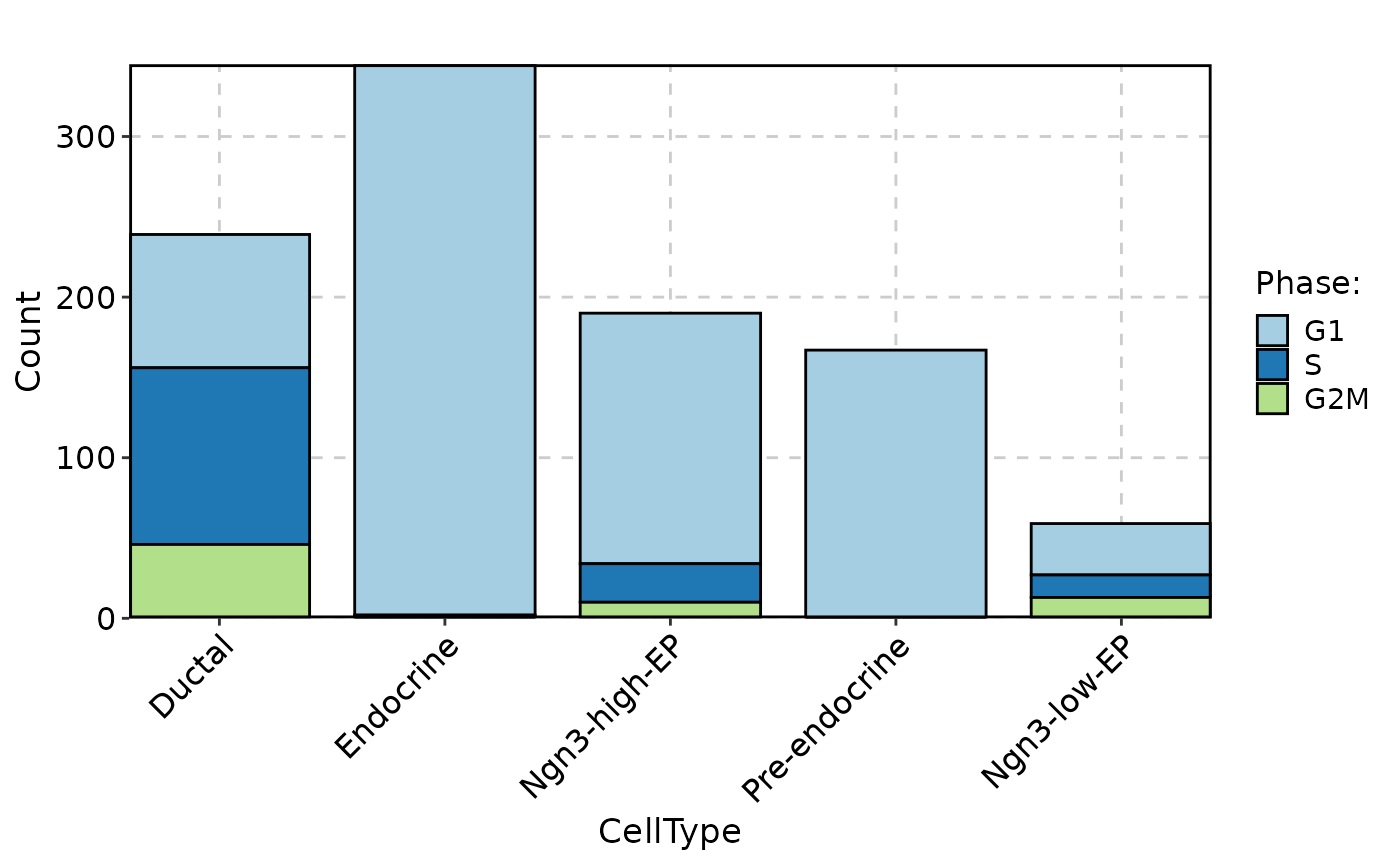
 CellStatPlot(
pancreas_sub,
stat.by = "Phase",
group.by = "CellType",
plot_type = "bar"
)
CellStatPlot(
pancreas_sub,
stat.by = "Phase",
group.by = "CellType",
plot_type = "bar"
)
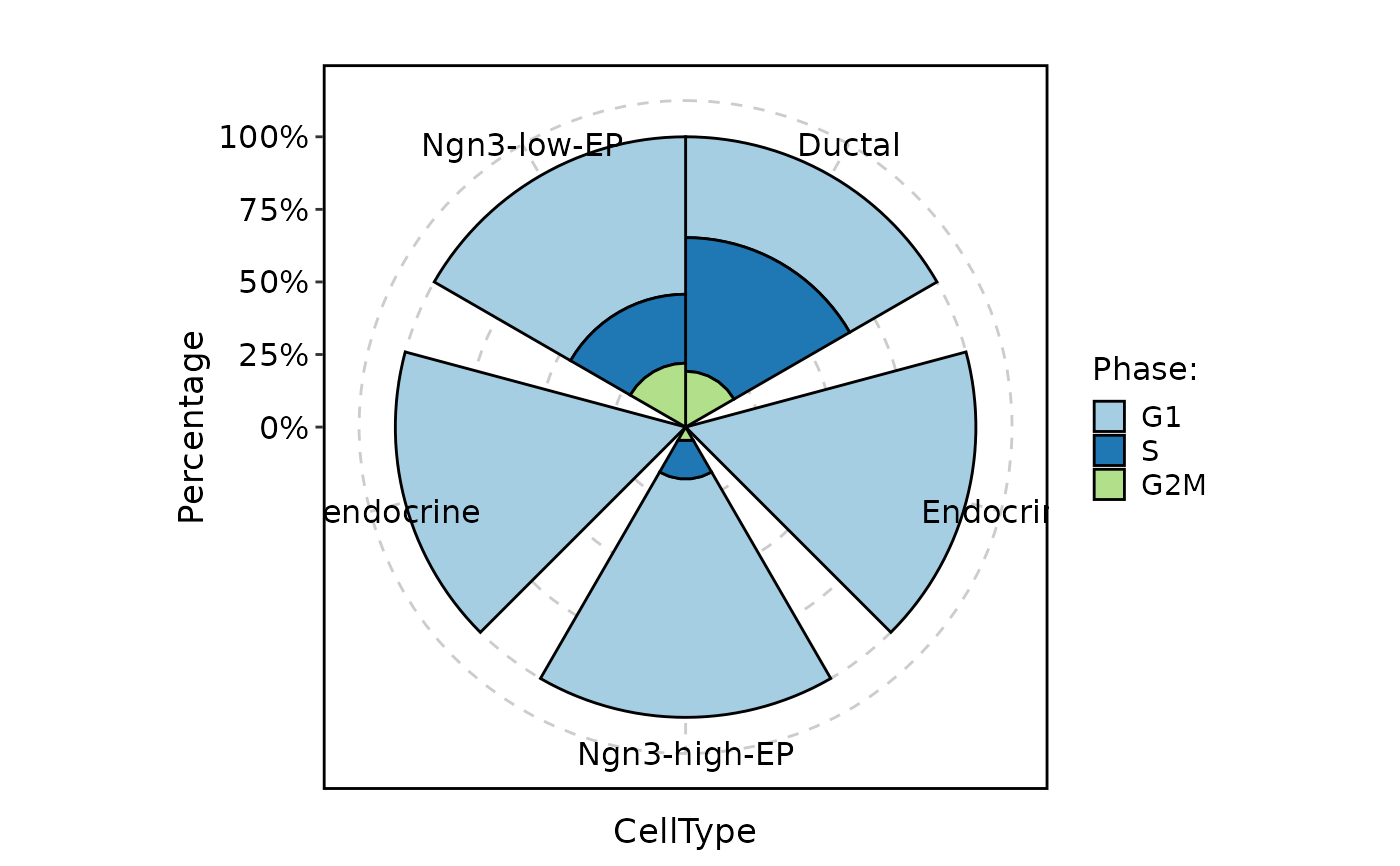
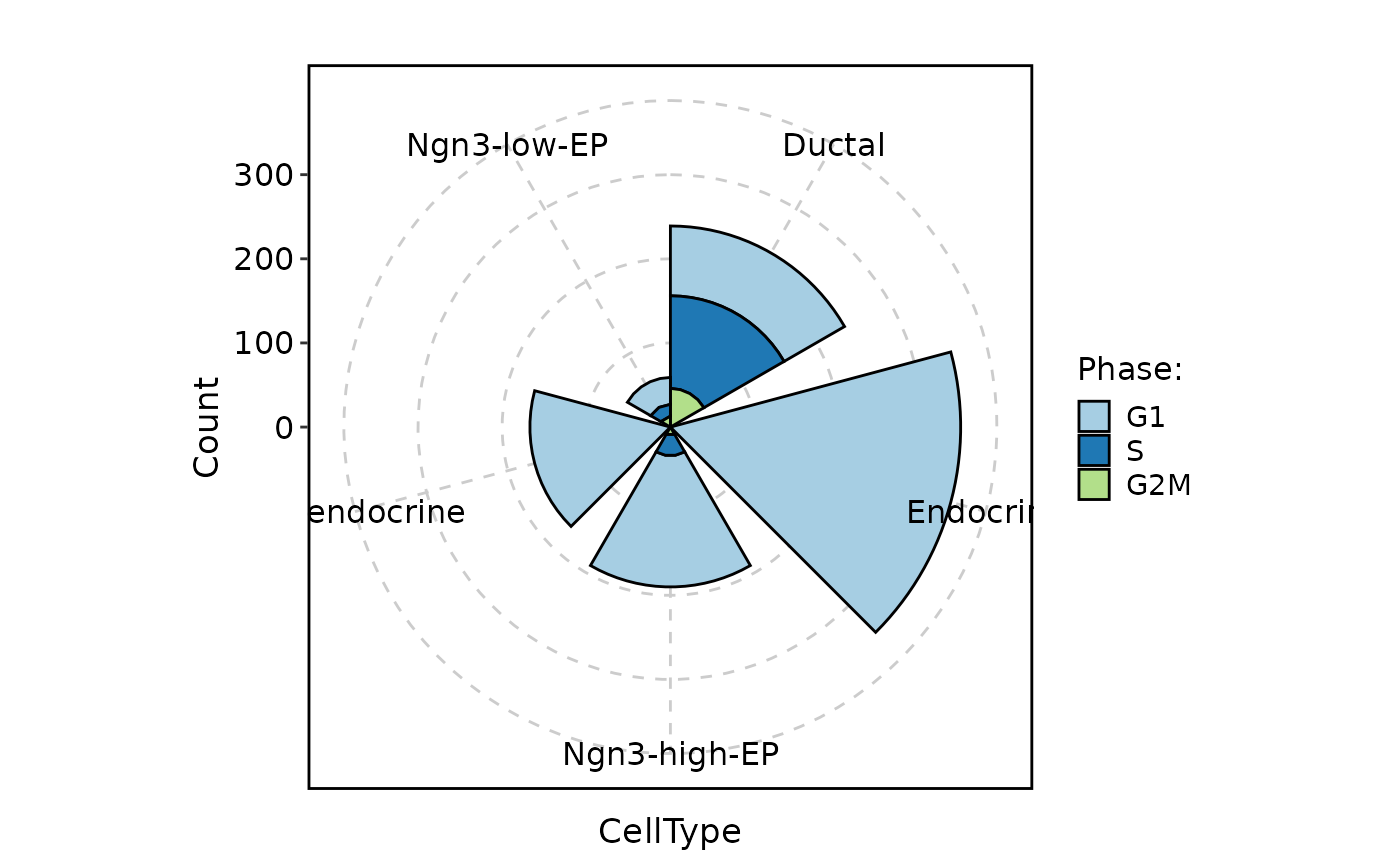
 CellStatPlot(
pancreas_sub,
stat.by = "Phase",
group.by = "CellType",
plot_type = "rose"
)
CellStatPlot(
pancreas_sub,
stat.by = "Phase",
group.by = "CellType",
plot_type = "rose"
)
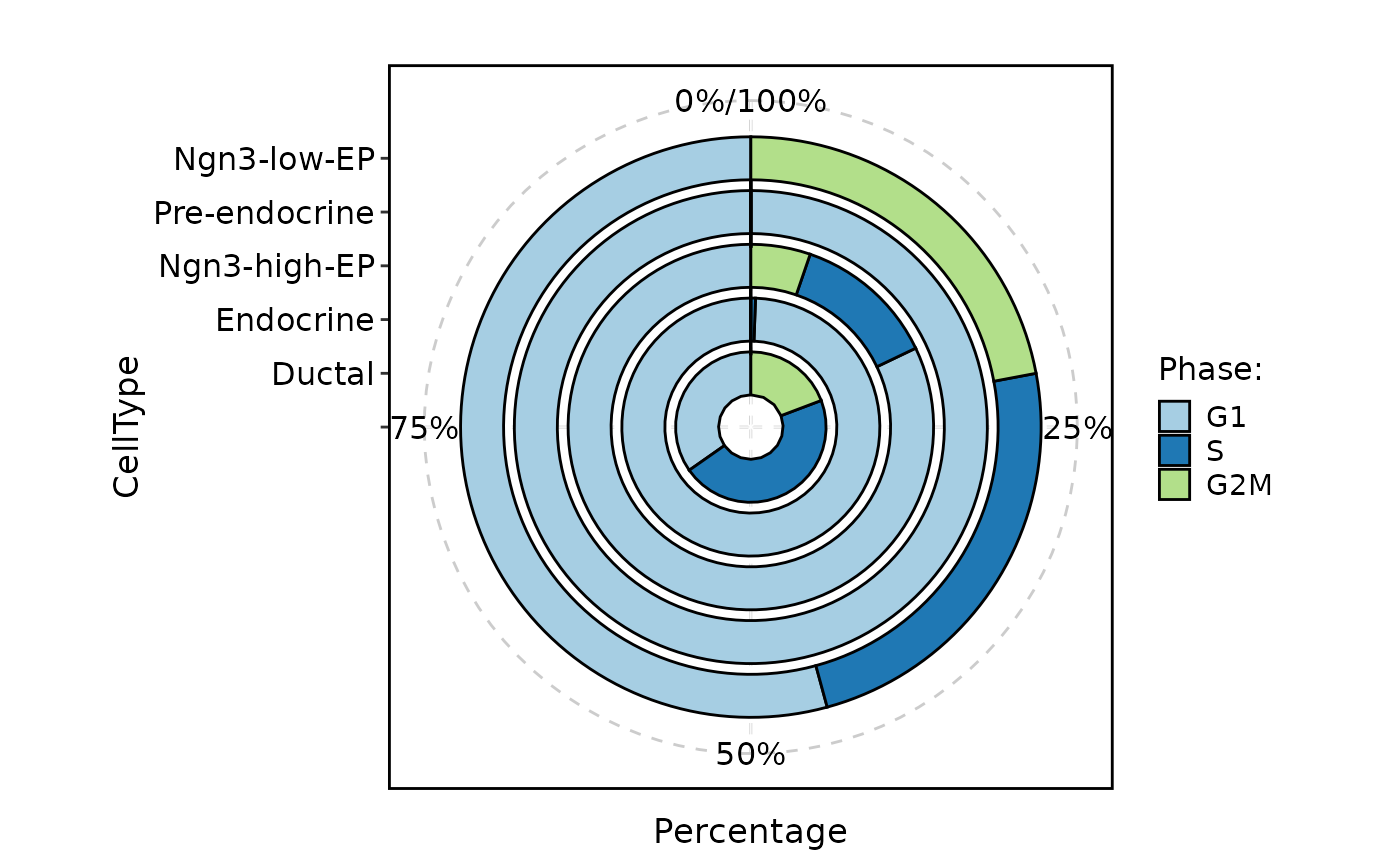
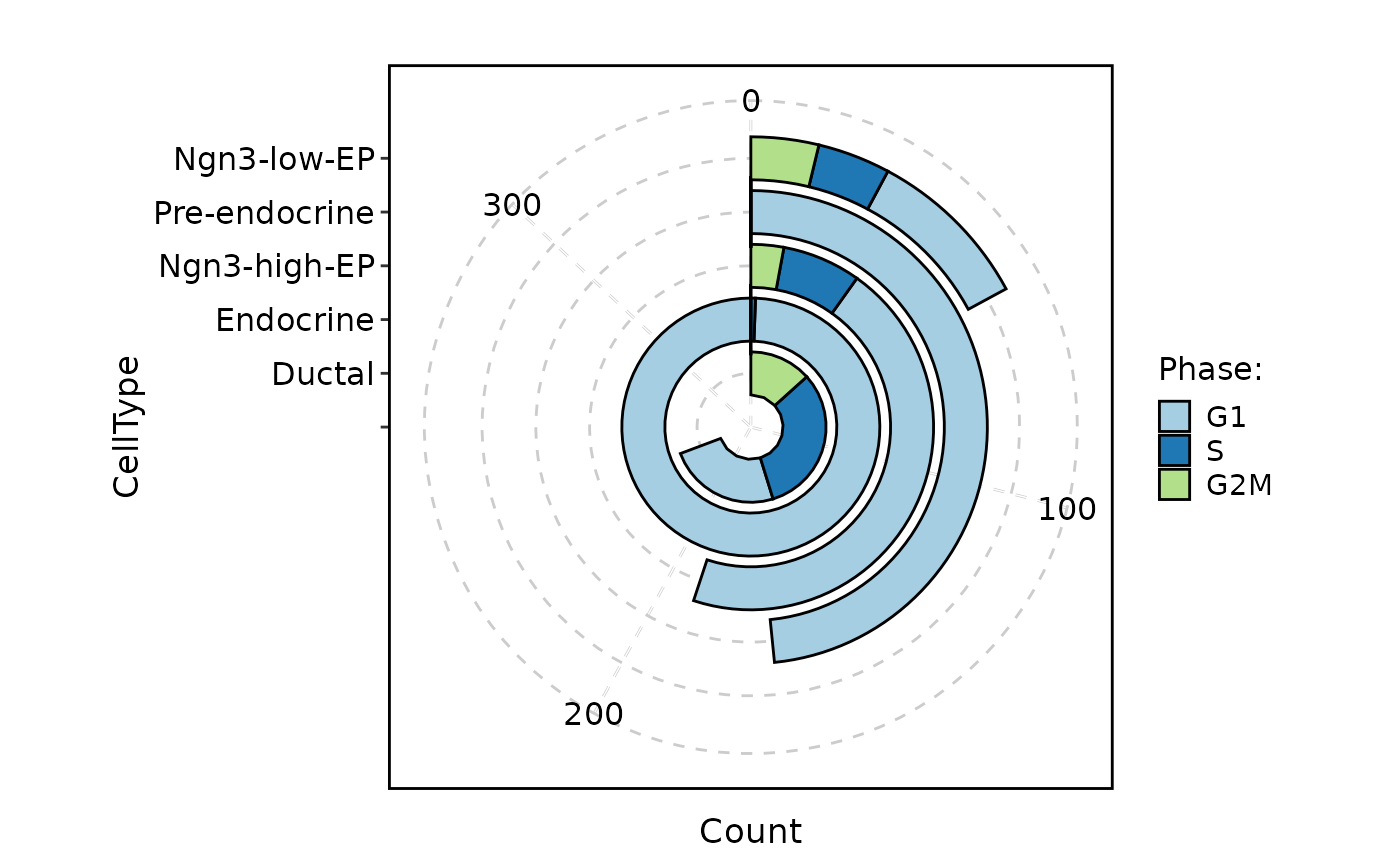
 CellStatPlot(
pancreas_sub,
stat.by = "Phase",
group.by = "CellType",
plot_type = "ring"
)
#> Warning: Removed 1 row containing missing values or values outside the scale range
#> (`geom_col()`).
CellStatPlot(
pancreas_sub,
stat.by = "Phase",
group.by = "CellType",
plot_type = "ring"
)
#> Warning: Removed 1 row containing missing values or values outside the scale range
#> (`geom_col()`).
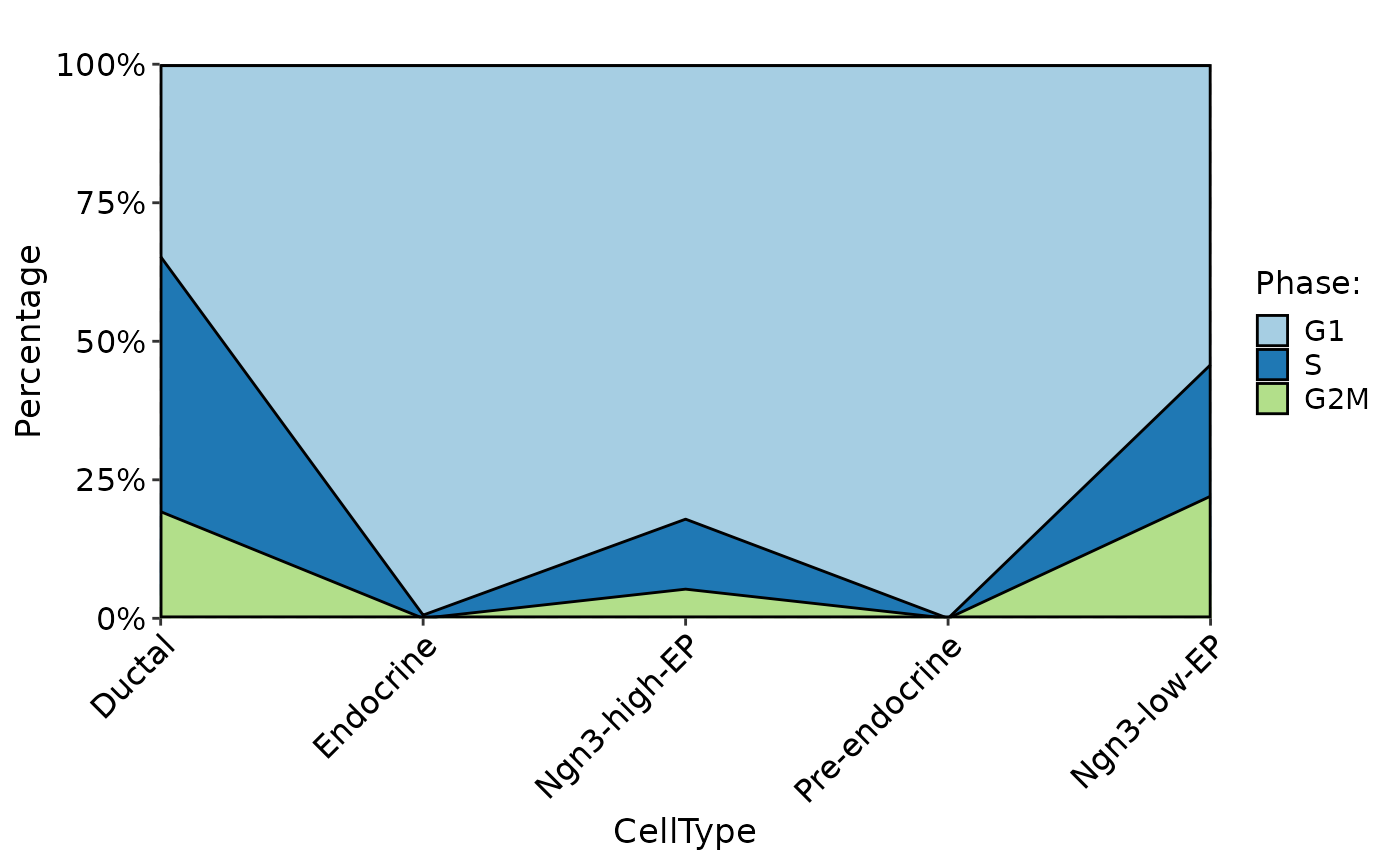
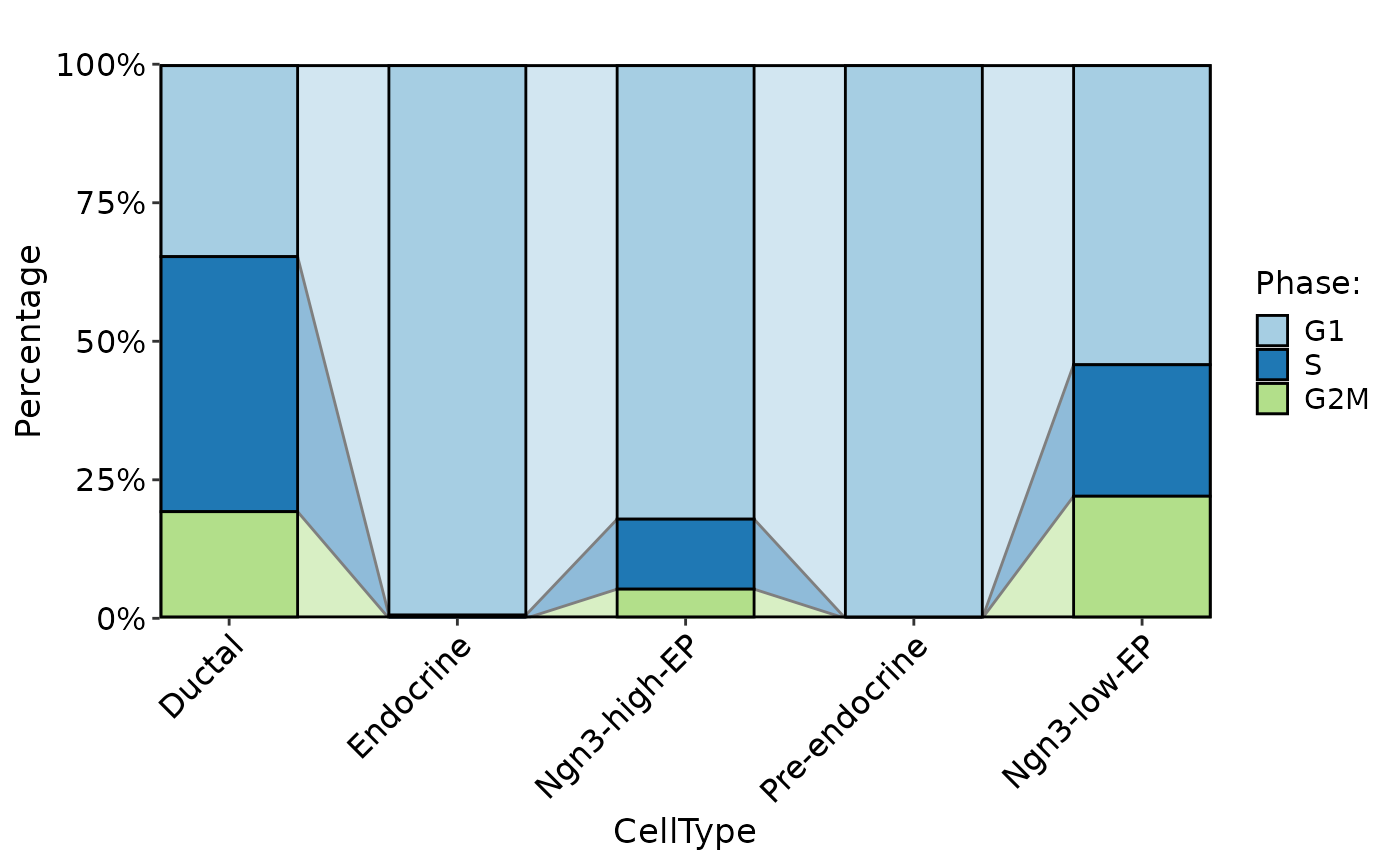
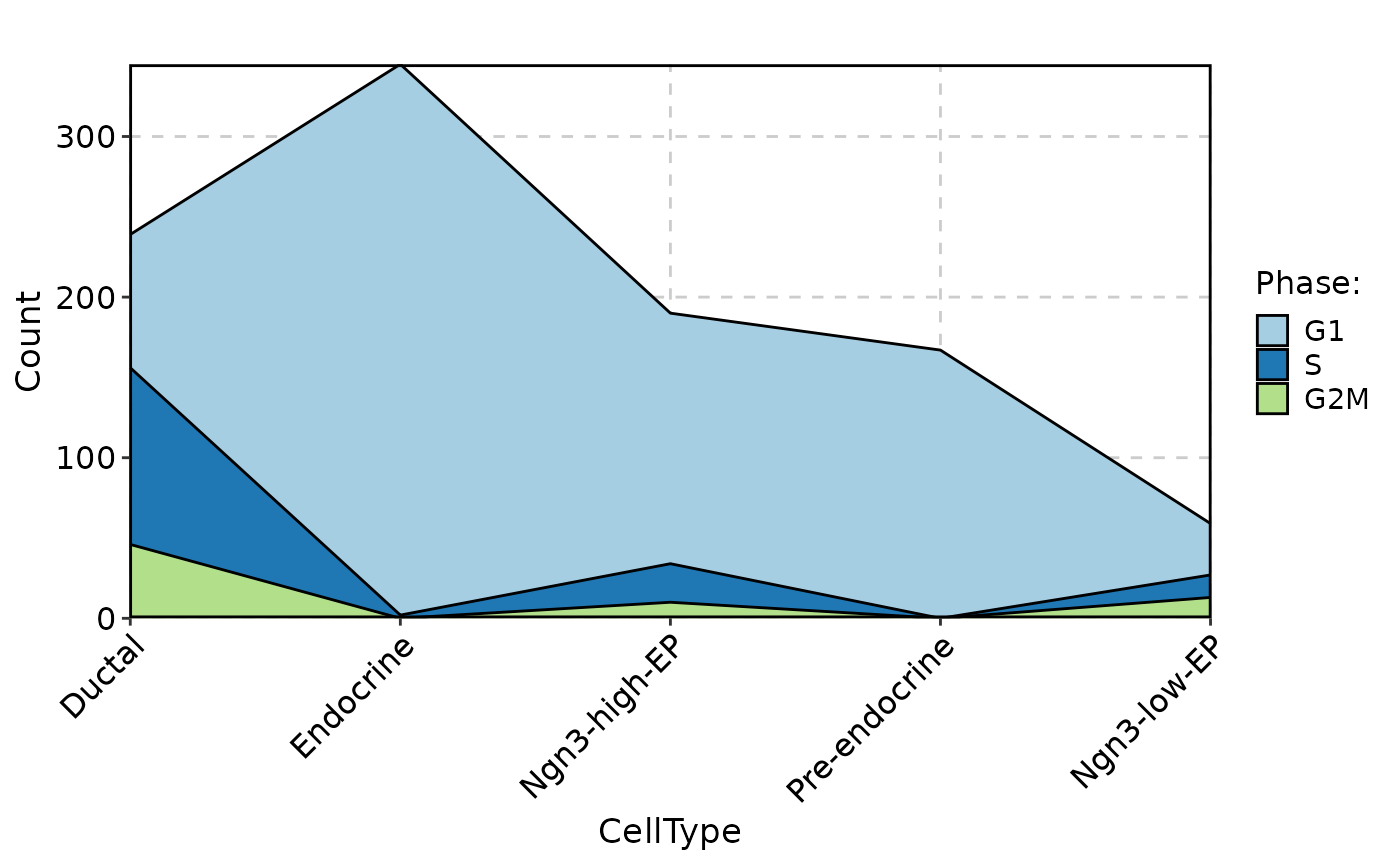
 CellStatPlot(
pancreas_sub,
stat.by = "Phase",
group.by = "CellType",
plot_type = "area"
)
CellStatPlot(
pancreas_sub,
stat.by = "Phase",
group.by = "CellType",
plot_type = "area"
)
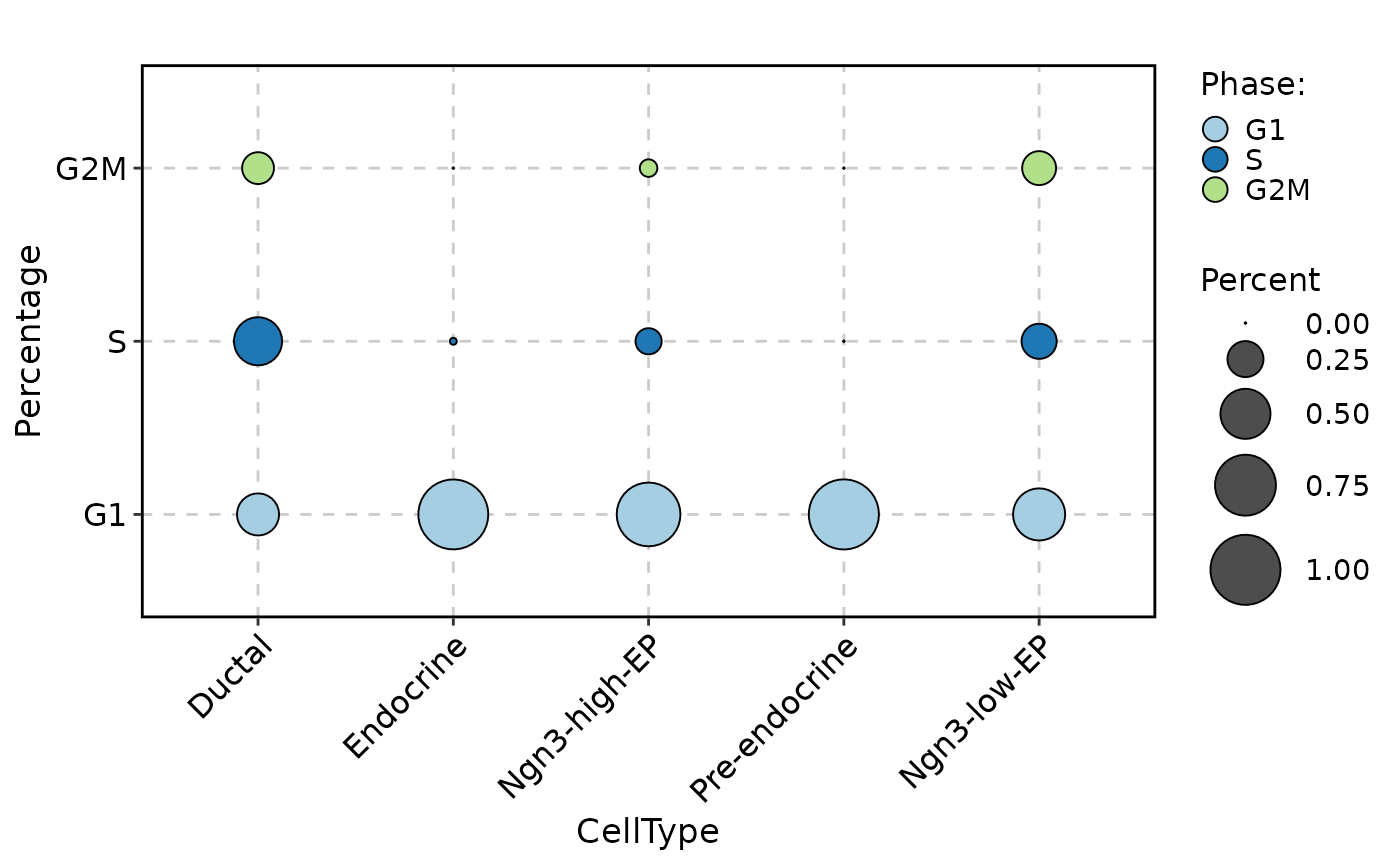
 CellStatPlot(
pancreas_sub,
stat.by = "Phase",
group.by = "CellType",
plot_type = "dot"
)
CellStatPlot(
pancreas_sub,
stat.by = "Phase",
group.by = "CellType",
plot_type = "dot"
)
 CellStatPlot(
pancreas_sub,
stat.by = "Phase",
group.by = "CellType",
plot_type = "trend"
)
CellStatPlot(
pancreas_sub,
stat.by = "Phase",
group.by = "CellType",
plot_type = "trend"
)
 CellStatPlot(
pancreas_sub,
stat.by = "Phase",
group.by = "CellType",
plot_type = "trend_alluvial"
)
CellStatPlot(
pancreas_sub,
stat.by = "Phase",
group.by = "CellType",
plot_type = "trend_alluvial"
)
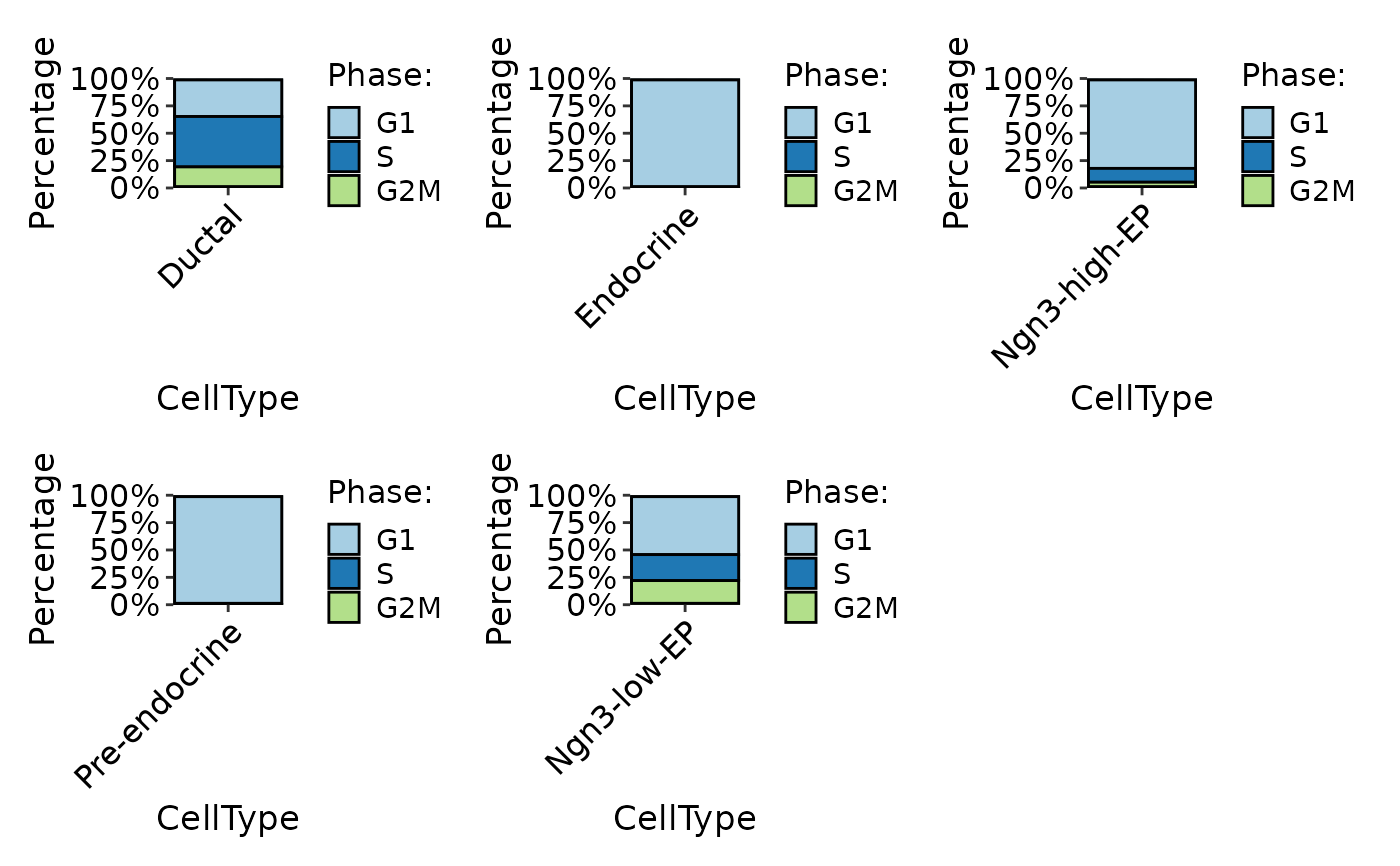 CellStatPlot(
pancreas_sub,
stat.by = "Phase",
group.by = "CellType",
plot_type = "bar",
individual = TRUE
)
CellStatPlot(
pancreas_sub,
stat.by = "Phase",
group.by = "CellType",
plot_type = "bar",
individual = TRUE
)
 CellStatPlot(
pancreas_sub,
stat.by = "Phase",
group.by = "CellType",
stat_type = "count",
plot_type = "bar"
)
CellStatPlot(
pancreas_sub,
stat.by = "Phase",
group.by = "CellType",
stat_type = "count",
plot_type = "bar"
)
 CellStatPlot(
pancreas_sub,
stat.by = "Phase",
group.by = "CellType",
stat_type = "count",
plot_type = "rose"
)
CellStatPlot(
pancreas_sub,
stat.by = "Phase",
group.by = "CellType",
stat_type = "count",
plot_type = "rose"
)
 CellStatPlot(
pancreas_sub,
stat.by = "Phase",
group.by = "CellType",
stat_type = "count",
plot_type = "ring"
)
#> Warning: Removed 1 row containing missing values or values outside the scale range
#> (`geom_col()`).
CellStatPlot(
pancreas_sub,
stat.by = "Phase",
group.by = "CellType",
stat_type = "count",
plot_type = "ring"
)
#> Warning: Removed 1 row containing missing values or values outside the scale range
#> (`geom_col()`).
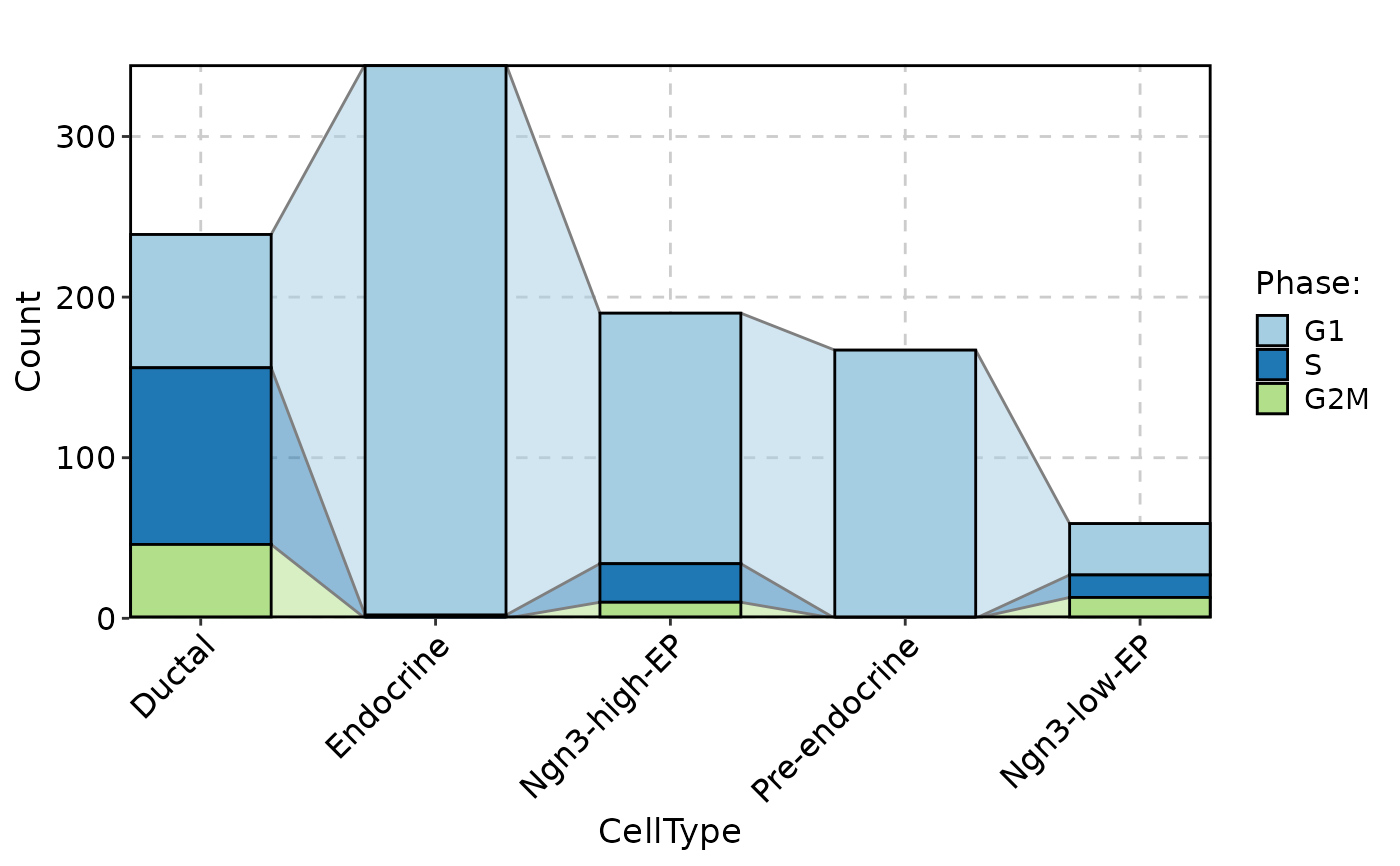
 CellStatPlot(
pancreas_sub,
stat.by = "Phase",
group.by = "CellType",
stat_type = "count",
plot_type = "area"
)
CellStatPlot(
pancreas_sub,
stat.by = "Phase",
group.by = "CellType",
stat_type = "count",
plot_type = "area"
)
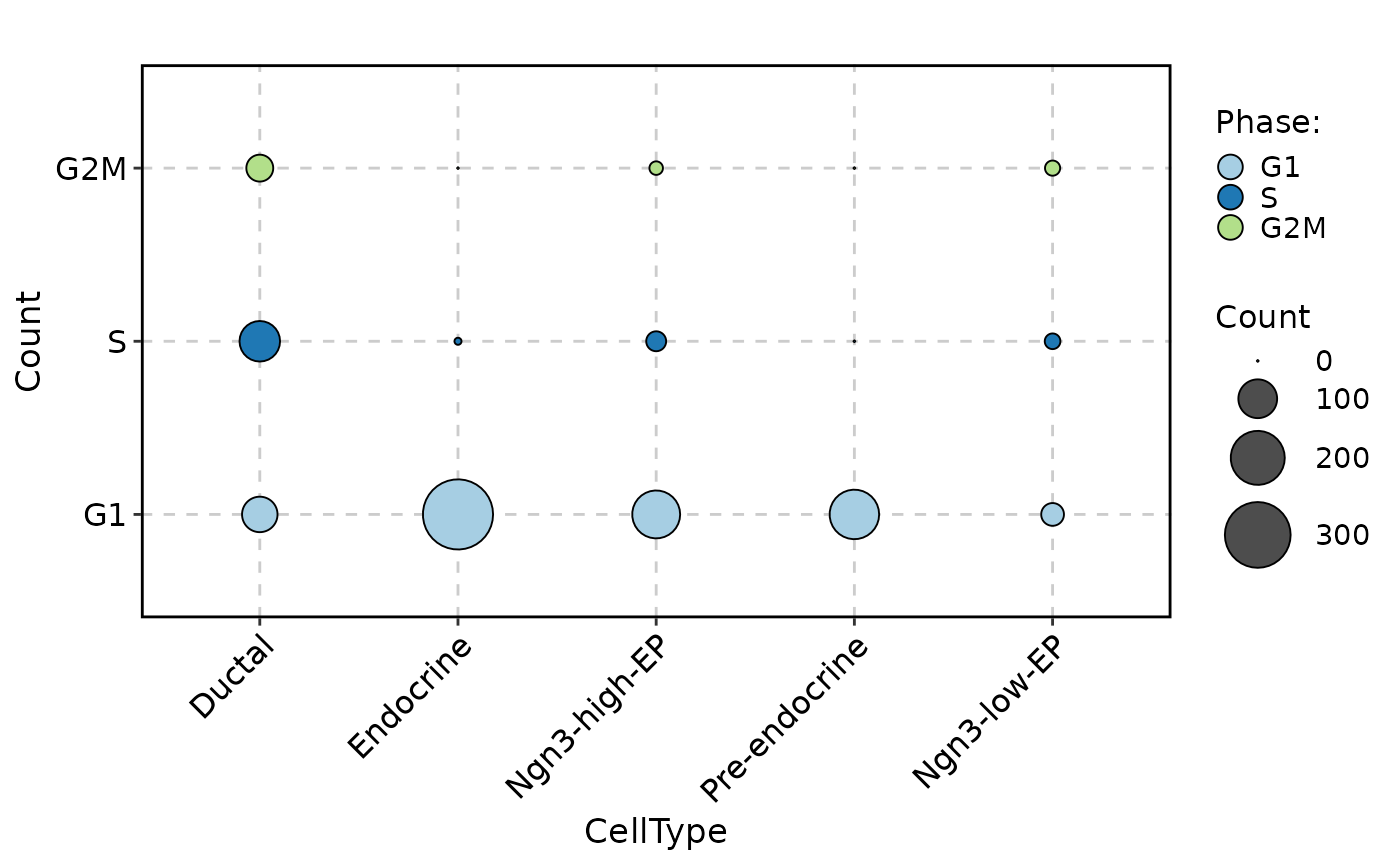 CellStatPlot(
pancreas_sub,
stat.by = "Phase",
group.by = "CellType",
stat_type = "count",
plot_type = "dot"
)
CellStatPlot(
pancreas_sub,
stat.by = "Phase",
group.by = "CellType",
stat_type = "count",
plot_type = "dot"
)
 CellStatPlot(
pancreas_sub,
stat.by = "Phase",
group.by = "CellType",
stat_type = "count",
plot_type = "trend"
)
CellStatPlot(
pancreas_sub,
stat.by = "Phase",
group.by = "CellType",
stat_type = "count",
plot_type = "trend"
)
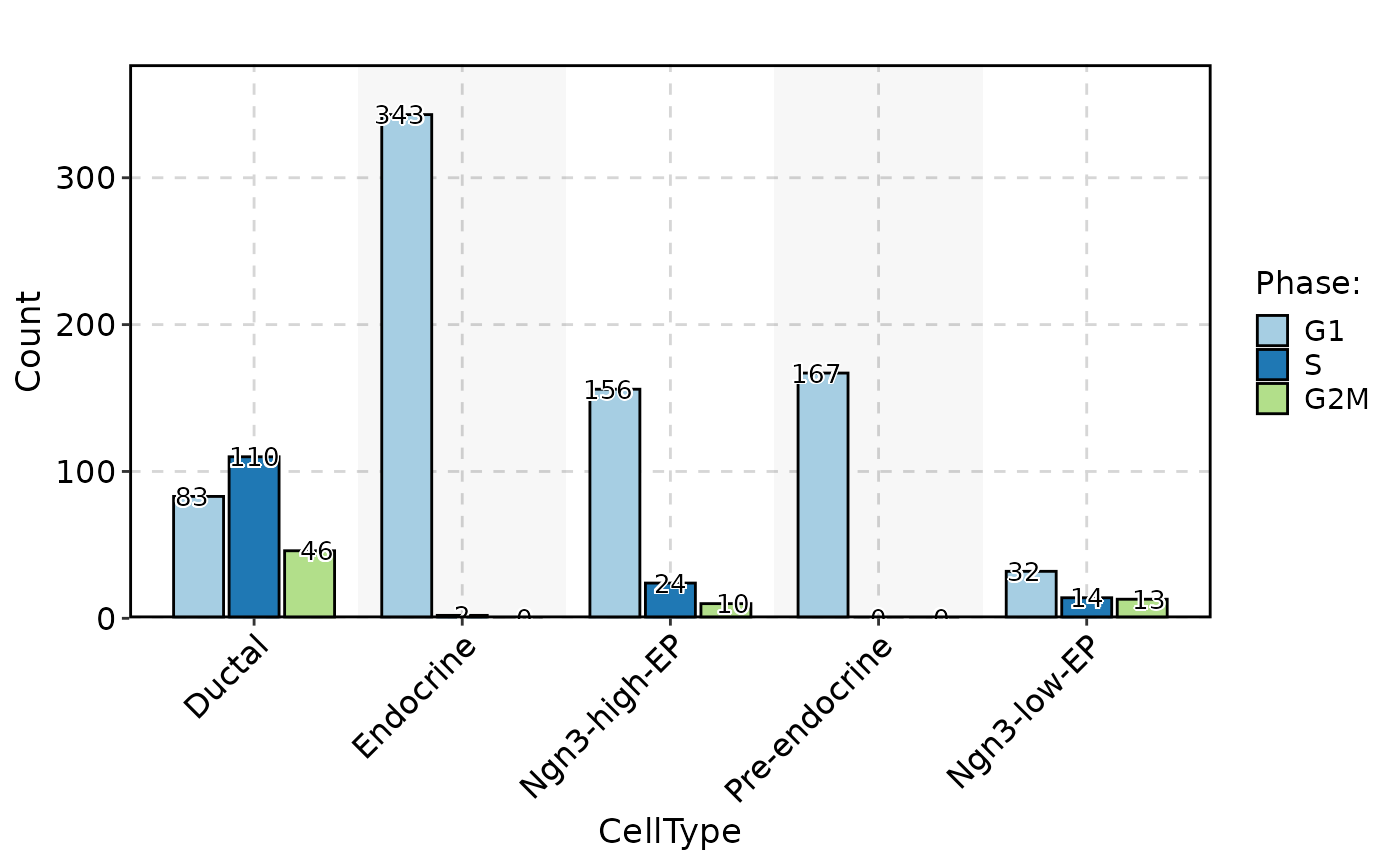 CellStatPlot(
pancreas_sub,
stat.by = "Phase",
group.by = "CellType",
stat_type = "count",
plot_type = "bar",
position = "dodge",
label = TRUE
)
CellStatPlot(
pancreas_sub,
stat.by = "Phase",
group.by = "CellType",
stat_type = "count",
plot_type = "bar",
position = "dodge",
label = TRUE
)
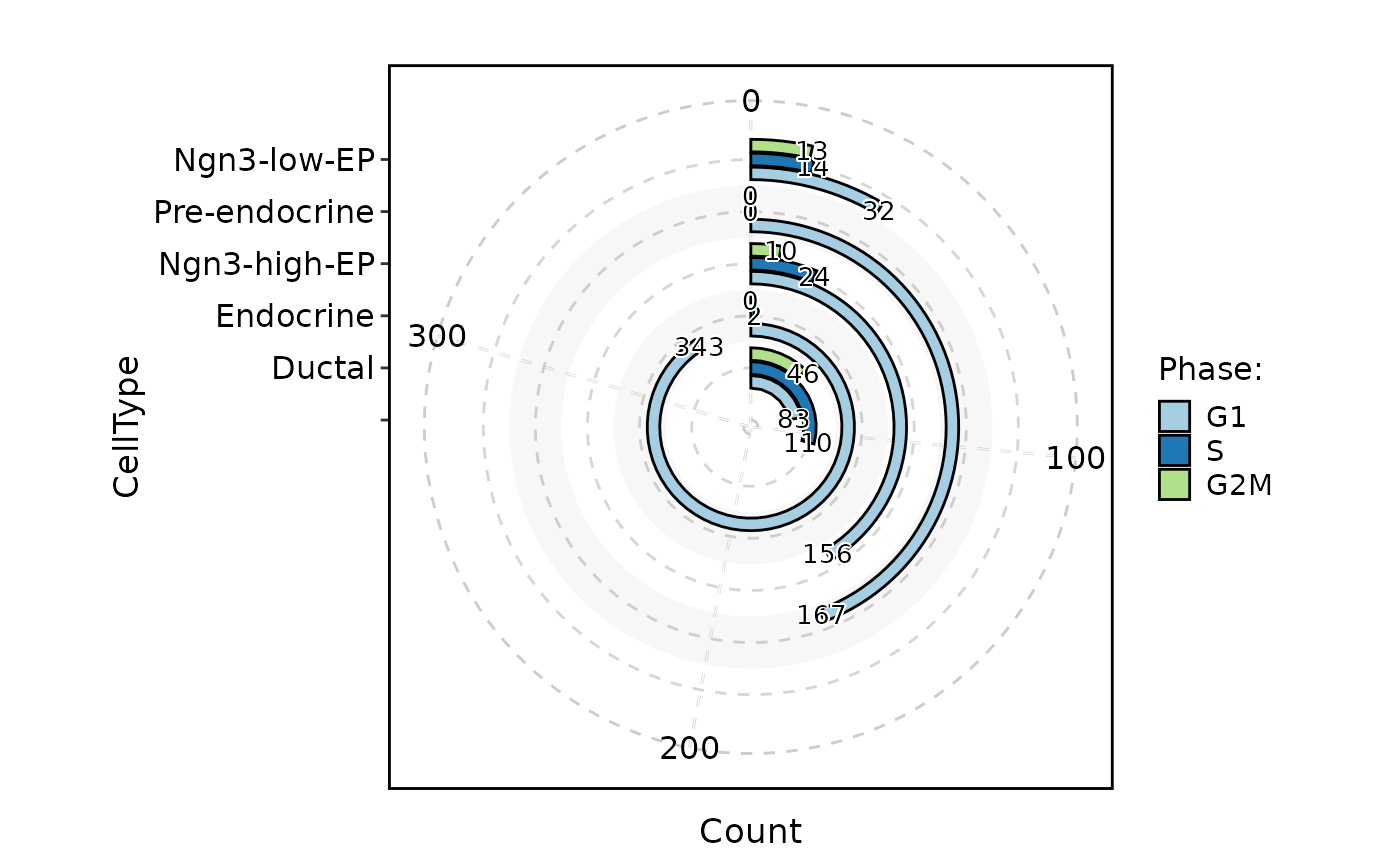
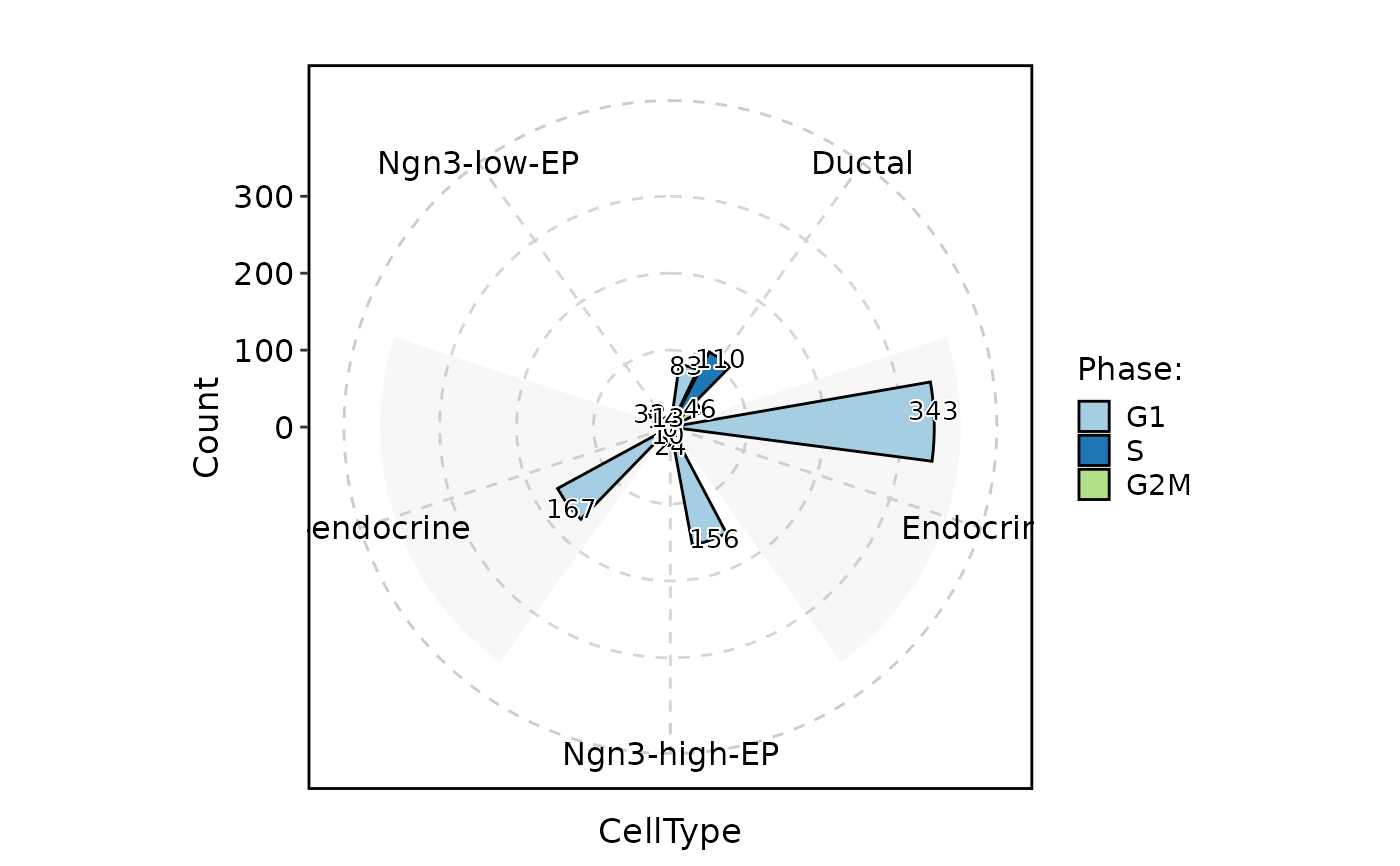 CellStatPlot(
pancreas_sub,
stat.by = "Phase",
group.by = "CellType",
stat_type = "count",
plot_type = "rose",
position = "dodge",
label = TRUE
)
CellStatPlot(
pancreas_sub,
stat.by = "Phase",
group.by = "CellType",
stat_type = "count",
plot_type = "rose",
position = "dodge",
label = TRUE
)
 CellStatPlot(
pancreas_sub,
stat.by = "Phase",
group.by = "CellType",
stat_type = "count",
plot_type = "ring",
position = "dodge",
label = TRUE
)
#> Warning: Removed 1 row containing missing values or values outside the scale range
#> (`geom_col()`).
#> Warning: Removed 1 row containing missing values or values outside the scale range
#> (`geom_text_repel()`).
CellStatPlot(
pancreas_sub,
stat.by = "Phase",
group.by = "CellType",
stat_type = "count",
plot_type = "ring",
position = "dodge",
label = TRUE
)
#> Warning: Removed 1 row containing missing values or values outside the scale range
#> (`geom_col()`).
#> Warning: Removed 1 row containing missing values or values outside the scale range
#> (`geom_text_repel()`).
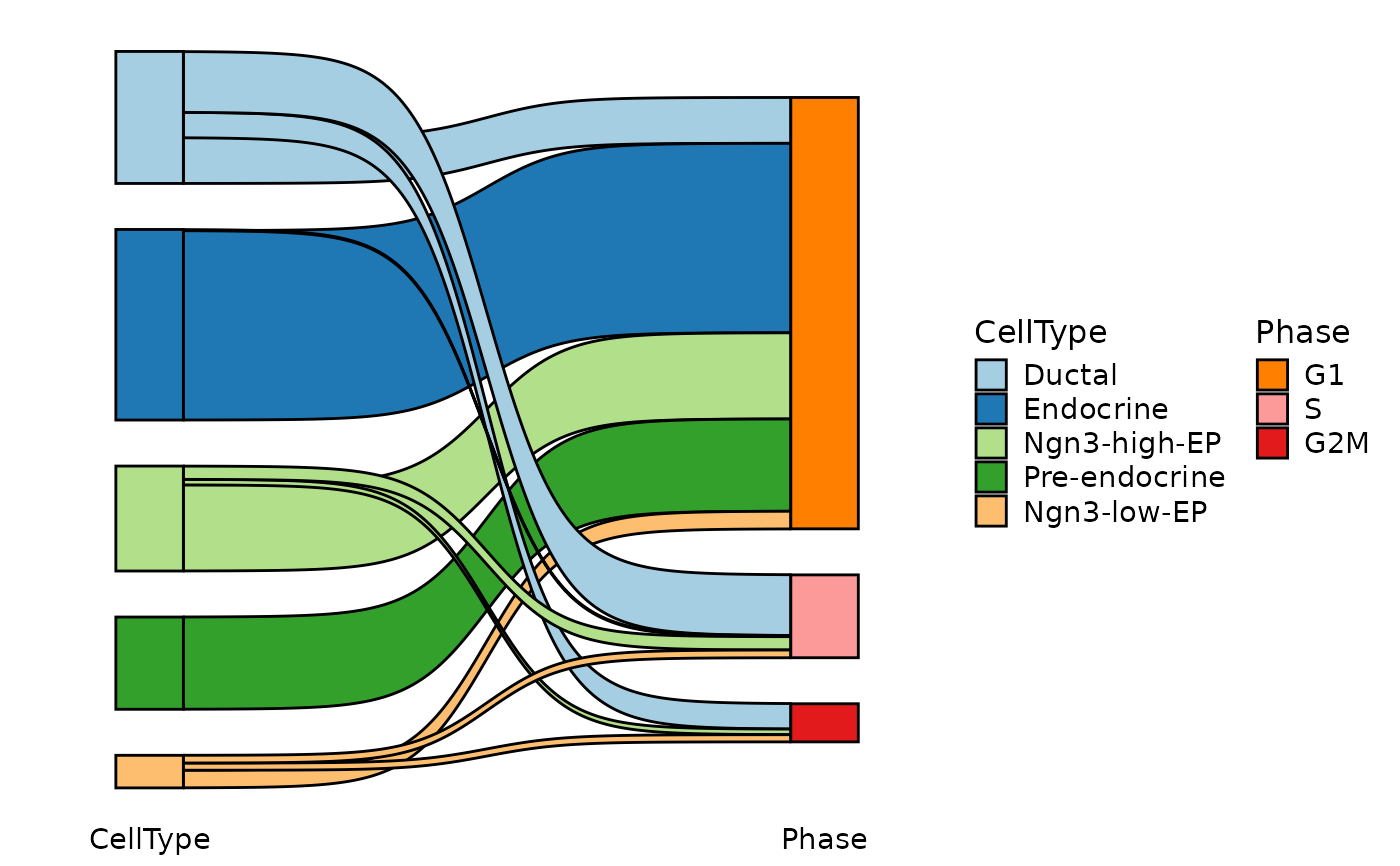 CellStatPlot(
pancreas_sub,
stat.by = c("CellType", "Phase"),
plot_type = "sankey"
)
#> ! [2026-07-02 08:31:49] `stat_type` is forcibly set to "count" when plot "sankey", "chord", "venn", and "upset"
CellStatPlot(
pancreas_sub,
stat.by = c("CellType", "Phase"),
plot_type = "sankey"
)
#> ! [2026-07-02 08:31:49] `stat_type` is forcibly set to "count" when plot "sankey", "chord", "venn", and "upset"
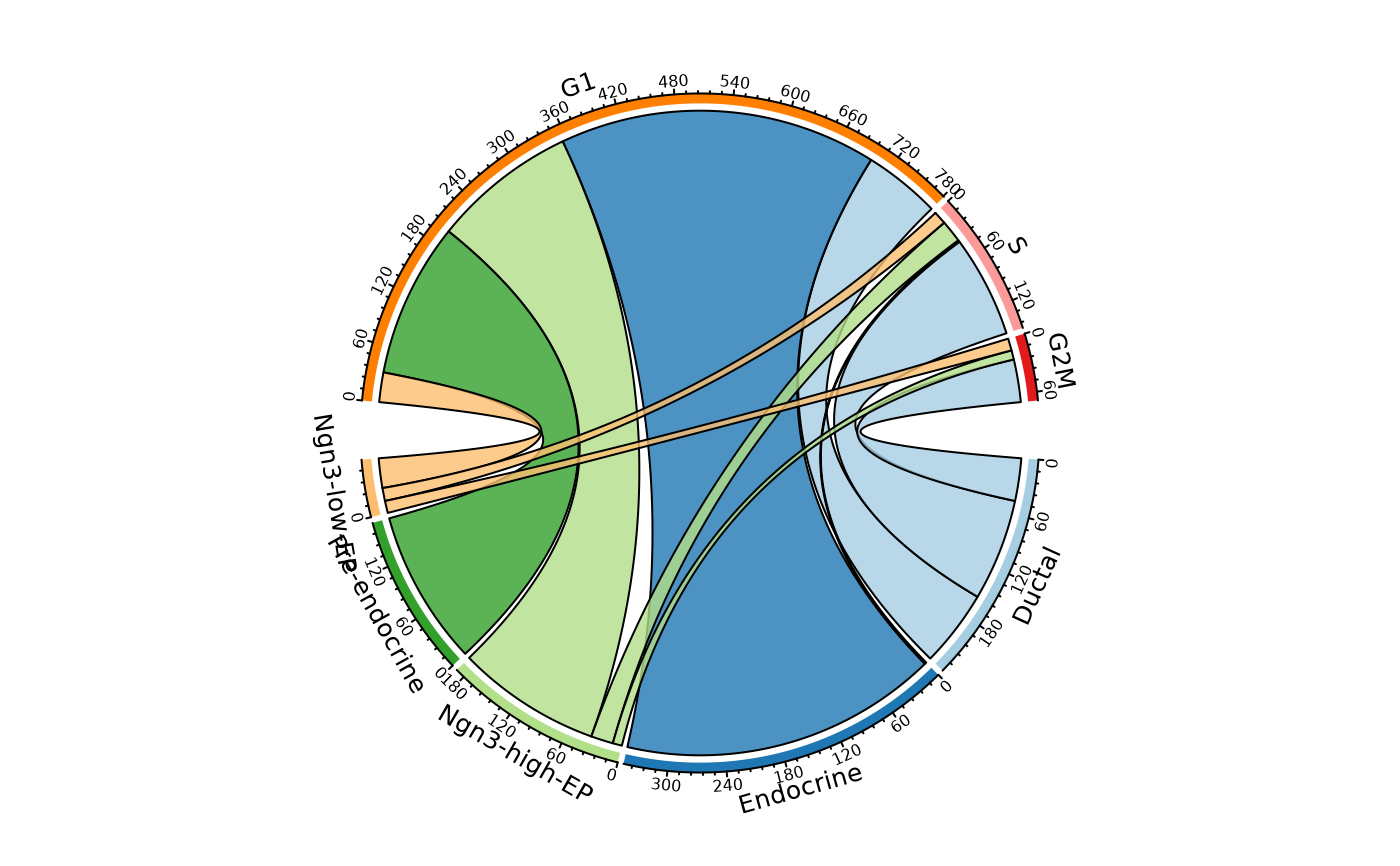 CellStatPlot(
pancreas_sub,
stat.by = c("CellType", "Phase"),
plot_type = "chord"
)
#> ! [2026-07-02 08:31:50] `stat_type` is forcibly set to "count" when plot "sankey", "chord", "venn", and "upset"
CellStatPlot(
pancreas_sub,
stat.by = c("CellType", "Phase"),
plot_type = "chord"
)
#> ! [2026-07-02 08:31:50] `stat_type` is forcibly set to "count" when plot "sankey", "chord", "venn", and "upset"
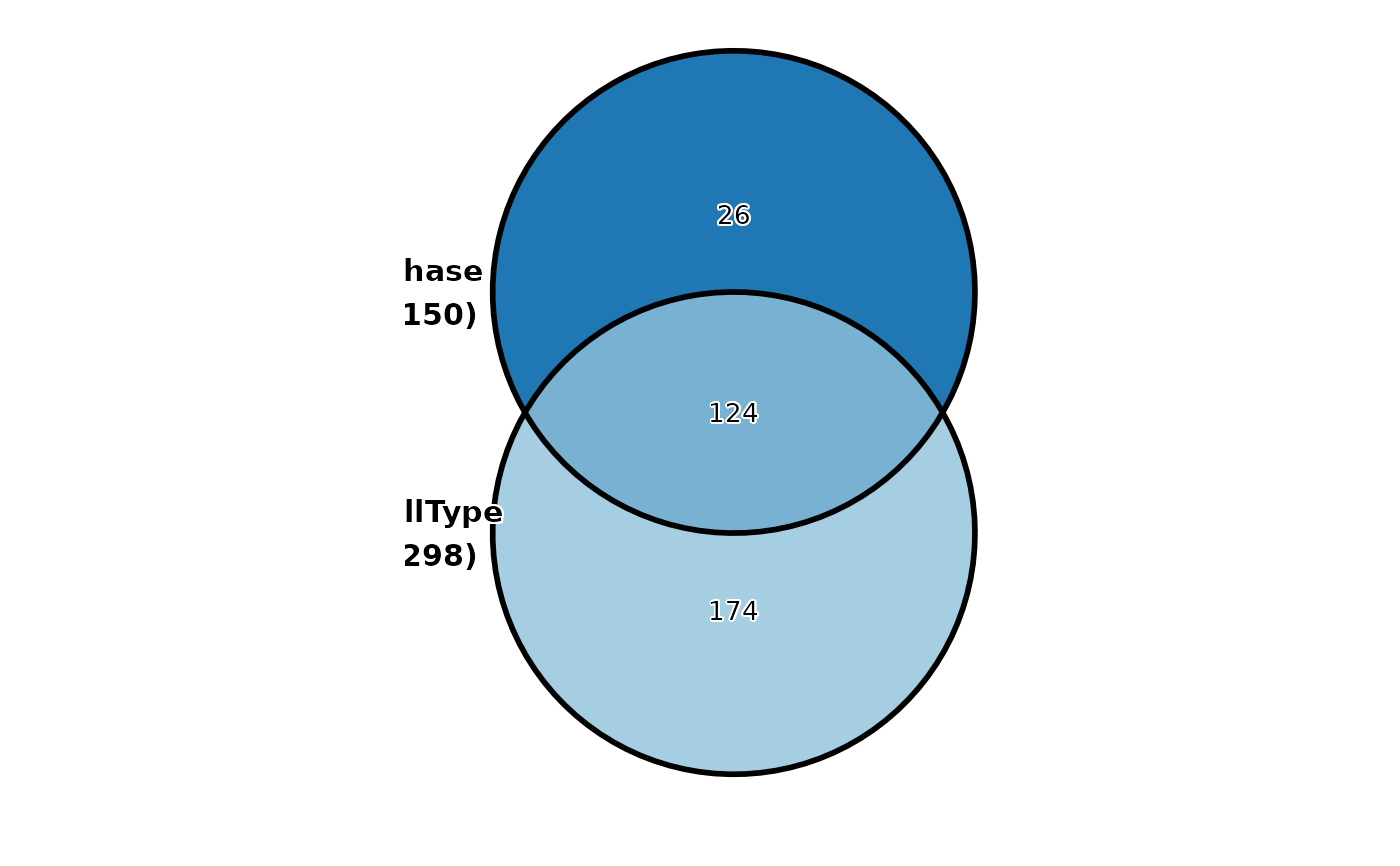 CellStatPlot(
pancreas_sub,
stat.by = c("CellType", "Phase"),
plot_type = "venn",
stat_level = list(
CellType = c("Ductal", "Ngn3-low-EP"),
Phase = "S"
)
)
#> ! [2026-07-02 08:31:59] `stat_type` is forcibly set to "count" when plot "sankey", "chord", "venn", and "upset"
CellStatPlot(
pancreas_sub,
stat.by = c("CellType", "Phase"),
plot_type = "venn",
stat_level = list(
CellType = c("Ductal", "Ngn3-low-EP"),
Phase = "S"
)
)
#> ! [2026-07-02 08:31:59] `stat_type` is forcibly set to "count" when plot "sankey", "chord", "venn", and "upset"
 pancreas_sub$Progenitor <- pancreas_sub$CellType %in% c("Ngn3-low-EP", "Ngn3-high-EP")
pancreas_sub$G2M <- pancreas_sub$Phase == "G2M"
pancreas_sub$Fancb_Expressed <- GetAssayData5(
pancreas_sub,
assay = "RNA",
layer = "counts"
)["Fancb", ] > 0
pancreas_sub$Dlg3_Expressed <- GetAssayData5(
pancreas_sub,
assay = "RNA",
layer = "counts"
)["Dlg3", ] > 0
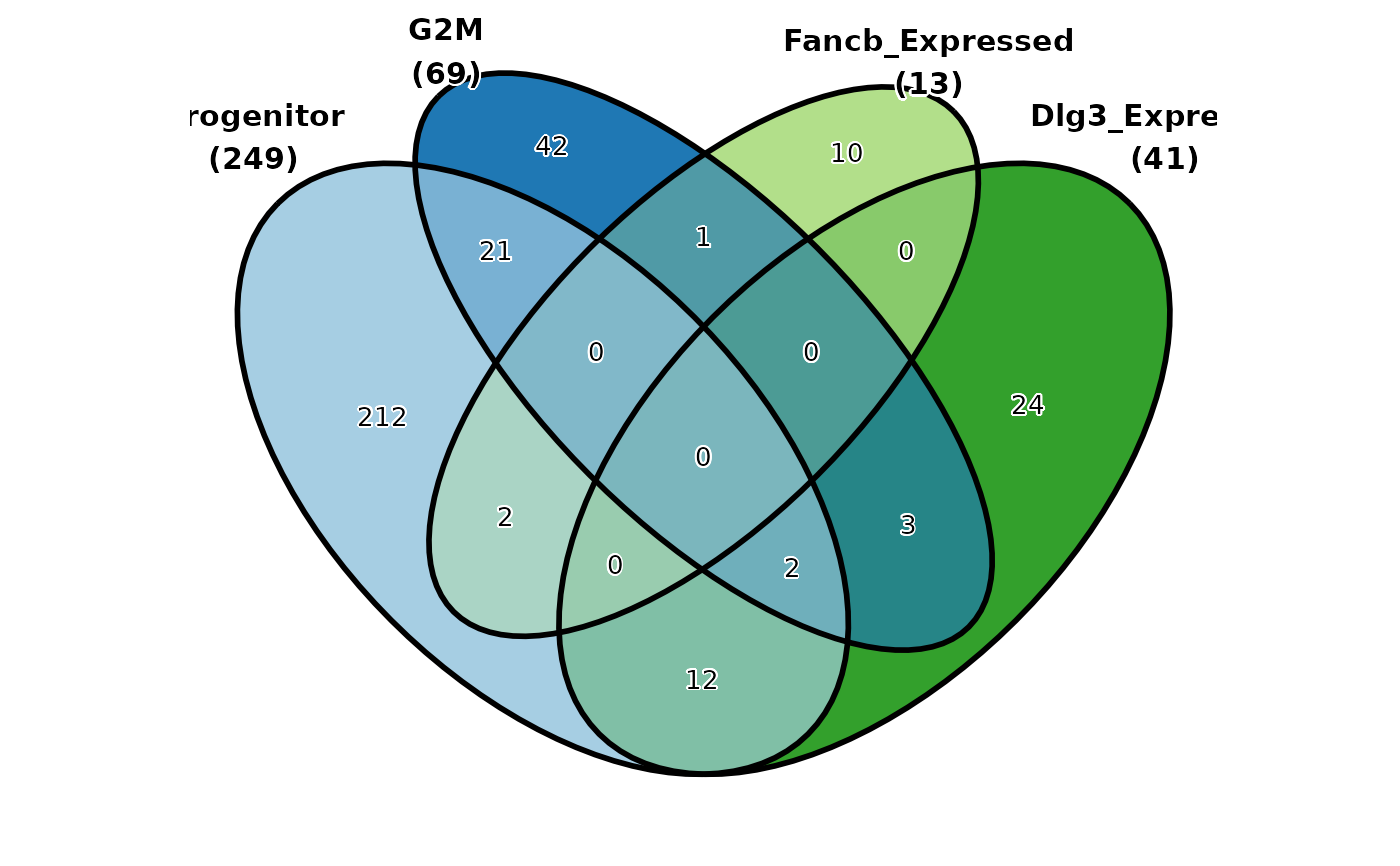
CellStatPlot(
pancreas_sub,
stat.by = c(
"Progenitor", "G2M", "Fancb_Expressed", "Dlg3_Expressed"
),
plot_type = "venn",
stat_level = "TRUE"
)
#> ! [2026-07-02 08:31:59] `stat_type` is forcibly set to "count" when plot "sankey", "chord", "venn", and "upset"
pancreas_sub$Progenitor <- pancreas_sub$CellType %in% c("Ngn3-low-EP", "Ngn3-high-EP")
pancreas_sub$G2M <- pancreas_sub$Phase == "G2M"
pancreas_sub$Fancb_Expressed <- GetAssayData5(
pancreas_sub,
assay = "RNA",
layer = "counts"
)["Fancb", ] > 0
pancreas_sub$Dlg3_Expressed <- GetAssayData5(
pancreas_sub,
assay = "RNA",
layer = "counts"
)["Dlg3", ] > 0
CellStatPlot(
pancreas_sub,
stat.by = c(
"Progenitor", "G2M", "Fancb_Expressed", "Dlg3_Expressed"
),
plot_type = "venn",
stat_level = "TRUE"
)
#> ! [2026-07-02 08:31:59] `stat_type` is forcibly set to "count" when plot "sankey", "chord", "venn", and "upset"
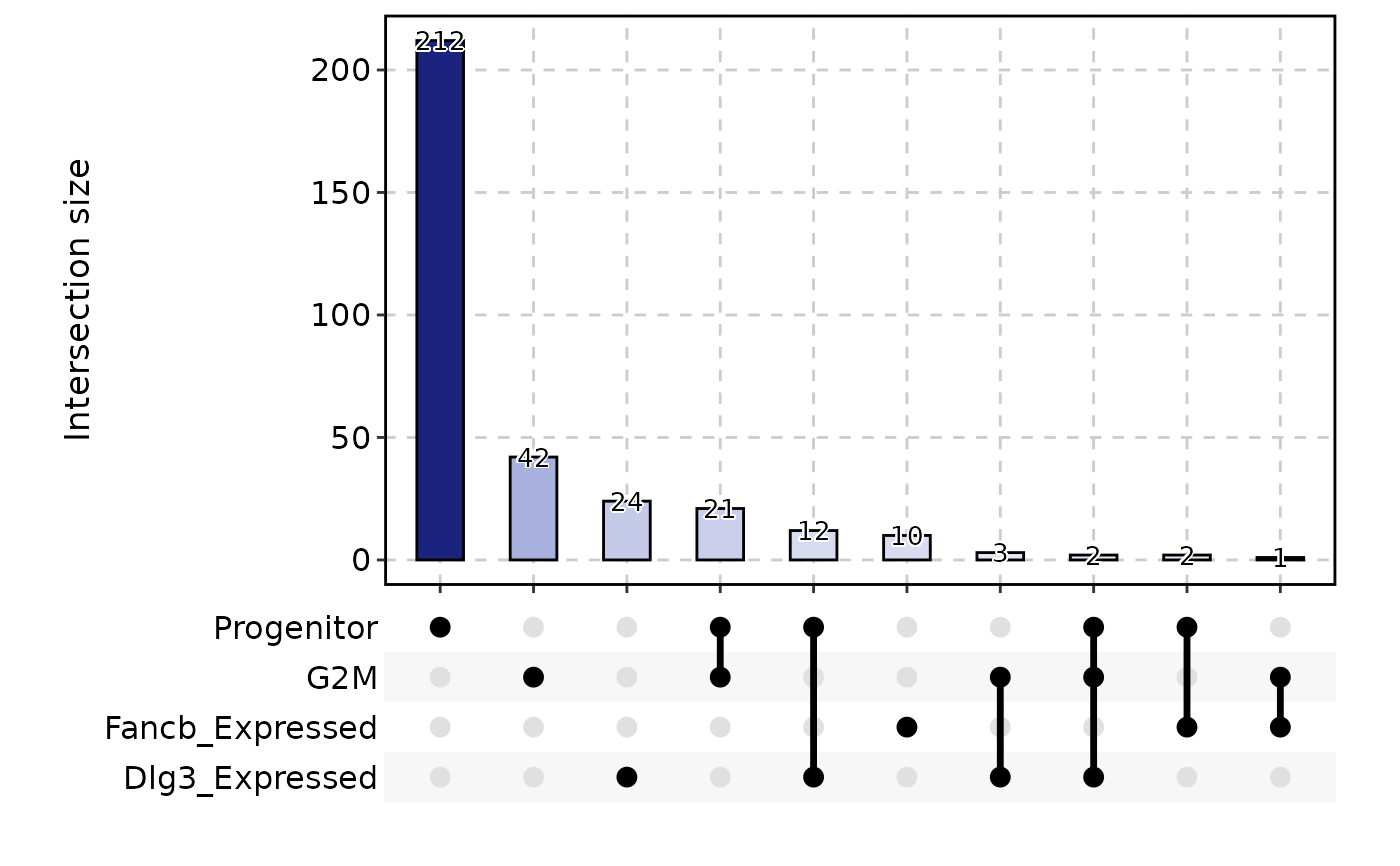 CellStatPlot(
pancreas_sub,
stat.by = c(
"Progenitor", "G2M", "Fancb_Expressed", "Dlg3_Expressed"
),
plot_type = "upset",
stat_level = "TRUE"
)
#> ! [2026-07-02 08:32:04] `stat_type` is forcibly set to "count" when plot "sankey", "chord", "venn", and "upset"
#> Warning: Using `size` aesthetic for lines was deprecated in ggplot2 3.4.0.
#> ℹ Please use `linewidth` instead.
#> ℹ The deprecated feature was likely used in the ggupset package.
#> Please report the issue at <https://github.com/const-ae/ggupset/issues>.
CellStatPlot(
pancreas_sub,
stat.by = c(
"Progenitor", "G2M", "Fancb_Expressed", "Dlg3_Expressed"
),
plot_type = "upset",
stat_level = "TRUE"
)
#> ! [2026-07-02 08:32:04] `stat_type` is forcibly set to "count" when plot "sankey", "chord", "venn", and "upset"
#> Warning: Using `size` aesthetic for lines was deprecated in ggplot2 3.4.0.
#> ℹ Please use `linewidth` instead.
#> ℹ The deprecated feature was likely used in the ggupset package.
#> Please report the issue at <https://github.com/const-ae/ggupset/issues>.
 sum(
pancreas_sub$Progenitor == "FALSE" &
pancreas_sub$G2M == "FALSE" &
pancreas_sub$Fancb_Expressed == "TRUE" &
pancreas_sub$Dlg3_Expressed == "FALSE"
)
#> [1] 6
sum(
pancreas_sub$Progenitor == "FALSE" &
pancreas_sub$G2M == "FALSE" &
pancreas_sub$Fancb_Expressed == "TRUE" &
pancreas_sub$Dlg3_Expressed == "FALSE"
)
#> [1] 6