Run metacell partitioning for single-cell data
Usage
RunMetaCell(
  srt,
  method = c("supercell", "seacells", "metacell"),
  assay = NULL,
  layer = "counts",
  gamma = 20,
  group.by = NULL,
  envname = NULL,
  conda = "auto",
  prefix = "Metacell",
  tool_name = "Metacell",
  verbose = TRUE,
  ...
)
Arguments
- srt
A Seurat object.
- method
Metacell construction method. One of
"supercell","seacells", or"metacell".- assay
Assay to use for metacell construction.
- layer
Assay layer used to extract the count matrix.
- gamma
Metacell granularity parameter. For SuperCell, larger values produce fewer metacells (typical range 10–50). For MetaCell, this is the K parameter controlling the number of metacells. For SEACells, the comparable parameter is passed via
...(e.g.n_metacells).- group.by
Optional metadata column used to build metacells within each group independently (e.g. by sample or cell type), preventing metacells from crossing group boundaries.
- envname
Python environment name (SEACells only). Passed to
reticulate::use_condaenv()whenmethod = "seacells".- conda
Conda executable path (SEACells only).
- prefix
Prefix for metadata columns written to
srt.- tool_name
Name of the
srt@toolsentry.- verbose
Whether to print the message. Default is
TRUE.- ...
Additional arguments passed to the underlying metacell method.
Value
A metacell-level Seurat object. The original single-cell Seurat
is stored in @misc[["original_srt"]] and the cell-to-metacell membership
vector in @misc[["cell_membership"]]. The returned object can be passed
directly to any scop function (standard_scop(), CellDimPlot(), etc.).
References
Baran, Y. et al. (2019). MetaCell: analysis of single-cell RNA-seq data using K-nn graph partitions. Genome Biology.
Bilous, M. et al. (2022). SuperCell: a versatile tool for single-cell data analysis. Genome Biology.
Persad, S. et al. (2023). SEACells infers transcriptional and epigenomic cellular states from single-cell genomics data. Nature Biotechnology.
Examples
data(pancreas_sub)
pancreas_sub <- standard_scop(
pancreas_sub,
nHVF = 500,
linear_reduction_dims = 20,
linear_reduction_dims_use = 1:20,
nonlinear_reduction_dims = 2,
verbose = FALSE
)
#> ℹ [2026-07-02 09:45:53] Skip `log1p()` because `layer = data` is not "counts"
mc1 <- RunMetaCell(
pancreas_sub,
method = "supercell",
gamma = 20
)
#> ℹ [2026-07-02 09:46:06] Running SuperCell with gamma = 20, k.knn = 5 on 1000 cells
#> Error in loadNamespace(name): there is no package called ‘SuperCell’
MetaCellPlot(mc1, group.by = "CellType")
#> Error: object 'mc1' not found
mc2 <- RunMetaCell(
pancreas_sub,
method = "metacell",
gamma = 20
)
#> ℹ [2026-07-02 09:46:08] Running MetaCell-style KNN partitioning with k = 20 on 1000 cells
#> Warning: x[] <- val: val is coerced to logical for "ngCMatrix" x
#> Warning: x[] <- val: val is coerced to logical for "ngCMatrix" x
#> Warning: x[] <- val: val is coerced to logical for "ngCMatrix" x
#> Warning: x[] <- val: val is coerced to logical for "ngCMatrix" x
#> Warning: x[] <- val: val is coerced to logical for "ngCMatrix" x
#> Warning: x[] <- val: val is coerced to logical for "ngCMatrix" x
#> Warning: x[] <- val: val is coerced to logical for "ngCMatrix" x
#> Warning: x[] <- val: val is coerced to logical for "ngCMatrix" x
#> Warning: x[] <- val: val is coerced to logical for "ngCMatrix" x
#> Warning: x[] <- val: val is coerced to logical for "ngCMatrix" x
#> Warning: x[] <- val: val is coerced to logical for "ngCMatrix" x
#> Warning: x[] <- val: val is coerced to logical for "ngCMatrix" x
#> Warning: x[] <- val: val is coerced to logical for "ngCMatrix" x
#> Warning: x[] <- val: val is coerced to logical for "ngCMatrix" x
#> Warning: x[] <- val: val is coerced to logical for "ngCMatrix" x
#> Warning: x[] <- val: val is coerced to logical for "ngCMatrix" x
#> Warning: x[] <- val: val is coerced to logical for "ngCMatrix" x
#> Warning: x[] <- val: val is coerced to logical for "ngCMatrix" x
#> Warning: x[] <- val: val is coerced to logical for "ngCMatrix" x
#> Warning: x[] <- val: val is coerced to logical for "ngCMatrix" x
#> Warning: x[] <- val: val is coerced to logical for "ngCMatrix" x
#> Warning: x[] <- val: val is coerced to logical for "ngCMatrix" x
#> Warning: x[] <- val: val is coerced to logical for "ngCMatrix" x
#> Warning: x[] <- val: val is coerced to logical for "ngCMatrix" x
#> Warning: x[] <- val: val is coerced to logical for "ngCMatrix" x
#> Warning: x[] <- val: val is coerced to logical for "ngCMatrix" x
#> Warning: x[] <- val: val is coerced to logical for "ngCMatrix" x
#> Warning: x[] <- val: val is coerced to logical for "ngCMatrix" x
#> Warning: x[] <- val: val is coerced to logical for "ngCMatrix" x
#> Warning: x[] <- val: val is coerced to logical for "ngCMatrix" x
#> Warning: x[] <- val: val is coerced to logical for "ngCMatrix" x
#> Warning: x[] <- val: val is coerced to logical for "ngCMatrix" x
#> Warning: x[] <- val: val is coerced to logical for "ngCMatrix" x
#> Warning: x[] <- val: val is coerced to logical for "ngCMatrix" x
#> Warning: x[] <- val: val is coerced to logical for "ngCMatrix" x
#> Warning: x[] <- val: val is coerced to logical for "ngCMatrix" x
#> Warning: x[] <- val: val is coerced to logical for "ngCMatrix" x
#> Warning: x[] <- val: val is coerced to logical for "ngCMatrix" x
#> Warning: x[] <- val: val is coerced to logical for "ngCMatrix" x
#> Warning: x[] <- val: val is coerced to logical for "ngCMatrix" x
#> Warning: x[] <- val: val is coerced to logical for "ngCMatrix" x
#> Warning: x[] <- val: val is coerced to logical for "ngCMatrix" x
#> Warning: x[] <- val: val is coerced to logical for "ngCMatrix" x
#> Warning: x[] <- val: val is coerced to logical for "ngCMatrix" x
#> Warning: x[] <- val: val is coerced to logical for "ngCMatrix" x
#> Warning: x[] <- val: val is coerced to logical for "ngCMatrix" x
#> Warning: x[] <- val: val is coerced to logical for "ngCMatrix" x
#> Warning: x[] <- val: val is coerced to logical for "ngCMatrix" x
#> Warning: x[] <- val: val is coerced to logical for "ngCMatrix" x
#> Warning: x[] <- val: val is coerced to logical for "ngCMatrix" x
#> Warning: x[] <- val: val is coerced to logical for "ngCMatrix" x
#> Warning: x[] <- val: val is coerced to logical for "ngCMatrix" x
#> Warning: x[] <- val: val is coerced to logical for "ngCMatrix" x
#> Warning: x[] <- val: val is coerced to logical for "ngCMatrix" x
#> Warning: x[] <- val: val is coerced to logical for "ngCMatrix" x
#> Warning: x[] <- val: val is coerced to logical for "ngCMatrix" x
#> Warning: x[] <- val: val is coerced to logical for "ngCMatrix" x
#> Warning: x[] <- val: val is coerced to logical for "ngCMatrix" x
#> Warning: x[] <- val: val is coerced to logical for "ngCMatrix" x
#> Warning: x[] <- val: val is coerced to logical for "ngCMatrix" x
#> Warning: x[] <- val: val is coerced to logical for "ngCMatrix" x
#> Warning: x[] <- val: val is coerced to logical for "ngCMatrix" x
#> Warning: x[] <- val: val is coerced to logical for "ngCMatrix" x
#> Warning: x[] <- val: val is coerced to logical for "ngCMatrix" x
#> Warning: x[] <- val: val is coerced to logical for "ngCMatrix" x
#> Warning: x[] <- val: val is coerced to logical for "ngCMatrix" x
#> Warning: x[] <- val: val is coerced to logical for "ngCMatrix" x
#> Warning: x[] <- val: val is coerced to logical for "ngCMatrix" x
#> Warning: x[] <- val: val is coerced to logical for "ngCMatrix" x
#> Warning: x[] <- val: val is coerced to logical for "ngCMatrix" x
#> Warning: x[] <- val: val is coerced to logical for "ngCMatrix" x
#> Warning: x[] <- val: val is coerced to logical for "ngCMatrix" x
#> Warning: x[] <- val: val is coerced to logical for "ngCMatrix" x
#> Warning: x[] <- val: val is coerced to logical for "ngCMatrix" x
#> Warning: x[] <- val: val is coerced to logical for "ngCMatrix" x
#> Warning: x[] <- val: val is coerced to logical for "ngCMatrix" x
#> Warning: x[] <- val: val is coerced to logical for "ngCMatrix" x
#> Warning: x[] <- val: val is coerced to logical for "ngCMatrix" x
#> Warning: x[] <- val: val is coerced to logical for "ngCMatrix" x
#> Warning: x[] <- val: val is coerced to logical for "ngCMatrix" x
#> Warning: x[] <- val: val is coerced to logical for "ngCMatrix" x
#> Warning: x[] <- val: val is coerced to logical for "ngCMatrix" x
#> Warning: x[] <- val: val is coerced to logical for "ngCMatrix" x
#> Warning: x[] <- val: val is coerced to logical for "ngCMatrix" x
#> Warning: x[] <- val: val is coerced to logical for "ngCMatrix" x
#> Warning: x[] <- val: val is coerced to logical for "ngCMatrix" x
#> Warning: x[] <- val: val is coerced to logical for "ngCMatrix" x
#> Warning: x[] <- val: val is coerced to logical for "ngCMatrix" x
#> Warning: x[] <- val: val is coerced to logical for "ngCMatrix" x
#> Warning: x[] <- val: val is coerced to logical for "ngCMatrix" x
#> Warning: x[] <- val: val is coerced to logical for "ngCMatrix" x
#> Warning: x[] <- val: val is coerced to logical for "ngCMatrix" x
#> Warning: x[] <- val: val is coerced to logical for "ngCMatrix" x
#> Warning: x[] <- val: val is coerced to logical for "ngCMatrix" x
#> Warning: x[] <- val: val is coerced to logical for "ngCMatrix" x
#> Warning: x[] <- val: val is coerced to logical for "ngCMatrix" x
#> Warning: x[] <- val: val is coerced to logical for "ngCMatrix" x
#> Warning: x[] <- val: val is coerced to logical for "ngCMatrix" x
#> Warning: x[] <- val: val is coerced to logical for "ngCMatrix" x
#> Warning: x[] <- val: val is coerced to logical for "ngCMatrix" x
#> Warning: x[] <- val: val is coerced to logical for "ngCMatrix" x
#> Warning: x[] <- val: val is coerced to logical for "ngCMatrix" x
#> Warning: x[] <- val: val is coerced to logical for "ngCMatrix" x
#> Warning: x[] <- val: val is coerced to logical for "ngCMatrix" x
#> Warning: x[] <- val: val is coerced to logical for "ngCMatrix" x
#> Warning: x[] <- val: val is coerced to logical for "ngCMatrix" x
#> Warning: x[] <- val: val is coerced to logical for "ngCMatrix" x
#> Warning: x[] <- val: val is coerced to logical for "ngCMatrix" x
#> Warning: x[] <- val: val is coerced to logical for "ngCMatrix" x
#> Warning: x[] <- val: val is coerced to logical for "ngCMatrix" x
#> Warning: x[] <- val: val is coerced to logical for "ngCMatrix" x
#> Warning: x[] <- val: val is coerced to logical for "ngCMatrix" x
#> Warning: x[] <- val: val is coerced to logical for "ngCMatrix" x
#> Warning: x[] <- val: val is coerced to logical for "ngCMatrix" x
#> Warning: x[] <- val: val is coerced to logical for "ngCMatrix" x
#> Warning: x[] <- val: val is coerced to logical for "ngCMatrix" x
#> Warning: x[] <- val: val is coerced to logical for "ngCMatrix" x
#> Warning: x[] <- val: val is coerced to logical for "ngCMatrix" x
#> Warning: x[] <- val: val is coerced to logical for "ngCMatrix" x
#> Warning: x[] <- val: val is coerced to logical for "ngCMatrix" x
#> Warning: x[] <- val: val is coerced to logical for "ngCMatrix" x
#> Warning: x[] <- val: val is coerced to logical for "ngCMatrix" x
#> Warning: x[] <- val: val is coerced to logical for "ngCMatrix" x
#> Warning: x[] <- val: val is coerced to logical for "ngCMatrix" x
#> Warning: x[] <- val: val is coerced to logical for "ngCMatrix" x
#> Warning: x[] <- val: val is coerced to logical for "ngCMatrix" x
#> Warning: x[] <- val: val is coerced to logical for "ngCMatrix" x
#> Warning: x[] <- val: val is coerced to logical for "ngCMatrix" x
#> Warning: x[] <- val: val is coerced to logical for "ngCMatrix" x
#> Warning: x[] <- val: val is coerced to logical for "ngCMatrix" x
#> Warning: x[] <- val: val is coerced to logical for "ngCMatrix" x
#> Warning: x[] <- val: val is coerced to logical for "ngCMatrix" x
#> Warning: x[] <- val: val is coerced to logical for "ngCMatrix" x
#> Warning: x[] <- val: val is coerced to logical for "ngCMatrix" x
#> Warning: x[] <- val: val is coerced to logical for "ngCMatrix" x
#> Warning: x[] <- val: val is coerced to logical for "ngCMatrix" x
#> Warning: x[] <- val: val is coerced to logical for "ngCMatrix" x
#> Warning: x[] <- val: val is coerced to logical for "ngCMatrix" x
#> Warning: x[] <- val: val is coerced to logical for "ngCMatrix" x
#> Warning: x[] <- val: val is coerced to logical for "ngCMatrix" x
#> Warning: x[] <- val: val is coerced to logical for "ngCMatrix" x
#> Warning: x[] <- val: val is coerced to logical for "ngCMatrix" x
#> Warning: x[] <- val: val is coerced to logical for "ngCMatrix" x
#> Warning: x[] <- val: val is coerced to logical for "ngCMatrix" x
#> Warning: x[] <- val: val is coerced to logical for "ngCMatrix" x
#> Warning: x[] <- val: val is coerced to logical for "ngCMatrix" x
#> Warning: x[] <- val: val is coerced to logical for "ngCMatrix" x
#> Warning: x[] <- val: val is coerced to logical for "ngCMatrix" x
#> Warning: x[] <- val: val is coerced to logical for "ngCMatrix" x
#> Warning: x[] <- val: val is coerced to logical for "ngCMatrix" x
#> Warning: x[] <- val: val is coerced to logical for "ngCMatrix" x
#> Warning: x[] <- val: val is coerced to logical for "ngCMatrix" x
#> Warning: x[] <- val: val is coerced to logical for "ngCMatrix" x
#> Warning: x[] <- val: val is coerced to logical for "ngCMatrix" x
#> Warning: x[] <- val: val is coerced to logical for "ngCMatrix" x
#> Warning: x[] <- val: val is coerced to logical for "ngCMatrix" x
#> Warning: x[] <- val: val is coerced to logical for "ngCMatrix" x
#> Warning: x[] <- val: val is coerced to logical for "ngCMatrix" x
#> Warning: x[] <- val: val is coerced to logical for "ngCMatrix" x
#> Warning: x[] <- val: val is coerced to logical for "ngCMatrix" x
#> Warning: x[] <- val: val is coerced to logical for "ngCMatrix" x
#> Warning: x[] <- val: val is coerced to logical for "ngCMatrix" x
#> Warning: x[] <- val: val is coerced to logical for "ngCMatrix" x
#> Warning: x[] <- val: val is coerced to logical for "ngCMatrix" x
#> Warning: x[] <- val: val is coerced to logical for "ngCMatrix" x
#> Warning: x[] <- val: val is coerced to logical for "ngCMatrix" x
#> Warning: x[] <- val: val is coerced to logical for "ngCMatrix" x
#> Warning: x[] <- val: val is coerced to logical for "ngCMatrix" x
#> Warning: x[] <- val: val is coerced to logical for "ngCMatrix" x
#> Warning: x[] <- val: val is coerced to logical for "ngCMatrix" x
#> Warning: x[] <- val: val is coerced to logical for "ngCMatrix" x
#> Warning: x[] <- val: val is coerced to logical for "ngCMatrix" x
#> Warning: x[] <- val: val is coerced to logical for "ngCMatrix" x
#> Warning: x[] <- val: val is coerced to logical for "ngCMatrix" x
#> Warning: x[] <- val: val is coerced to logical for "ngCMatrix" x
#> Warning: x[] <- val: val is coerced to logical for "ngCMatrix" x
#> Warning: x[] <- val: val is coerced to logical for "ngCMatrix" x
#> Warning: x[] <- val: val is coerced to logical for "ngCMatrix" x
#> Warning: x[] <- val: val is coerced to logical for "ngCMatrix" x
#> Warning: x[] <- val: val is coerced to logical for "ngCMatrix" x
#> Warning: x[] <- val: val is coerced to logical for "ngCMatrix" x
#> Warning: x[] <- val: val is coerced to logical for "ngCMatrix" x
#> Warning: x[] <- val: val is coerced to logical for "ngCMatrix" x
#> Warning: x[] <- val: val is coerced to logical for "ngCMatrix" x
#> Warning: x[] <- val: val is coerced to logical for "ngCMatrix" x
#> Warning: x[] <- val: val is coerced to logical for "ngCMatrix" x
#> Warning: x[] <- val: val is coerced to logical for "ngCMatrix" x
#> Warning: x[] <- val: val is coerced to logical for "ngCMatrix" x
#> Warning: x[] <- val: val is coerced to logical for "ngCMatrix" x
#> Warning: x[] <- val: val is coerced to logical for "ngCMatrix" x
#> Warning: x[] <- val: val is coerced to logical for "ngCMatrix" x
#> Warning: x[] <- val: val is coerced to logical for "ngCMatrix" x
#> Warning: x[] <- val: val is coerced to logical for "ngCMatrix" x
#> Warning: x[] <- val: val is coerced to logical for "ngCMatrix" x
#> Warning: x[] <- val: val is coerced to logical for "ngCMatrix" x
#> Warning: x[] <- val: val is coerced to logical for "ngCMatrix" x
#> Warning: x[] <- val: val is coerced to logical for "ngCMatrix" x
#> Warning: x[] <- val: val is coerced to logical for "ngCMatrix" x
#> Warning: x[] <- val: val is coerced to logical for "ngCMatrix" x
#> Warning: x[] <- val: val is coerced to logical for "ngCMatrix" x
#> Warning: x[] <- val: val is coerced to logical for "ngCMatrix" x
#> Warning: x[] <- val: val is coerced to logical for "ngCMatrix" x
#> Warning: x[] <- val: val is coerced to logical for "ngCMatrix" x
#> Warning: x[] <- val: val is coerced to logical for "ngCMatrix" x
#> Warning: x[] <- val: val is coerced to logical for "ngCMatrix" x
#> Warning: x[] <- val: val is coerced to logical for "ngCMatrix" x
#> Warning: x[] <- val: val is coerced to logical for "ngCMatrix" x
#> Warning: x[] <- val: val is coerced to logical for "ngCMatrix" x
#> Warning: x[] <- val: val is coerced to logical for "ngCMatrix" x
#> Warning: x[] <- val: val is coerced to logical for "ngCMatrix" x
#> Warning: x[] <- val: val is coerced to logical for "ngCMatrix" x
#> Warning: x[] <- val: val is coerced to logical for "ngCMatrix" x
#> Warning: x[] <- val: val is coerced to logical for "ngCMatrix" x
#> Warning: x[] <- val: val is coerced to logical for "ngCMatrix" x
#> Warning: x[] <- val: val is coerced to logical for "ngCMatrix" x
#> Warning: x[] <- val: val is coerced to logical for "ngCMatrix" x
#> Warning: x[] <- val: val is coerced to logical for "ngCMatrix" x
#> Warning: x[] <- val: val is coerced to logical for "ngCMatrix" x
#> Warning: x[] <- val: val is coerced to logical for "ngCMatrix" x
#> Warning: x[] <- val: val is coerced to logical for "ngCMatrix" x
#> Warning: x[] <- val: val is coerced to logical for "ngCMatrix" x
#> Warning: x[] <- val: val is coerced to logical for "ngCMatrix" x
#> Warning: x[] <- val: val is coerced to logical for "ngCMatrix" x
#> Warning: x[] <- val: val is coerced to logical for "ngCMatrix" x
#> Warning: x[] <- val: val is coerced to logical for "ngCMatrix" x
#> Warning: x[] <- val: val is coerced to logical for "ngCMatrix" x
#> Warning: x[] <- val: val is coerced to logical for "ngCMatrix" x
#> Warning: x[] <- val: val is coerced to logical for "ngCMatrix" x
#> Warning: x[] <- val: val is coerced to logical for "ngCMatrix" x
#> Warning: x[] <- val: val is coerced to logical for "ngCMatrix" x
#> Warning: x[] <- val: val is coerced to logical for "ngCMatrix" x
#> Warning: x[] <- val: val is coerced to logical for "ngCMatrix" x
#> Warning: x[] <- val: val is coerced to logical for "ngCMatrix" x
#> Warning: x[] <- val: val is coerced to logical for "ngCMatrix" x
#> Warning: x[] <- val: val is coerced to logical for "ngCMatrix" x
#> Warning: x[] <- val: val is coerced to logical for "ngCMatrix" x
#> Warning: x[] <- val: val is coerced to logical for "ngCMatrix" x
#> Warning: x[] <- val: val is coerced to logical for "ngCMatrix" x
#> Warning: x[] <- val: val is coerced to logical for "ngCMatrix" x
#> Warning: x[] <- val: val is coerced to logical for "ngCMatrix" x
#> Warning: x[] <- val: val is coerced to logical for "ngCMatrix" x
#> Warning: x[] <- val: val is coerced to logical for "ngCMatrix" x
#> Warning: x[] <- val: val is coerced to logical for "ngCMatrix" x
#> Warning: x[] <- val: val is coerced to logical for "ngCMatrix" x
#> Warning: x[] <- val: val is coerced to logical for "ngCMatrix" x
#> Warning: x[] <- val: val is coerced to logical for "ngCMatrix" x
#> Warning: x[] <- val: val is coerced to logical for "ngCMatrix" x
#> Warning: x[] <- val: val is coerced to logical for "ngCMatrix" x
#> Warning: x[] <- val: val is coerced to logical for "ngCMatrix" x
#> Warning: x[] <- val: val is coerced to logical for "ngCMatrix" x
#> Warning: x[] <- val: val is coerced to logical for "ngCMatrix" x
#> Warning: x[] <- val: val is coerced to logical for "ngCMatrix" x
#> Warning: x[] <- val: val is coerced to logical for "ngCMatrix" x
#> Warning: x[] <- val: val is coerced to logical for "ngCMatrix" x
#> Warning: x[] <- val: val is coerced to logical for "ngCMatrix" x
#> Warning: x[] <- val: val is coerced to logical for "ngCMatrix" x
#> Warning: x[] <- val: val is coerced to logical for "ngCMatrix" x
#> Warning: x[] <- val: val is coerced to logical for "ngCMatrix" x
#> Warning: x[] <- val: val is coerced to logical for "ngCMatrix" x
#> Warning: x[] <- val: val is coerced to logical for "ngCMatrix" x
#> Warning: x[] <- val: val is coerced to logical for "ngCMatrix" x
#> Warning: x[] <- val: val is coerced to logical for "ngCMatrix" x
#> Warning: x[] <- val: val is coerced to logical for "ngCMatrix" x
#> Warning: x[] <- val: val is coerced to logical for "ngCMatrix" x
#> Warning: x[] <- val: val is coerced to logical for "ngCMatrix" x
#> Warning: x[] <- val: val is coerced to logical for "ngCMatrix" x
#> Warning: x[] <- val: val is coerced to logical for "ngCMatrix" x
#> Warning: x[] <- val: val is coerced to logical for "ngCMatrix" x
#> Warning: x[] <- val: val is coerced to logical for "ngCMatrix" x
#> Warning: x[] <- val: val is coerced to logical for "ngCMatrix" x
#> Warning: x[] <- val: val is coerced to logical for "ngCMatrix" x
#> Warning: x[] <- val: val is coerced to logical for "ngCMatrix" x
#> Warning: x[] <- val: val is coerced to logical for "ngCMatrix" x
#> Warning: x[] <- val: val is coerced to logical for "ngCMatrix" x
#> Warning: x[] <- val: val is coerced to logical for "ngCMatrix" x
#> Warning: x[] <- val: val is coerced to logical for "ngCMatrix" x
#> Warning: x[] <- val: val is coerced to logical for "ngCMatrix" x
#> Warning: x[] <- val: val is coerced to logical for "ngCMatrix" x
#> Warning: x[] <- val: val is coerced to logical for "ngCMatrix" x
#> Warning: x[] <- val: val is coerced to logical for "ngCMatrix" x
#> Warning: x[] <- val: val is coerced to logical for "ngCMatrix" x
#> Warning: x[] <- val: val is coerced to logical for "ngCMatrix" x
#> Warning: x[] <- val: val is coerced to logical for "ngCMatrix" x
#> Warning: x[] <- val: val is coerced to logical for "ngCMatrix" x
#> Warning: x[] <- val: val is coerced to logical for "ngCMatrix" x
#> Warning: x[] <- val: val is coerced to logical for "ngCMatrix" x
#> Warning: x[] <- val: val is coerced to logical for "ngCMatrix" x
#> Warning: x[] <- val: val is coerced to logical for "ngCMatrix" x
#> Warning: x[] <- val: val is coerced to logical for "ngCMatrix" x
#> Warning: x[] <- val: val is coerced to logical for "ngCMatrix" x
#> Warning: x[] <- val: val is coerced to logical for "ngCMatrix" x
#> Warning: x[] <- val: val is coerced to logical for "ngCMatrix" x
#> Warning: x[] <- val: val is coerced to logical for "ngCMatrix" x
#> Warning: x[] <- val: val is coerced to logical for "ngCMatrix" x
#> Warning: x[] <- val: val is coerced to logical for "ngCMatrix" x
#> Warning: x[] <- val: val is coerced to logical for "ngCMatrix" x
#> Warning: x[] <- val: val is coerced to logical for "ngCMatrix" x
#> Warning: x[] <- val: val is coerced to logical for "ngCMatrix" x
#> Warning: x[] <- val: val is coerced to logical for "ngCMatrix" x
#> Warning: x[] <- val: val is coerced to logical for "ngCMatrix" x
#> Warning: x[] <- val: val is coerced to logical for "ngCMatrix" x
#> Warning: x[] <- val: val is coerced to logical for "ngCMatrix" x
#> Warning: x[] <- val: val is coerced to logical for "ngCMatrix" x
#> Warning: x[] <- val: val is coerced to logical for "ngCMatrix" x
#> Warning: x[] <- val: val is coerced to logical for "ngCMatrix" x
#> Warning: x[] <- val: val is coerced to logical for "ngCMatrix" x
#> Warning: x[] <- val: val is coerced to logical for "ngCMatrix" x
#> Warning: x[] <- val: val is coerced to logical for "ngCMatrix" x
#> Warning: x[] <- val: val is coerced to logical for "ngCMatrix" x
#> Warning: x[] <- val: val is coerced to logical for "ngCMatrix" x
#> Warning: x[] <- val: val is coerced to logical for "ngCMatrix" x
#> Warning: x[] <- val: val is coerced to logical for "ngCMatrix" x
#> Warning: x[] <- val: val is coerced to logical for "ngCMatrix" x
#> Warning: x[] <- val: val is coerced to logical for "ngCMatrix" x
#> Warning: x[] <- val: val is coerced to logical for "ngCMatrix" x
#> Warning: x[] <- val: val is coerced to logical for "ngCMatrix" x
#> Warning: x[] <- val: val is coerced to logical for "ngCMatrix" x
#> Warning: x[] <- val: val is coerced to logical for "ngCMatrix" x
#> Warning: x[] <- val: val is coerced to logical for "ngCMatrix" x
#> Warning: x[] <- val: val is coerced to logical for "ngCMatrix" x
#> Warning: x[] <- val: val is coerced to logical for "ngCMatrix" x
#> Warning: x[] <- val: val is coerced to logical for "ngCMatrix" x
#> Warning: x[] <- val: val is coerced to logical for "ngCMatrix" x
#> Warning: x[] <- val: val is coerced to logical for "ngCMatrix" x
#> Warning: x[] <- val: val is coerced to logical for "ngCMatrix" x
#> Warning: x[] <- val: val is coerced to logical for "ngCMatrix" x
#> Warning: x[] <- val: val is coerced to logical for "ngCMatrix" x
#> Warning: x[] <- val: val is coerced to logical for "ngCMatrix" x
#> Warning: x[] <- val: val is coerced to logical for "ngCMatrix" x
#> Warning: x[] <- val: val is coerced to logical for "ngCMatrix" x
#> Warning: x[] <- val: val is coerced to logical for "ngCMatrix" x
#> Warning: x[] <- val: val is coerced to logical for "ngCMatrix" x
#> Warning: x[] <- val: val is coerced to logical for "ngCMatrix" x
#> Warning: x[] <- val: val is coerced to logical for "ngCMatrix" x
#> Warning: x[] <- val: val is coerced to logical for "ngCMatrix" x
#> Warning: x[] <- val: val is coerced to logical for "ngCMatrix" x
#> Warning: x[] <- val: val is coerced to logical for "ngCMatrix" x
#> Warning: x[] <- val: val is coerced to logical for "ngCMatrix" x
#> Warning: x[] <- val: val is coerced to logical for "ngCMatrix" x
#> Warning: x[] <- val: val is coerced to logical for "ngCMatrix" x
#> Warning: x[] <- val: val is coerced to logical for "ngCMatrix" x
#> Warning: x[] <- val: val is coerced to logical for "ngCMatrix" x
#> Warning: x[] <- val: val is coerced to logical for "ngCMatrix" x
#> Warning: x[] <- val: val is coerced to logical for "ngCMatrix" x
#> Warning: x[] <- val: val is coerced to logical for "ngCMatrix" x
#> Warning: x[] <- val: val is coerced to logical for "ngCMatrix" x
#> Warning: x[] <- val: val is coerced to logical for "ngCMatrix" x
#> Warning: x[] <- val: val is coerced to logical for "ngCMatrix" x
#> Warning: x[] <- val: val is coerced to logical for "ngCMatrix" x
#> Warning: x[] <- val: val is coerced to logical for "ngCMatrix" x
#> Warning: x[] <- val: val is coerced to logical for "ngCMatrix" x
#> Warning: x[] <- val: val is coerced to logical for "ngCMatrix" x
#> Warning: x[] <- val: val is coerced to logical for "ngCMatrix" x
#> Warning: x[] <- val: val is coerced to logical for "ngCMatrix" x
#> Warning: x[] <- val: val is coerced to logical for "ngCMatrix" x
#> Warning: x[] <- val: val is coerced to logical for "ngCMatrix" x
#> Warning: x[] <- val: val is coerced to logical for "ngCMatrix" x
#> Warning: x[] <- val: val is coerced to logical for "ngCMatrix" x
#> Warning: x[] <- val: val is coerced to logical for "ngCMatrix" x
#> Warning: x[] <- val: val is coerced to logical for "ngCMatrix" x
#> Warning: x[] <- val: val is coerced to logical for "ngCMatrix" x
#> Warning: x[] <- val: val is coerced to logical for "ngCMatrix" x
#> Warning: x[] <- val: val is coerced to logical for "ngCMatrix" x
#> Warning: x[] <- val: val is coerced to logical for "ngCMatrix" x
#> Warning: x[] <- val: val is coerced to logical for "ngCMatrix" x
#> Warning: x[] <- val: val is coerced to logical for "ngCMatrix" x
#> Warning: x[] <- val: val is coerced to logical for "ngCMatrix" x
#> Warning: x[] <- val: val is coerced to logical for "ngCMatrix" x
#> Warning: x[] <- val: val is coerced to logical for "ngCMatrix" x
#> Warning: x[] <- val: val is coerced to logical for "ngCMatrix" x
#> Warning: x[] <- val: val is coerced to logical for "ngCMatrix" x
#> Warning: x[] <- val: val is coerced to logical for "ngCMatrix" x
#> Warning: x[] <- val: val is coerced to logical for "ngCMatrix" x
#> Warning: x[] <- val: val is coerced to logical for "ngCMatrix" x
#> Warning: x[] <- val: val is coerced to logical for "ngCMatrix" x
#> Warning: x[] <- val: val is coerced to logical for "ngCMatrix" x
#> Warning: x[] <- val: val is coerced to logical for "ngCMatrix" x
#> Warning: x[] <- val: val is coerced to logical for "ngCMatrix" x
#> Warning: x[] <- val: val is coerced to logical for "ngCMatrix" x
#> Warning: x[] <- val: val is coerced to logical for "ngCMatrix" x
#> Warning: x[] <- val: val is coerced to logical for "ngCMatrix" x
#> Warning: x[] <- val: val is coerced to logical for "ngCMatrix" x
#> Warning: x[] <- val: val is coerced to logical for "ngCMatrix" x
#> Warning: x[] <- val: val is coerced to logical for "ngCMatrix" x
#> Warning: x[] <- val: val is coerced to logical for "ngCMatrix" x
#> Warning: x[] <- val: val is coerced to logical for "ngCMatrix" x
#> Warning: x[] <- val: val is coerced to logical for "ngCMatrix" x
#> Warning: x[] <- val: val is coerced to logical for "ngCMatrix" x
#> Warning: x[] <- val: val is coerced to logical for "ngCMatrix" x
#> Warning: x[] <- val: val is coerced to logical for "ngCMatrix" x
#> Warning: x[] <- val: val is coerced to logical for "ngCMatrix" x
#> Warning: x[] <- val: val is coerced to logical for "ngCMatrix" x
#> Warning: x[] <- val: val is coerced to logical for "ngCMatrix" x
#> Warning: x[] <- val: val is coerced to logical for "ngCMatrix" x
#> Warning: x[] <- val: val is coerced to logical for "ngCMatrix" x
#> Warning: x[] <- val: val is coerced to logical for "ngCMatrix" x
#> Warning: x[] <- val: val is coerced to logical for "ngCMatrix" x
#> Warning: x[] <- val: val is coerced to logical for "ngCMatrix" x
#> Warning: x[] <- val: val is coerced to logical for "ngCMatrix" x
#> Warning: x[] <- val: val is coerced to logical for "ngCMatrix" x
#> Warning: x[] <- val: val is coerced to logical for "ngCMatrix" x
#> Warning: x[] <- val: val is coerced to logical for "ngCMatrix" x
#> Warning: x[] <- val: val is coerced to logical for "ngCMatrix" x
#> Warning: x[] <- val: val is coerced to logical for "ngCMatrix" x
#> Warning: x[] <- val: val is coerced to logical for "ngCMatrix" x
#> Warning: x[] <- val: val is coerced to logical for "ngCMatrix" x
#> Warning: x[] <- val: val is coerced to logical for "ngCMatrix" x
#> Warning: x[] <- val: val is coerced to logical for "ngCMatrix" x
#> Warning: x[] <- val: val is coerced to logical for "ngCMatrix" x
#> Warning: x[] <- val: val is coerced to logical for "ngCMatrix" x
#> Warning: x[] <- val: val is coerced to logical for "ngCMatrix" x
#> Warning: x[] <- val: val is coerced to logical for "ngCMatrix" x
#> Warning: x[] <- val: val is coerced to logical for "ngCMatrix" x
#> Warning: x[] <- val: val is coerced to logical for "ngCMatrix" x
#> Warning: x[] <- val: val is coerced to logical for "ngCMatrix" x
#> Warning: x[] <- val: val is coerced to logical for "ngCMatrix" x
#> Warning: x[] <- val: val is coerced to logical for "ngCMatrix" x
#> Warning: x[] <- val: val is coerced to logical for "ngCMatrix" x
#> Warning: x[] <- val: val is coerced to logical for "ngCMatrix" x
#> Warning: x[] <- val: val is coerced to logical for "ngCMatrix" x
#> Warning: x[] <- val: val is coerced to logical for "ngCMatrix" x
#> Warning: x[] <- val: val is coerced to logical for "ngCMatrix" x
#> Warning: x[] <- val: val is coerced to logical for "ngCMatrix" x
#> Warning: x[] <- val: val is coerced to logical for "ngCMatrix" x
#> Warning: x[] <- val: val is coerced to logical for "ngCMatrix" x
#> Warning: x[] <- val: val is coerced to logical for "ngCMatrix" x
#> Warning: x[] <- val: val is coerced to logical for "ngCMatrix" x
#> Warning: x[] <- val: val is coerced to logical for "ngCMatrix" x
#> Warning: x[] <- val: val is coerced to logical for "ngCMatrix" x
#> Warning: x[] <- val: val is coerced to logical for "ngCMatrix" x
#> Warning: x[] <- val: val is coerced to logical for "ngCMatrix" x
#> Warning: x[] <- val: val is coerced to logical for "ngCMatrix" x
#> Warning: x[] <- val: val is coerced to logical for "ngCMatrix" x
#> Warning: x[] <- val: val is coerced to logical for "ngCMatrix" x
#> Warning: x[] <- val: val is coerced to logical for "ngCMatrix" x
#> Warning: x[] <- val: val is coerced to logical for "ngCMatrix" x
#> Warning: x[] <- val: val is coerced to logical for "ngCMatrix" x
#> Warning: x[] <- val: val is coerced to logical for "ngCMatrix" x
#> Warning: x[] <- val: val is coerced to logical for "ngCMatrix" x
#> Warning: x[] <- val: val is coerced to logical for "ngCMatrix" x
#> Warning: x[] <- val: val is coerced to logical for "ngCMatrix" x
#> Warning: x[] <- val: val is coerced to logical for "ngCMatrix" x
#> Warning: x[] <- val: val is coerced to logical for "ngCMatrix" x
#> Warning: x[] <- val: val is coerced to logical for "ngCMatrix" x
#> Warning: x[] <- val: val is coerced to logical for "ngCMatrix" x
#> Warning: x[] <- val: val is coerced to logical for "ngCMatrix" x
#> Warning: x[] <- val: val is coerced to logical for "ngCMatrix" x
#> Warning: x[] <- val: val is coerced to logical for "ngCMatrix" x
#> Warning: x[] <- val: val is coerced to logical for "ngCMatrix" x
#> Warning: x[] <- val: val is coerced to logical for "ngCMatrix" x
#> Warning: x[] <- val: val is coerced to logical for "ngCMatrix" x
#> Warning: x[] <- val: val is coerced to logical for "ngCMatrix" x
#> Warning: x[] <- val: val is coerced to logical for "ngCMatrix" x
#> Warning: x[] <- val: val is coerced to logical for "ngCMatrix" x
#> Warning: x[] <- val: val is coerced to logical for "ngCMatrix" x
#> Warning: x[] <- val: val is coerced to logical for "ngCMatrix" x
#> Warning: x[] <- val: val is coerced to logical for "ngCMatrix" x
#> Warning: x[] <- val: val is coerced to logical for "ngCMatrix" x
#> Warning: x[] <- val: val is coerced to logical for "ngCMatrix" x
#> Warning: x[] <- val: val is coerced to logical for "ngCMatrix" x
#> Warning: x[] <- val: val is coerced to logical for "ngCMatrix" x
#> Warning: x[] <- val: val is coerced to logical for "ngCMatrix" x
#> Warning: x[] <- val: val is coerced to logical for "ngCMatrix" x
#> Warning: x[] <- val: val is coerced to logical for "ngCMatrix" x
#> Warning: x[] <- val: val is coerced to logical for "ngCMatrix" x
#> Warning: x[] <- val: val is coerced to logical for "ngCMatrix" x
#> Warning: x[] <- val: val is coerced to logical for "ngCMatrix" x
#> Warning: x[] <- val: val is coerced to logical for "ngCMatrix" x
#> Warning: x[] <- val: val is coerced to logical for "ngCMatrix" x
#> Warning: x[] <- val: val is coerced to logical for "ngCMatrix" x
#> Warning: x[] <- val: val is coerced to logical for "ngCMatrix" x
#> Warning: x[] <- val: val is coerced to logical for "ngCMatrix" x
#> Warning: x[] <- val: val is coerced to logical for "ngCMatrix" x
#> Warning: x[] <- val: val is coerced to logical for "ngCMatrix" x
#> Warning: x[] <- val: val is coerced to logical for "ngCMatrix" x
#> Warning: x[] <- val: val is coerced to logical for "ngCMatrix" x
#> Warning: x[] <- val: val is coerced to logical for "ngCMatrix" x
#> Warning: x[] <- val: val is coerced to logical for "ngCMatrix" x
#> Warning: x[] <- val: val is coerced to logical for "ngCMatrix" x
#> Warning: x[] <- val: val is coerced to logical for "ngCMatrix" x
#> Warning: x[] <- val: val is coerced to logical for "ngCMatrix" x
#> Warning: x[] <- val: val is coerced to logical for "ngCMatrix" x
#> Warning: x[] <- val: val is coerced to logical for "ngCMatrix" x
#> Warning: x[] <- val: val is coerced to logical for "ngCMatrix" x
#> Warning: x[] <- val: val is coerced to logical for "ngCMatrix" x
#> Warning: x[] <- val: val is coerced to logical for "ngCMatrix" x
#> Warning: x[] <- val: val is coerced to logical for "ngCMatrix" x
#> Warning: x[] <- val: val is coerced to logical for "ngCMatrix" x
#> Warning: x[] <- val: val is coerced to logical for "ngCMatrix" x
#> Warning: x[] <- val: val is coerced to logical for "ngCMatrix" x
#> Warning: x[] <- val: val is coerced to logical for "ngCMatrix" x
#> Warning: x[] <- val: val is coerced to logical for "ngCMatrix" x
#> Warning: x[] <- val: val is coerced to logical for "ngCMatrix" x
#> Warning: x[] <- val: val is coerced to logical for "ngCMatrix" x
#> Warning: x[] <- val: val is coerced to logical for "ngCMatrix" x
#> Warning: x[] <- val: val is coerced to logical for "ngCMatrix" x
#> Warning: x[] <- val: val is coerced to logical for "ngCMatrix" x
#> Warning: x[] <- val: val is coerced to logical for "ngCMatrix" x
#> Warning: x[] <- val: val is coerced to logical for "ngCMatrix" x
#> Warning: x[] <- val: val is coerced to logical for "ngCMatrix" x
#> Warning: x[] <- val: val is coerced to logical for "ngCMatrix" x
#> Warning: x[] <- val: val is coerced to logical for "ngCMatrix" x
#> Warning: x[] <- val: val is coerced to logical for "ngCMatrix" x
#> Warning: x[] <- val: val is coerced to logical for "ngCMatrix" x
#> Warning: x[] <- val: val is coerced to logical for "ngCMatrix" x
#> Warning: x[] <- val: val is coerced to logical for "ngCMatrix" x
#> Warning: x[] <- val: val is coerced to logical for "ngCMatrix" x
#> Warning: x[] <- val: val is coerced to logical for "ngCMatrix" x
#> Warning: x[] <- val: val is coerced to logical for "ngCMatrix" x
#> Warning: x[] <- val: val is coerced to logical for "ngCMatrix" x
#> Warning: x[] <- val: val is coerced to logical for "ngCMatrix" x
#> Warning: x[] <- val: val is coerced to logical for "ngCMatrix" x
#> Warning: x[] <- val: val is coerced to logical for "ngCMatrix" x
#> Warning: x[] <- val: val is coerced to logical for "ngCMatrix" x
#> Warning: x[] <- val: val is coerced to logical for "ngCMatrix" x
#> Warning: x[] <- val: val is coerced to logical for "ngCMatrix" x
#> Warning: x[] <- val: val is coerced to logical for "ngCMatrix" x
#> Warning: x[] <- val: val is coerced to logical for "ngCMatrix" x
#> Warning: x[] <- val: val is coerced to logical for "ngCMatrix" x
#> Warning: x[] <- val: val is coerced to logical for "ngCMatrix" x
#> Warning: x[] <- val: val is coerced to logical for "ngCMatrix" x
#> Warning: x[] <- val: val is coerced to logical for "ngCMatrix" x
#> Warning: x[] <- val: val is coerced to logical for "ngCMatrix" x
#> Warning: x[] <- val: val is coerced to logical for "ngCMatrix" x
#> Warning: x[] <- val: val is coerced to logical for "ngCMatrix" x
#> Warning: x[] <- val: val is coerced to logical for "ngCMatrix" x
#> Warning: x[] <- val: val is coerced to logical for "ngCMatrix" x
#> Warning: x[] <- val: val is coerced to logical for "ngCMatrix" x
#> Warning: x[] <- val: val is coerced to logical for "ngCMatrix" x
#> Warning: x[] <- val: val is coerced to logical for "ngCMatrix" x
#> Warning: x[] <- val: val is coerced to logical for "ngCMatrix" x
#> Warning: x[] <- val: val is coerced to logical for "ngCMatrix" x
#> Warning: x[] <- val: val is coerced to logical for "ngCMatrix" x
#> Warning: x[] <- val: val is coerced to logical for "ngCMatrix" x
#> Warning: x[] <- val: val is coerced to logical for "ngCMatrix" x
#> Warning: x[] <- val: val is coerced to logical for "ngCMatrix" x
#> Warning: x[] <- val: val is coerced to logical for "ngCMatrix" x
#> Warning: x[] <- val: val is coerced to logical for "ngCMatrix" x
#> Warning: x[] <- val: val is coerced to logical for "ngCMatrix" x
#> Warning: x[] <- val: val is coerced to logical for "ngCMatrix" x
#> Warning: x[] <- val: val is coerced to logical for "ngCMatrix" x
#> Warning: x[] <- val: val is coerced to logical for "ngCMatrix" x
#> Warning: x[] <- val: val is coerced to logical for "ngCMatrix" x
#> Warning: x[] <- val: val is coerced to logical for "ngCMatrix" x
#> Warning: x[] <- val: val is coerced to logical for "ngCMatrix" x
#> Warning: x[] <- val: val is coerced to logical for "ngCMatrix" x
#> Warning: x[] <- val: val is coerced to logical for "ngCMatrix" x
#> Warning: x[] <- val: val is coerced to logical for "ngCMatrix" x
#> Warning: x[] <- val: val is coerced to logical for "ngCMatrix" x
#> Warning: x[] <- val: val is coerced to logical for "ngCMatrix" x
#> Warning: x[] <- val: val is coerced to logical for "ngCMatrix" x
#> Warning: x[] <- val: val is coerced to logical for "ngCMatrix" x
#> Warning: x[] <- val: val is coerced to logical for "ngCMatrix" x
#> Warning: x[] <- val: val is coerced to logical for "ngCMatrix" x
#> Warning: x[] <- val: val is coerced to logical for "ngCMatrix" x
#> Warning: x[] <- val: val is coerced to logical for "ngCMatrix" x
#> Warning: x[] <- val: val is coerced to logical for "ngCMatrix" x
#> Warning: x[] <- val: val is coerced to logical for "ngCMatrix" x
#> Warning: x[] <- val: val is coerced to logical for "ngCMatrix" x
#> Warning: x[] <- val: val is coerced to logical for "ngCMatrix" x
#> Warning: x[] <- val: val is coerced to logical for "ngCMatrix" x
#> Warning: x[] <- val: val is coerced to logical for "ngCMatrix" x
#> Warning: x[] <- val: val is coerced to logical for "ngCMatrix" x
#> Warning: x[] <- val: val is coerced to logical for "ngCMatrix" x
#> Warning: x[] <- val: val is coerced to logical for "ngCMatrix" x
#> Warning: x[] <- val: val is coerced to logical for "ngCMatrix" x
#> Warning: x[] <- val: val is coerced to logical for "ngCMatrix" x
#> Warning: x[] <- val: val is coerced to logical for "ngCMatrix" x
#> Warning: x[] <- val: val is coerced to logical for "ngCMatrix" x
#> Warning: x[] <- val: val is coerced to logical for "ngCMatrix" x
#> Warning: x[] <- val: val is coerced to logical for "ngCMatrix" x
#> Warning: x[] <- val: val is coerced to logical for "ngCMatrix" x
#> Warning: x[] <- val: val is coerced to logical for "ngCMatrix" x
#> Warning: x[] <- val: val is coerced to logical for "ngCMatrix" x
#> Warning: x[] <- val: val is coerced to logical for "ngCMatrix" x
#> Warning: x[] <- val: val is coerced to logical for "ngCMatrix" x
#> Warning: x[] <- val: val is coerced to logical for "ngCMatrix" x
#> Warning: x[] <- val: val is coerced to logical for "ngCMatrix" x
#> Warning: x[] <- val: val is coerced to logical for "ngCMatrix" x
#> Warning: x[] <- val: val is coerced to logical for "ngCMatrix" x
#> Warning: x[] <- val: val is coerced to logical for "ngCMatrix" x
#> Warning: x[] <- val: val is coerced to logical for "ngCMatrix" x
#> Warning: x[] <- val: val is coerced to logical for "ngCMatrix" x
#> Warning: x[] <- val: val is coerced to logical for "ngCMatrix" x
#> Warning: x[] <- val: val is coerced to logical for "ngCMatrix" x
#> Warning: x[] <- val: val is coerced to logical for "ngCMatrix" x
#> Warning: x[] <- val: val is coerced to logical for "ngCMatrix" x
#> Warning: x[] <- val: val is coerced to logical for "ngCMatrix" x
#> Warning: x[] <- val: val is coerced to logical for "ngCMatrix" x
#> Warning: x[] <- val: val is coerced to logical for "ngCMatrix" x
#> Warning: x[] <- val: val is coerced to logical for "ngCMatrix" x
#> Warning: x[] <- val: val is coerced to logical for "ngCMatrix" x
#> Warning: x[] <- val: val is coerced to logical for "ngCMatrix" x
#> Warning: x[] <- val: val is coerced to logical for "ngCMatrix" x
#> Warning: x[] <- val: val is coerced to logical for "ngCMatrix" x
#> Warning: x[] <- val: val is coerced to logical for "ngCMatrix" x
#> Warning: x[] <- val: val is coerced to logical for "ngCMatrix" x
#> Warning: x[] <- val: val is coerced to logical for "ngCMatrix" x
#> Warning: x[] <- val: val is coerced to logical for "ngCMatrix" x
#> Warning: x[] <- val: val is coerced to logical for "ngCMatrix" x
#> Warning: x[] <- val: val is coerced to logical for "ngCMatrix" x
#> Warning: x[] <- val: val is coerced to logical for "ngCMatrix" x
#> Warning: x[] <- val: val is coerced to logical for "ngCMatrix" x
#> Warning: x[] <- val: val is coerced to logical for "ngCMatrix" x
#> Warning: x[] <- val: val is coerced to logical for "ngCMatrix" x
#> Warning: x[] <- val: val is coerced to logical for "ngCMatrix" x
#> Warning: x[] <- val: val is coerced to logical for "ngCMatrix" x
#> Warning: x[] <- val: val is coerced to logical for "ngCMatrix" x
#> Warning: x[] <- val: val is coerced to logical for "ngCMatrix" x
#> Warning: x[] <- val: val is coerced to logical for "ngCMatrix" x
#> Warning: x[] <- val: val is coerced to logical for "ngCMatrix" x
#> Warning: x[] <- val: val is coerced to logical for "ngCMatrix" x
#> Warning: x[] <- val: val is coerced to logical for "ngCMatrix" x
#> Warning: x[] <- val: val is coerced to logical for "ngCMatrix" x
#> Warning: x[] <- val: val is coerced to logical for "ngCMatrix" x
#> Warning: x[] <- val: val is coerced to logical for "ngCMatrix" x
#> Warning: x[] <- val: val is coerced to logical for "ngCMatrix" x
#> Warning: x[] <- val: val is coerced to logical for "ngCMatrix" x
#> Warning: x[] <- val: val is coerced to logical for "ngCMatrix" x
#> Warning: x[] <- val: val is coerced to logical for "ngCMatrix" x
#> Warning: x[] <- val: val is coerced to logical for "ngCMatrix" x
#> Warning: x[] <- val: val is coerced to logical for "ngCMatrix" x
#> Warning: x[] <- val: val is coerced to logical for "ngCMatrix" x
#> Warning: x[] <- val: val is coerced to logical for "ngCMatrix" x
#> Warning: x[] <- val: val is coerced to logical for "ngCMatrix" x
#> Warning: x[] <- val: val is coerced to logical for "ngCMatrix" x
#> Warning: x[] <- val: val is coerced to logical for "ngCMatrix" x
#> Warning: x[] <- val: val is coerced to logical for "ngCMatrix" x
#> Warning: x[] <- val: val is coerced to logical for "ngCMatrix" x
#> Warning: x[] <- val: val is coerced to logical for "ngCMatrix" x
#> Warning: x[] <- val: val is coerced to logical for "ngCMatrix" x
#> Warning: x[] <- val: val is coerced to logical for "ngCMatrix" x
#> Warning: x[] <- val: val is coerced to logical for "ngCMatrix" x
#> Warning: x[] <- val: val is coerced to logical for "ngCMatrix" x
#> Warning: x[] <- val: val is coerced to logical for "ngCMatrix" x
#> Warning: x[] <- val: val is coerced to logical for "ngCMatrix" x
#> Warning: x[] <- val: val is coerced to logical for "ngCMatrix" x
#> Warning: x[] <- val: val is coerced to logical for "ngCMatrix" x
#> Warning: x[] <- val: val is coerced to logical for "ngCMatrix" x
#> Warning: x[] <- val: val is coerced to logical for "ngCMatrix" x
#> Warning: x[] <- val: val is coerced to logical for "ngCMatrix" x
#> Warning: x[] <- val: val is coerced to logical for "ngCMatrix" x
#> Warning: x[] <- val: val is coerced to logical for "ngCMatrix" x
#> Warning: x[] <- val: val is coerced to logical for "ngCMatrix" x
#> Warning: x[] <- val: val is coerced to logical for "ngCMatrix" x
#> Warning: x[] <- val: val is coerced to logical for "ngCMatrix" x
#> Warning: x[] <- val: val is coerced to logical for "ngCMatrix" x
#> Warning: x[] <- val: val is coerced to logical for "ngCMatrix" x
#> Warning: x[] <- val: val is coerced to logical for "ngCMatrix" x
#> Warning: x[] <- val: val is coerced to logical for "ngCMatrix" x
#> Warning: x[] <- val: val is coerced to logical for "ngCMatrix" x
#> Warning: x[] <- val: val is coerced to logical for "ngCMatrix" x
#> Warning: x[] <- val: val is coerced to logical for "ngCMatrix" x
#> Warning: x[] <- val: val is coerced to logical for "ngCMatrix" x
#> Warning: x[] <- val: val is coerced to logical for "ngCMatrix" x
#> Warning: x[] <- val: val is coerced to logical for "ngCMatrix" x
#> Warning: x[] <- val: val is coerced to logical for "ngCMatrix" x
#> Warning: x[] <- val: val is coerced to logical for "ngCMatrix" x
#> Warning: x[] <- val: val is coerced to logical for "ngCMatrix" x
#> Warning: x[] <- val: val is coerced to logical for "ngCMatrix" x
#> Warning: x[] <- val: val is coerced to logical for "ngCMatrix" x
#> Warning: x[] <- val: val is coerced to logical for "ngCMatrix" x
#> Warning: x[] <- val: val is coerced to logical for "ngCMatrix" x
#> Warning: x[] <- val: val is coerced to logical for "ngCMatrix" x
#> Warning: x[] <- val: val is coerced to logical for "ngCMatrix" x
#> Warning: x[] <- val: val is coerced to logical for "ngCMatrix" x
#> Warning: x[] <- val: val is coerced to logical for "ngCMatrix" x
#> Warning: x[] <- val: val is coerced to logical for "ngCMatrix" x
#> Warning: x[] <- val: val is coerced to logical for "ngCMatrix" x
#> Warning: x[] <- val: val is coerced to logical for "ngCMatrix" x
#> Warning: x[] <- val: val is coerced to logical for "ngCMatrix" x
#> Warning: x[] <- val: val is coerced to logical for "ngCMatrix" x
#> Warning: x[] <- val: val is coerced to logical for "ngCMatrix" x
#> Warning: x[] <- val: val is coerced to logical for "ngCMatrix" x
#> Warning: x[] <- val: val is coerced to logical for "ngCMatrix" x
#> Warning: x[] <- val: val is coerced to logical for "ngCMatrix" x
#> Warning: x[] <- val: val is coerced to logical for "ngCMatrix" x
#> Warning: x[] <- val: val is coerced to logical for "ngCMatrix" x
#> Warning: x[] <- val: val is coerced to logical for "ngCMatrix" x
#> Warning: x[] <- val: val is coerced to logical for "ngCMatrix" x
#> Warning: x[] <- val: val is coerced to logical for "ngCMatrix" x
#> Warning: x[] <- val: val is coerced to logical for "ngCMatrix" x
#> Warning: x[] <- val: val is coerced to logical for "ngCMatrix" x
#> Warning: x[] <- val: val is coerced to logical for "ngCMatrix" x
#> Warning: x[] <- val: val is coerced to logical for "ngCMatrix" x
#> Warning: x[] <- val: val is coerced to logical for "ngCMatrix" x
#> Warning: x[] <- val: val is coerced to logical for "ngCMatrix" x
#> Warning: x[] <- val: val is coerced to logical for "ngCMatrix" x
#> Warning: x[] <- val: val is coerced to logical for "ngCMatrix" x
#> Warning: x[] <- val: val is coerced to logical for "ngCMatrix" x
#> Warning: x[] <- val: val is coerced to logical for "ngCMatrix" x
#> Warning: x[] <- val: val is coerced to logical for "ngCMatrix" x
#> Warning: x[] <- val: val is coerced to logical for "ngCMatrix" x
#> Warning: x[] <- val: val is coerced to logical for "ngCMatrix" x
#> Warning: x[] <- val: val is coerced to logical for "ngCMatrix" x
#> Warning: x[] <- val: val is coerced to logical for "ngCMatrix" x
#> Warning: x[] <- val: val is coerced to logical for "ngCMatrix" x
#> Warning: x[] <- val: val is coerced to logical for "ngCMatrix" x
#> Warning: x[] <- val: val is coerced to logical for "ngCMatrix" x
#> Warning: x[] <- val: val is coerced to logical for "ngCMatrix" x
#> Warning: x[] <- val: val is coerced to logical for "ngCMatrix" x
#> Warning: x[] <- val: val is coerced to logical for "ngCMatrix" x
#> Warning: x[] <- val: val is coerced to logical for "ngCMatrix" x
#> Warning: x[] <- val: val is coerced to logical for "ngCMatrix" x
#> Warning: x[] <- val: val is coerced to logical for "ngCMatrix" x
#> Warning: x[] <- val: val is coerced to logical for "ngCMatrix" x
#> Warning: x[] <- val: val is coerced to logical for "ngCMatrix" x
#> Warning: x[] <- val: val is coerced to logical for "ngCMatrix" x
#> Warning: x[] <- val: val is coerced to logical for "ngCMatrix" x
#> Warning: x[] <- val: val is coerced to logical for "ngCMatrix" x
#> Warning: x[] <- val: val is coerced to logical for "ngCMatrix" x
#> Warning: x[] <- val: val is coerced to logical for "ngCMatrix" x
#> Warning: x[] <- val: val is coerced to logical for "ngCMatrix" x
#> Warning: x[] <- val: val is coerced to logical for "ngCMatrix" x
#> Warning: x[] <- val: val is coerced to logical for "ngCMatrix" x
#> Warning: x[] <- val: val is coerced to logical for "ngCMatrix" x
#> Warning: x[] <- val: val is coerced to logical for "ngCMatrix" x
#> Warning: x[] <- val: val is coerced to logical for "ngCMatrix" x
#> Warning: x[] <- val: val is coerced to logical for "ngCMatrix" x
#> Warning: x[] <- val: val is coerced to logical for "ngCMatrix" x
#> Warning: x[] <- val: val is coerced to logical for "ngCMatrix" x
#> Warning: x[] <- val: val is coerced to logical for "ngCMatrix" x
#> Warning: x[] <- val: val is coerced to logical for "ngCMatrix" x
#> Warning: x[] <- val: val is coerced to logical for "ngCMatrix" x
#> Warning: x[] <- val: val is coerced to logical for "ngCMatrix" x
#> Warning: x[] <- val: val is coerced to logical for "ngCMatrix" x
#> Warning: x[] <- val: val is coerced to logical for "ngCMatrix" x
#> Warning: x[] <- val: val is coerced to logical for "ngCMatrix" x
#> Warning: x[] <- val: val is coerced to logical for "ngCMatrix" x
#> Warning: x[] <- val: val is coerced to logical for "ngCMatrix" x
#> Warning: x[] <- val: val is coerced to logical for "ngCMatrix" x
#> Warning: x[] <- val: val is coerced to logical for "ngCMatrix" x
#> Warning: x[] <- val: val is coerced to logical for "ngCMatrix" x
#> Warning: x[] <- val: val is coerced to logical for "ngCMatrix" x
#> Warning: x[] <- val: val is coerced to logical for "ngCMatrix" x
#> Warning: x[] <- val: val is coerced to logical for "ngCMatrix" x
#> Warning: x[] <- val: val is coerced to logical for "ngCMatrix" x
#> Warning: x[] <- val: val is coerced to logical for "ngCMatrix" x
#> Warning: x[] <- val: val is coerced to logical for "ngCMatrix" x
#> Warning: x[] <- val: val is coerced to logical for "ngCMatrix" x
#> Warning: x[] <- val: val is coerced to logical for "ngCMatrix" x
#> Warning: x[] <- val: val is coerced to logical for "ngCMatrix" x
#> Warning: x[] <- val: val is coerced to logical for "ngCMatrix" x
#> Warning: x[] <- val: val is coerced to logical for "ngCMatrix" x
#> Warning: x[] <- val: val is coerced to logical for "ngCMatrix" x
#> Warning: x[] <- val: val is coerced to logical for "ngCMatrix" x
#> Warning: x[] <- val: val is coerced to logical for "ngCMatrix" x
#> Warning: x[] <- val: val is coerced to logical for "ngCMatrix" x
#> Warning: x[] <- val: val is coerced to logical for "ngCMatrix" x
#> Warning: x[] <- val: val is coerced to logical for "ngCMatrix" x
#> Warning: x[] <- val: val is coerced to logical for "ngCMatrix" x
#> Warning: x[] <- val: val is coerced to logical for "ngCMatrix" x
#> Warning: x[] <- val: val is coerced to logical for "ngCMatrix" x
#> Warning: x[] <- val: val is coerced to logical for "ngCMatrix" x
#> Warning: x[] <- val: val is coerced to logical for "ngCMatrix" x
#> Warning: x[] <- val: val is coerced to logical for "ngCMatrix" x
#> Warning: x[] <- val: val is coerced to logical for "ngCMatrix" x
#> Warning: x[] <- val: val is coerced to logical for "ngCMatrix" x
#> Warning: x[] <- val: val is coerced to logical for "ngCMatrix" x
#> Warning: x[] <- val: val is coerced to logical for "ngCMatrix" x
#> Warning: x[] <- val: val is coerced to logical for "ngCMatrix" x
#> Warning: x[] <- val: val is coerced to logical for "ngCMatrix" x
#> Warning: x[] <- val: val is coerced to logical for "ngCMatrix" x
#> Warning: x[] <- val: val is coerced to logical for "ngCMatrix" x
#> Warning: x[] <- val: val is coerced to logical for "ngCMatrix" x
#> Warning: x[] <- val: val is coerced to logical for "ngCMatrix" x
#> Warning: x[] <- val: val is coerced to logical for "ngCMatrix" x
#> Warning: x[] <- val: val is coerced to logical for "ngCMatrix" x
#> Warning: x[] <- val: val is coerced to logical for "ngCMatrix" x
#> Warning: x[] <- val: val is coerced to logical for "ngCMatrix" x
#> Warning: x[] <- val: val is coerced to logical for "ngCMatrix" x
#> Warning: x[] <- val: val is coerced to logical for "ngCMatrix" x
#> Warning: x[] <- val: val is coerced to logical for "ngCMatrix" x
#> Warning: x[] <- val: val is coerced to logical for "ngCMatrix" x
#> Warning: x[] <- val: val is coerced to logical for "ngCMatrix" x
#> Warning: x[] <- val: val is coerced to logical for "ngCMatrix" x
#> Warning: x[] <- val: val is coerced to logical for "ngCMatrix" x
#> Warning: x[] <- val: val is coerced to logical for "ngCMatrix" x
#> Warning: x[] <- val: val is coerced to logical for "ngCMatrix" x
#> Warning: x[] <- val: val is coerced to logical for "ngCMatrix" x
#> Warning: x[] <- val: val is coerced to logical for "ngCMatrix" x
#> Warning: x[] <- val: val is coerced to logical for "ngCMatrix" x
#> Warning: x[] <- val: val is coerced to logical for "ngCMatrix" x
#> Warning: x[] <- val: val is coerced to logical for "ngCMatrix" x
#> Warning: x[] <- val: val is coerced to logical for "ngCMatrix" x
#> Warning: x[] <- val: val is coerced to logical for "ngCMatrix" x
#> Warning: x[] <- val: val is coerced to logical for "ngCMatrix" x
#> Warning: x[] <- val: val is coerced to logical for "ngCMatrix" x
#> Warning: x[] <- val: val is coerced to logical for "ngCMatrix" x
#> Warning: x[] <- val: val is coerced to logical for "ngCMatrix" x
#> Warning: x[] <- val: val is coerced to logical for "ngCMatrix" x
#> Warning: x[] <- val: val is coerced to logical for "ngCMatrix" x
#> Warning: x[] <- val: val is coerced to logical for "ngCMatrix" x
#> Warning: x[] <- val: val is coerced to logical for "ngCMatrix" x
#> Warning: x[] <- val: val is coerced to logical for "ngCMatrix" x
#> Warning: x[] <- val: val is coerced to logical for "ngCMatrix" x
#> Warning: x[] <- val: val is coerced to logical for "ngCMatrix" x
#> Warning: x[] <- val: val is coerced to logical for "ngCMatrix" x
#> Warning: x[] <- val: val is coerced to logical for "ngCMatrix" x
#> Warning: x[] <- val: val is coerced to logical for "ngCMatrix" x
#> Warning: x[] <- val: val is coerced to logical for "ngCMatrix" x
#> Warning: x[] <- val: val is coerced to logical for "ngCMatrix" x
#> Warning: x[] <- val: val is coerced to logical for "ngCMatrix" x
#> Warning: x[] <- val: val is coerced to logical for "ngCMatrix" x
#> Warning: x[] <- val: val is coerced to logical for "ngCMatrix" x
#> Warning: x[] <- val: val is coerced to logical for "ngCMatrix" x
#> Warning: x[] <- val: val is coerced to logical for "ngCMatrix" x
#> Warning: x[] <- val: val is coerced to logical for "ngCMatrix" x
#> Warning: x[] <- val: val is coerced to logical for "ngCMatrix" x
#> Warning: x[] <- val: val is coerced to logical for "ngCMatrix" x
#> Warning: x[] <- val: val is coerced to logical for "ngCMatrix" x
#> Warning: x[] <- val: val is coerced to logical for "ngCMatrix" x
#> Warning: x[] <- val: val is coerced to logical for "ngCMatrix" x
#> Warning: x[] <- val: val is coerced to logical for "ngCMatrix" x
#> Warning: x[] <- val: val is coerced to logical for "ngCMatrix" x
#> Warning: x[] <- val: val is coerced to logical for "ngCMatrix" x
#> Warning: x[] <- val: val is coerced to logical for "ngCMatrix" x
#> Warning: x[] <- val: val is coerced to logical for "ngCMatrix" x
#> Warning: x[] <- val: val is coerced to logical for "ngCMatrix" x
#> Warning: x[] <- val: val is coerced to logical for "ngCMatrix" x
#> Warning: x[] <- val: val is coerced to logical for "ngCMatrix" x
#> Warning: x[] <- val: val is coerced to logical for "ngCMatrix" x
#> Warning: x[] <- val: val is coerced to logical for "ngCMatrix" x
#> Warning: x[] <- val: val is coerced to logical for "ngCMatrix" x
#> Warning: x[] <- val: val is coerced to logical for "ngCMatrix" x
#> Warning: x[] <- val: val is coerced to logical for "ngCMatrix" x
#> Warning: x[] <- val: val is coerced to logical for "ngCMatrix" x
#> Warning: x[] <- val: val is coerced to logical for "ngCMatrix" x
#> Warning: x[] <- val: val is coerced to logical for "ngCMatrix" x
#> Warning: x[] <- val: val is coerced to logical for "ngCMatrix" x
#> Warning: x[] <- val: val is coerced to logical for "ngCMatrix" x
#> Warning: x[] <- val: val is coerced to logical for "ngCMatrix" x
#> Warning: x[] <- val: val is coerced to logical for "ngCMatrix" x
#> Warning: x[] <- val: val is coerced to logical for "ngCMatrix" x
#> Warning: x[] <- val: val is coerced to logical for "ngCMatrix" x
#> Warning: x[] <- val: val is coerced to logical for "ngCMatrix" x
#> Warning: x[] <- val: val is coerced to logical for "ngCMatrix" x
#> Warning: x[] <- val: val is coerced to logical for "ngCMatrix" x
#> Warning: x[] <- val: val is coerced to logical for "ngCMatrix" x
#> Warning: x[] <- val: val is coerced to logical for "ngCMatrix" x
#> Warning: x[] <- val: val is coerced to logical for "ngCMatrix" x
#> Warning: x[] <- val: val is coerced to logical for "ngCMatrix" x
#> Warning: x[] <- val: val is coerced to logical for "ngCMatrix" x
#> Warning: x[] <- val: val is coerced to logical for "ngCMatrix" x
#> Warning: x[] <- val: val is coerced to logical for "ngCMatrix" x
#> Warning: x[] <- val: val is coerced to logical for "ngCMatrix" x
#> Warning: x[] <- val: val is coerced to logical for "ngCMatrix" x
#> Warning: x[] <- val: val is coerced to logical for "ngCMatrix" x
#> Warning: x[] <- val: val is coerced to logical for "ngCMatrix" x
#> Warning: x[] <- val: val is coerced to logical for "ngCMatrix" x
#> Warning: x[] <- val: val is coerced to logical for "ngCMatrix" x
#> Warning: x[] <- val: val is coerced to logical for "ngCMatrix" x
#> Warning: x[] <- val: val is coerced to logical for "ngCMatrix" x
#> Warning: x[] <- val: val is coerced to logical for "ngCMatrix" x
#> Warning: x[] <- val: val is coerced to logical for "ngCMatrix" x
#> Warning: x[] <- val: val is coerced to logical for "ngCMatrix" x
#> Warning: x[] <- val: val is coerced to logical for "ngCMatrix" x
#> Warning: x[] <- val: val is coerced to logical for "ngCMatrix" x
#> Warning: x[] <- val: val is coerced to logical for "ngCMatrix" x
#> Warning: x[] <- val: val is coerced to logical for "ngCMatrix" x
#> Warning: x[] <- val: val is coerced to logical for "ngCMatrix" x
#> Warning: x[] <- val: val is coerced to logical for "ngCMatrix" x
#> Warning: x[] <- val: val is coerced to logical for "ngCMatrix" x
#> Warning: x[] <- val: val is coerced to logical for "ngCMatrix" x
#> Warning: x[] <- val: val is coerced to logical for "ngCMatrix" x
#> Warning: x[] <- val: val is coerced to logical for "ngCMatrix" x
#> Warning: x[] <- val: val is coerced to logical for "ngCMatrix" x
#> Warning: x[] <- val: val is coerced to logical for "ngCMatrix" x
#> Warning: x[] <- val: val is coerced to logical for "ngCMatrix" x
#> Warning: x[] <- val: val is coerced to logical for "ngCMatrix" x
#> Warning: x[] <- val: val is coerced to logical for "ngCMatrix" x
#> Warning: x[] <- val: val is coerced to logical for "ngCMatrix" x
#> Warning: x[] <- val: val is coerced to logical for "ngCMatrix" x
#> Warning: x[] <- val: val is coerced to logical for "ngCMatrix" x
#> Warning: x[] <- val: val is coerced to logical for "ngCMatrix" x
#> Warning: x[] <- val: val is coerced to logical for "ngCMatrix" x
#> Warning: x[] <- val: val is coerced to logical for "ngCMatrix" x
#> Warning: x[] <- val: val is coerced to logical for "ngCMatrix" x
#> Warning: x[] <- val: val is coerced to logical for "ngCMatrix" x
#> Warning: x[] <- val: val is coerced to logical for "ngCMatrix" x
#> Warning: x[] <- val: val is coerced to logical for "ngCMatrix" x
#> Warning: x[] <- val: val is coerced to logical for "ngCMatrix" x
#> Warning: x[] <- val: val is coerced to logical for "ngCMatrix" x
#> Warning: x[] <- val: val is coerced to logical for "ngCMatrix" x
#> Warning: x[] <- val: val is coerced to logical for "ngCMatrix" x
#> Warning: x[] <- val: val is coerced to logical for "ngCMatrix" x
#> Warning: x[] <- val: val is coerced to logical for "ngCMatrix" x
#> Warning: x[] <- val: val is coerced to logical for "ngCMatrix" x
#> Warning: x[] <- val: val is coerced to logical for "ngCMatrix" x
#> Warning: x[] <- val: val is coerced to logical for "ngCMatrix" x
#> Warning: x[] <- val: val is coerced to logical for "ngCMatrix" x
#> Warning: x[] <- val: val is coerced to logical for "ngCMatrix" x
#> Warning: x[] <- val: val is coerced to logical for "ngCMatrix" x
#> Warning: x[] <- val: val is coerced to logical for "ngCMatrix" x
#> Warning: x[] <- val: val is coerced to logical for "ngCMatrix" x
#> Warning: x[] <- val: val is coerced to logical for "ngCMatrix" x
#> Warning: x[] <- val: val is coerced to logical for "ngCMatrix" x
#> Warning: x[] <- val: val is coerced to logical for "ngCMatrix" x
#> Warning: x[] <- val: val is coerced to logical for "ngCMatrix" x
#> Warning: x[] <- val: val is coerced to logical for "ngCMatrix" x
#> Warning: x[] <- val: val is coerced to logical for "ngCMatrix" x
#> Warning: x[] <- val: val is coerced to logical for "ngCMatrix" x
#> Warning: x[] <- val: val is coerced to logical for "ngCMatrix" x
#> Warning: x[] <- val: val is coerced to logical for "ngCMatrix" x
#> Warning: x[] <- val: val is coerced to logical for "ngCMatrix" x
#> Warning: x[] <- val: val is coerced to logical for "ngCMatrix" x
#> Warning: x[] <- val: val is coerced to logical for "ngCMatrix" x
#> Warning: x[] <- val: val is coerced to logical for "ngCMatrix" x
#> Warning: x[] <- val: val is coerced to logical for "ngCMatrix" x
#> Warning: x[] <- val: val is coerced to logical for "ngCMatrix" x
#> Warning: x[] <- val: val is coerced to logical for "ngCMatrix" x
#> Warning: x[] <- val: val is coerced to logical for "ngCMatrix" x
#> Warning: x[] <- val: val is coerced to logical for "ngCMatrix" x
#> Warning: x[] <- val: val is coerced to logical for "ngCMatrix" x
#> Warning: x[] <- val: val is coerced to logical for "ngCMatrix" x
#> Warning: x[] <- val: val is coerced to logical for "ngCMatrix" x
#> Warning: x[] <- val: val is coerced to logical for "ngCMatrix" x
#> Warning: x[] <- val: val is coerced to logical for "ngCMatrix" x
#> Warning: x[] <- val: val is coerced to logical for "ngCMatrix" x
#> Warning: x[] <- val: val is coerced to logical for "ngCMatrix" x
#> Warning: x[] <- val: val is coerced to logical for "ngCMatrix" x
#> Warning: x[] <- val: val is coerced to logical for "ngCMatrix" x
#> Warning: x[] <- val: val is coerced to logical for "ngCMatrix" x
#> Warning: x[] <- val: val is coerced to logical for "ngCMatrix" x
#> Warning: x[] <- val: val is coerced to logical for "ngCMatrix" x
#> Warning: x[] <- val: val is coerced to logical for "ngCMatrix" x
#> Warning: x[] <- val: val is coerced to logical for "ngCMatrix" x
#> Warning: x[] <- val: val is coerced to logical for "ngCMatrix" x
#> Warning: x[] <- val: val is coerced to logical for "ngCMatrix" x
#> Warning: x[] <- val: val is coerced to logical for "ngCMatrix" x
#> Warning: x[] <- val: val is coerced to logical for "ngCMatrix" x
#> Warning: x[] <- val: val is coerced to logical for "ngCMatrix" x
#> Warning: x[] <- val: val is coerced to logical for "ngCMatrix" x
#> Warning: x[] <- val: val is coerced to logical for "ngCMatrix" x
#> Warning: x[] <- val: val is coerced to logical for "ngCMatrix" x
#> Warning: x[] <- val: val is coerced to logical for "ngCMatrix" x
#> Warning: x[] <- val: val is coerced to logical for "ngCMatrix" x
#> Warning: x[] <- val: val is coerced to logical for "ngCMatrix" x
#> Warning: x[] <- val: val is coerced to logical for "ngCMatrix" x
#> Warning: x[] <- val: val is coerced to logical for "ngCMatrix" x
#> Warning: x[] <- val: val is coerced to logical for "ngCMatrix" x
#> Warning: x[] <- val: val is coerced to logical for "ngCMatrix" x
#> Warning: x[] <- val: val is coerced to logical for "ngCMatrix" x
#> Warning: x[] <- val: val is coerced to logical for "ngCMatrix" x
#> Warning: x[] <- val: val is coerced to logical for "ngCMatrix" x
#> Warning: x[] <- val: val is coerced to logical for "ngCMatrix" x
#> Warning: x[] <- val: val is coerced to logical for "ngCMatrix" x
#> Warning: x[] <- val: val is coerced to logical for "ngCMatrix" x
#> Warning: x[] <- val: val is coerced to logical for "ngCMatrix" x
#> Warning: x[] <- val: val is coerced to logical for "ngCMatrix" x
#> Warning: x[] <- val: val is coerced to logical for "ngCMatrix" x
#> Warning: x[] <- val: val is coerced to logical for "ngCMatrix" x
#> Warning: x[] <- val: val is coerced to logical for "ngCMatrix" x
#> Warning: x[] <- val: val is coerced to logical for "ngCMatrix" x
#> Warning: x[] <- val: val is coerced to logical for "ngCMatrix" x
#> Warning: x[] <- val: val is coerced to logical for "ngCMatrix" x
#> Warning: x[] <- val: val is coerced to logical for "ngCMatrix" x
#> Warning: x[] <- val: val is coerced to logical for "ngCMatrix" x
#> Warning: x[] <- val: val is coerced to logical for "ngCMatrix" x
#> Warning: x[] <- val: val is coerced to logical for "ngCMatrix" x
#> Warning: x[] <- val: val is coerced to logical for "ngCMatrix" x
#> Warning: x[] <- val: val is coerced to logical for "ngCMatrix" x
#> Warning: x[] <- val: val is coerced to logical for "ngCMatrix" x
#> Warning: x[] <- val: val is coerced to logical for "ngCMatrix" x
#> Warning: x[] <- val: val is coerced to logical for "ngCMatrix" x
#> Warning: x[] <- val: val is coerced to logical for "ngCMatrix" x
#> Warning: x[] <- val: val is coerced to logical for "ngCMatrix" x
#> Warning: x[] <- val: val is coerced to logical for "ngCMatrix" x
#> Warning: x[] <- val: val is coerced to logical for "ngCMatrix" x
#> Warning: x[] <- val: val is coerced to logical for "ngCMatrix" x
#> Warning: x[] <- val: val is coerced to logical for "ngCMatrix" x
#> Warning: x[] <- val: val is coerced to logical for "ngCMatrix" x
#> Warning: x[] <- val: val is coerced to logical for "ngCMatrix" x
#> Warning: x[] <- val: val is coerced to logical for "ngCMatrix" x
#> Warning: x[] <- val: val is coerced to logical for "ngCMatrix" x
#> Warning: x[] <- val: val is coerced to logical for "ngCMatrix" x
#> Warning: x[] <- val: val is coerced to logical for "ngCMatrix" x
#> Warning: x[] <- val: val is coerced to logical for "ngCMatrix" x
#> Warning: x[] <- val: val is coerced to logical for "ngCMatrix" x
#> Warning: x[] <- val: val is coerced to logical for "ngCMatrix" x
#> Warning: x[] <- val: val is coerced to logical for "ngCMatrix" x
#> Warning: x[] <- val: val is coerced to logical for "ngCMatrix" x
#> Warning: x[] <- val: val is coerced to logical for "ngCMatrix" x
#> Warning: x[] <- val: val is coerced to logical for "ngCMatrix" x
#> Warning: x[] <- val: val is coerced to logical for "ngCMatrix" x
#> Warning: x[] <- val: val is coerced to logical for "ngCMatrix" x
#> Warning: x[] <- val: val is coerced to logical for "ngCMatrix" x
#> Warning: x[] <- val: val is coerced to logical for "ngCMatrix" x
#> Warning: x[] <- val: val is coerced to logical for "ngCMatrix" x
#> Warning: x[] <- val: val is coerced to logical for "ngCMatrix" x
#> Warning: x[] <- val: val is coerced to logical for "ngCMatrix" x
#> Warning: x[] <- val: val is coerced to logical for "ngCMatrix" x
#> Warning: x[] <- val: val is coerced to logical for "ngCMatrix" x
#> Warning: x[] <- val: val is coerced to logical for "ngCMatrix" x
#> Warning: x[] <- val: val is coerced to logical for "ngCMatrix" x
#> Warning: x[] <- val: val is coerced to logical for "ngCMatrix" x
#> Warning: x[] <- val: val is coerced to logical for "ngCMatrix" x
#> Warning: x[] <- val: val is coerced to logical for "ngCMatrix" x
#> Warning: x[] <- val: val is coerced to logical for "ngCMatrix" x
#> Warning: x[] <- val: val is coerced to logical for "ngCMatrix" x
#> Warning: x[] <- val: val is coerced to logical for "ngCMatrix" x
#> Warning: x[] <- val: val is coerced to logical for "ngCMatrix" x
#> Warning: x[] <- val: val is coerced to logical for "ngCMatrix" x
#> Warning: x[] <- val: val is coerced to logical for "ngCMatrix" x
#> Warning: x[] <- val: val is coerced to logical for "ngCMatrix" x
#> Warning: x[] <- val: val is coerced to logical for "ngCMatrix" x
#> Warning: x[] <- val: val is coerced to logical for "ngCMatrix" x
#> Warning: x[] <- val: val is coerced to logical for "ngCMatrix" x
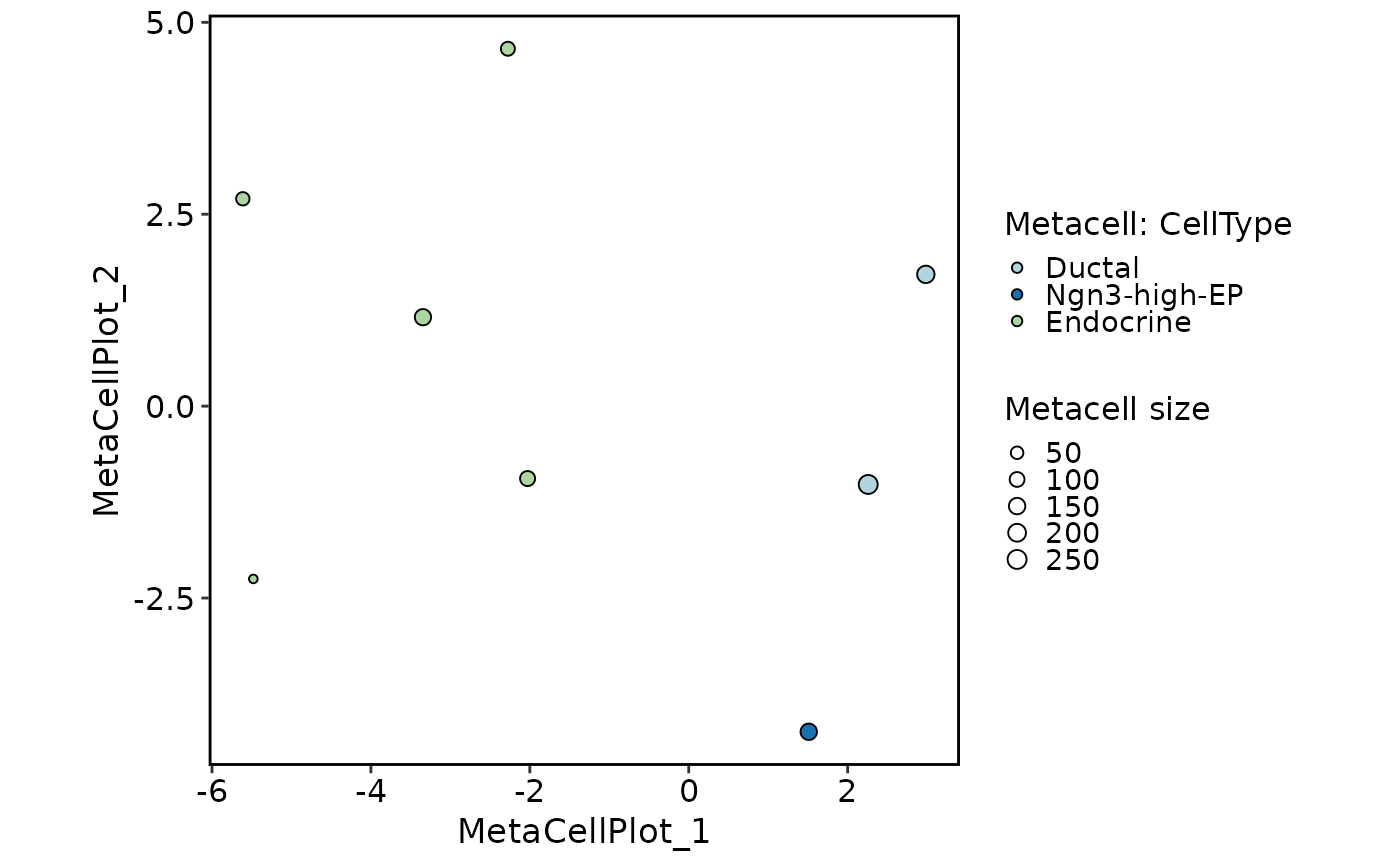
#> ℹ [2026-07-02 09:46:09] `RunMetaCell()` ("metacell") built 8 metacells from 1000 cells
#> ℹ [2026-07-02 09:46:09] Metacell size summary: min 17, median 126, mean 125, max 251 cells
#> Warning: Data is of class ngCMatrix. Coercing to dgCMatrix.
#> ✔ [2026-07-02 09:46:09] `RunMetaCell()` returned metacell Seurat with 8 metacells. Original cells in `@misc[["original_srt"]]`
MetaCellPlot(mc2, group.by = "CellType")