The Group Heatmap
Usage
GroupHeatmap(
  srt,
  features = NULL,
  group.by = NULL,
  split.by = NULL,
  within_groups = FALSE,
  grouping.var = NULL,
  numerator = NULL,
  cells = NULL,
  aggregate_fun = base::mean,
  exp_cutoff = 0,
  border = TRUE,
  heatmap_border = NULL,
  cell_annotation_border = NULL,
  feature_annotation_border = NULL,
  heatmap_border_palcolor = "black",
  cell_annotation_border_palcolor = "black",
  feature_annotation_border_palcolor = "black",
  heatmap_border_size = 1,
  cell_annotation_border_size = 1,
  feature_annotation_border_size = 1,
  flip = FALSE,
  layer = "counts",
  assay = NULL,
  exp_method = c("zscore", "raw", "fc", "log2fc", "log1p"),
  exp_legend_title = NULL,
  limits = NULL,
  lib_normalize = identical(layer, "counts"),
  libsize = NULL,
  feature_split = NULL,
  feature_split_by = NULL,
  n_split = NULL,
  split_order = NULL,
  split_method = c("kmeans", "hclust", "mfuzz"),
  decreasing = FALSE,
  fuzzification = NULL,
  cluster_features_by = NULL,
  cluster_rows = FALSE,
  cluster_columns = FALSE,
  cluster_row_slices = FALSE,
  cluster_column_slices = FALSE,
  show_row_names = FALSE,
  row_names_wrap = NULL,
  show_column_names = FALSE,
  row_names_side = ifelse(flip, "left", "right"),
  column_names_side = ifelse(flip, "bottom", "top"),
  row_names_rot = 0,
  column_names_rot = 90,
  row_title = NULL,
  column_title = NULL,
  row_title_side = "left",
  column_title_side = "top",
  row_title_rot = 0,
  column_title_rot = ifelse(flip, 90, 0),
  anno_terms = FALSE,
  anno_keys = FALSE,
  anno_features = FALSE,
  terms_width = grid::unit(4, "in"),
  terms_fontsize = 8,
  terms_stat = "none",
  terms_stat_digits = 2,
  terms_stat_test = TRUE,
  keys_width = grid::unit(2, "in"),
  keys_fontsize = c(6, 10),
  features_width = grid::unit(2, "in"),
  features_fontsize = c(6, 10),
  IDtype = "symbol",
  species = "Homo_sapiens",
  db_update = FALSE,
  db_version = "latest",
  db_combine = FALSE,
  convert_species = TRUE,
  Ensembl_version = NULL,
  mirror = NULL,
  db = "GO_BP",
  TERM2GENE = NULL,
  TERM2NAME = NULL,
  minGSSize = 10,
  maxGSSize = 500,
  GO_simplify = FALSE,
  GO_simplify_cutoff = "p.adjust < 0.05",
  simplify_method = "Wang",
  simplify_similarityCutoff = 0.7,
  pvalueCutoff = NULL,
  padjustCutoff = 0.05,
  topTerm = 5,
  show_termid = FALSE,
  topWord = 20,
  words_excluded = NULL,
  nlabel = 20,
  features_label = NULL,
  label_size = 10,
  label_color = "black",
  add_bg = FALSE,
  bg_alpha = 0.5,
  add_dot = FALSE,
  dot_size = grid::unit(8, "mm"),
  add_reticle = FALSE,
  reticle_color = "grey",
  add_violin = FALSE,
  fill.by = "feature",
  fill_palette = "Dark2",
  fill_palcolor = NULL,
  heatmap_palette = "RdBu",
  heatmap_palcolor = NULL,
  group_palette = "Chinese",
  group_palcolor = NULL,
  cell_split_palette = "simspec",
  cell_split_palcolor = NULL,
  feature_split_palette = "simspec",
  feature_split_palcolor = NULL,
  cell_annotation = NULL,
  cell_annotation_palette = "Chinese",
  cell_annotation_palcolor = NULL,
  cell_annotation_params = if (flip) {
     list(width = grid::unit(10, "mm"))
 } else {

        list(height = grid::unit(10, "mm"))
 },
  feature_annotation = NULL,
  feature_annotation_palette = "Dark2",
  feature_annotation_palcolor = NULL,
  feature_annotation_params = if (flip) {
     list(height = grid::unit(5, "mm"))
 } else
    {
     list(width = grid::unit(5, "mm"))
 },
  use_raster = NULL,
  raster_device = "png",
  raster_by_magick = FALSE,
  height = NULL,
  width = NULL,
  units = "inch",
  cores = 1,
  seed = 11,
  legend.position = "right",
  ht_params = list(),
  verbose = TRUE,
  ...
)
Arguments
- srt
A Seurat object.
- features
A character vector of features to use. Default is
NULL.- group.by
Name of one or more meta.data columns to group (color) cells by.
- split.by
Name of a column in meta.data column to split plot by. Default is
NULL.- within_groups
Whether to create separate heatmap scales for each group or within each group. Default is
FALSE.- grouping.var
A character vector that specifies another variable for grouping, such as certain conditions. Default is
NULL.- numerator
A character vector specifying the value to use as the numerator in the grouping.var grouping. Default is
NULL.- cells
A character vector of cell names to use. Default is
NULL.- aggregate_fun
A function to use for aggregating data within groups. Default is base::mean.
- exp_cutoff
The threshold for cell counting if
add_dotisTRUE. Default is0.- border
Whether to add borders to the heatmap body and annotations. Kept for backward compatibility. The more specific
heatmap_border,cell_annotation_border, andfeature_annotation_borderarguments inherit from this value when left asNULL.- heatmap_border, cell_annotation_border, feature_annotation_border
Whether to draw borders for the heatmap body, cell annotations, and feature annotations, respectively. Defaults inherit from
border.- heatmap_border_palcolor, cell_annotation_border_palcolor, feature_annotation_border_palcolor
Border colors for the heatmap body, cell annotations, and feature annotations when their matching border argument is
TRUE. Default is"black".- heatmap_border_size, cell_annotation_border_size, feature_annotation_border_size
Border line widths for the heatmap body, cell annotations, and feature annotations when their matching border argument is
TRUE. Default is1.- flip
Whether to flip the heatmap. Default is
FALSE.- layer
Which layer to use. Default is
"counts".- assay
Which assay to use. If
NULL, the default assay of the Seurat object will be used. When the object also containsChromatinAssay, the default assay and additionalChromatinAssaywill be preprocessed sequentially.- exp_method
A character vector specifying the method for calculating expression values. Options are
"zscore","raw","fc","log2fc", or"log1p". Default is"zscore".- exp_legend_title
A character vector specifying the title for the legend of expression value. Default is
NULL.- limits
A two-length numeric vector specifying the limits for the color scale. Default is
NULL.- lib_normalize
Whether to normalize the data by library size.
- libsize
A numeric vector specifying the library size for each cell. Default is
NULL.- feature_split
A factor specifying how to split the features. Default is
NULL.- feature_split_by
A character vector specifying which group.by to use when splitting features (into n_split feature clusters). Default is
NULL.- n_split
A number of feature splits (feature clusters) to create. Default is
NULL.- split_order
A numeric vector specifying the order of splits. Default is
NULL.- split_method
A character vector specifying the method for splitting features. Options are
"kmeans","hclust", or"mfuzz". Default is"kmeans".- decreasing
Whether to sort feature splits in decreasing order. Default is
FALSE.- fuzzification
The fuzzification coefficient. Default is
NULL.- cluster_features_by
A character vector specifying which group.by to use when clustering features. Default is
NULL. By default, this parameter is set to NULL, which means that all groups will be used.- cluster_rows
Whether to cluster rows in the heatmap. Default is
FALSE.- cluster_columns
Whether to cluster columns in the heatmap. Default is
FALSE.- cluster_row_slices
Whether to cluster row slices in the heatmap. Default is
FALSE.- cluster_column_slices
Whether to cluster column slices in the heatmap. Default is
FALSE.- show_row_names
Whether to show row names in the heatmap. Default is
FALSE.- row_names_wrap
Maximum number of characters per displayed row-name line. When set to a positive number, underscores are displayed as spaces and labels are wrapped without changing the underlying feature identifiers. This also applies to feature labels selected by
nlabelorfeatures_label.NULLdisables wrapping.- show_column_names
Whether to show column names in the heatmap. Default is
FALSE.- row_names_side
A character vector specifying the side to place row names.
- column_names_side
A character vector specifying the side to place column names.
- row_names_rot
The rotation angle for row names. Default is
0.- column_names_rot
The rotation angle for column names. Default is
90.- row_title
A character vector specifying the title for rows. Default is
NULL.- column_title
A character vector specifying the title for columns. Default is
NULL.- row_title_side
A character vector specifying the side to place row title. Default is
"left".- column_title_side
A character vector specifying the side to place column title. Default is
"top".- row_title_rot
The rotation angle for row title. Default is
0.- column_title_rot
The rotation angle for column title.
- anno_terms
Whether to include term annotations. Default is
FALSE.- anno_keys
Whether to include key annotations. Default is
FALSE.- anno_features
Whether to include feature annotations. Default is
FALSE.- terms_width
A unit specifying the width of term annotations. Default is
unit(4, "in").- terms_fontsize
A numeric vector specifying the font size(s) for term annotations. Default is
8.- terms_stat
Which enrichment statistic to show after each term. Use
"none"to hide the bar background,"score"for-log10of the active p-value metric, or any column from the enrichment result such as"p.adjust","pvalue","qvalue","GeneRatio","RichFactor","FoldEnrichment","zScore", or"Count".- terms_stat_digits
Number of significant digits for numeric term statistics.
- terms_stat_test
Logical. Whether to show the numeric term statistic value at the right side of each term when
terms_statis enabled.- keys_width
A unit specifying the width of key annotations. Default is
unit(2, "in").- keys_fontsize
A two-length numeric vector specifying the minimum and maximum font size(s) for key annotations. Default is
c(6, 10).- features_width
A unit specifying the width of feature annotations. Default is
unit(2, "in").- features_fontsize
A two-length numeric vector specifying the minimum and maximum font size(s) for feature annotations. Default is
c(6, 10).- IDtype
A character vector specifying the type of IDs for features. Default is
"symbol".- species
A character vector specifying the species for features. Default is
"Homo_sapiens".- db_update
Whether the gene annotation databases should be forcefully updated. If set to FALSE, the function will attempt to load the cached databases instead. Default is
FALSE.- db_version
A character vector specifying the version of the gene annotation databases to be retrieved. Default is
"latest".- db_combine
Whether to use a combined database. Default is
FALSE.- convert_species
Whether to use a species-converted database when the annotation is missing for the specified species. Default is
TRUE.- Ensembl_version
An integer specifying the Ensembl version. Default is
NULL. IfNULL, the latest version will be used.- mirror
A character vector specifying the mirror for the Ensembl database. Default is
NULL.- db
A character vector specifying the database to use. Default is
"GO_BP".- TERM2GENE
A data.frame specifying the TERM2GENE mapping for the database. Default is
NULL.- TERM2NAME
A data.frame specifying the TERM2NAME mapping for the database. Default is
NULL.- minGSSize
An integer specifying the minimum gene set size for the database. Default is
10.- maxGSSize
An integer specifying the maximum gene set size for the database. Default is
500.- GO_simplify
Whether to simplify gene ontology terms. Default is
FALSE.- GO_simplify_cutoff
A character vector specifying the cutoff for GO simplification. Default is
"p.adjust < 0.05".- simplify_method
A character vector specifying the method for GO simplification. Default is
"Wang".- simplify_similarityCutoff
The similarity cutoff for GO simplification. Default is
0.7.- pvalueCutoff
A numeric vector specifying the p-value cutoff(s) for significance. Default is
NULL.- padjustCutoff
The adjusted p-value cutoff for significance. Default is
0.05.- topTerm
A number of top terms to include. Default is
5.- show_termid
Whether to show term IDs. Default is
FALSE.- topWord
A number of top words to include. Default is
20.- words_excluded
A character vector specifying the words to exclude. Default is
NULL.- nlabel
A number of labels to include. Default is
20.- features_label
A character vector specifying the features to label. Default is
NULL.- label_size
The size of labels. Default is
10.- label_color
A character vector specifying the color of labels. Default is
"black".- add_bg
Whether to add a background to the heatmap. Default is
FALSE.- bg_alpha
The alpha value for the background color. Default is
0.5.- add_dot
Whether to add dots to the heatmap. The size of dot represents percentage of expressed cells based on the specified
exp_cutoff. Default isFALSE.- dot_size
A unit specifying the base size of the dots. Default is
unit(8, "mm").- add_reticle
Whether to add reticles to the heatmap. Default is
FALSE.- reticle_color
A character vector specifying the color of the reticles. Default is
"grey".- add_violin
Whether to add violins to the heatmap. Default is
FALSE.- fill.by
A character vector specifying what to fill the violin. Possible values are
"group","feature", or"expression". Default is"feature".- fill_palette
A character vector specifying the palette to use for fill. Default is
"Dark2".- fill_palcolor
A character vector specifying the fill color to use. Default is
NULL.- heatmap_palette
A character vector specifying the palette to use for the heatmap. Default is
"RdBu".- heatmap_palcolor
A character vector specifying the heatmap color to use. Default is
NULL.- group_palette
A character vector specifying the palette to use for groups. Default is
"Chinese".- group_palcolor
A character vector specifying the group color to use. Default is
NULL.- cell_split_palette
A character vector specifying the palette to use for cell splits. Default is
"simspec".- cell_split_palcolor
A character vector specifying the cell split color to use. Default is
NULL.- feature_split_palette
A character vector specifying the palette to use for feature splits. Default is
"simspec".- feature_split_palcolor
A character vector specifying the feature split color to use. Default is
NULL.- cell_annotation
A character vector specifying the cell annotation(s) to include. Default is
NULL.- cell_annotation_palette
A character vector specifying the palette to use for cell annotations. The length of the vector should match the number of cell_annotation. Default is
"Chinese".- cell_annotation_palcolor
A list of character vector specifying the cell annotation color(s) to use. The length of the list should match the number of cell_annotation. Default is
NULL.- cell_annotation_params
A list specifying additional parameters for cell annotations. Default is a list with
width = unit(1, "cm")if flip is TRUE, else a list withheight = unit(1, "cm").- feature_annotation
A character vector specifying the feature annotation(s) to include. Default is
NULL.- feature_annotation_palette
A character vector specifying the palette to use for feature annotations. The length of the vector should match the number of feature_annotation. Default is
"Dark2".- feature_annotation_palcolor
A list of character vector specifying the feature annotation color to use. The length of the list should match the number of feature_annotation. Default is
NULL.- feature_annotation_params
A list specifying additional parameters for feature annotations. Default is
list().- use_raster
Whether to use a raster device for plotting. Default is
NULL.- raster_device
A character vector specifying the raster device to use. Default is
"png".- raster_by_magick
Whether to use the 'magick' package for raster. Default is
FALSE.- height
The height of the heatmap in the specified units. If not provided, the height will be automatically determined based on the number of rows in the heatmap and the default unit.
- width
The width of the heatmap in the specified units. If not provided, the width will be automatically determined based on the number of columns in the heatmap and the default unit.
- units
The units to use for the width and height of the heatmap. Default is
"inch", Options are"mm","cm", or"inch".- cores
The number of cores to use for parallelization with foreach::foreach. Default is
1.- seed
Random seed for reproducibility. Default is
11.- legend.position
A character vector specifying the side to place the legends. Options are
"right","left","top", or"bottom". Default is"right". When row names are long and shown on the right side, the gap between the heatmap and the legend is automatically increased to avoid overlap.- ht_params
Additional parameters to customize the appearance of the heatmap. This should be a list with named elements, where the names correspond to parameter names in the ComplexHeatmap::Heatmap function. Any conflicting parameters will override the defaults set by this function. Default is
list().- verbose
Whether to print the message. Default is
TRUE.- ...
Additional arguments passed to the other functions.
Value
A list with the following elements:
plot: The heatmap plot.matrix_list: A list of matrix for eachgroup.byused in the heatmap.feature_split: NULL or a factor if splitting is performed in the heatmap.cell_metadata: Meta data of cells used to generate the heatmap.feature_metadata: Meta data of features used to generate the heatmap.enrichment: NULL or a enrichment result generated by RunEnrichment when any of the parametersanno_terms,anno_keys, oranno_featuresis set toTRUE.
Examples
data(pancreas_sub)
pancreas_sub <- standard_scop(pancreas_sub)
#> ℹ [2026-07-28 03:31:08] Start standard processing workflow...
#> ℹ [2026-07-28 03:31:08] Checking a list of <Seurat>...
#> ! [2026-07-28 03:31:08] Data 1/1 of the `srt_list` is "unknown"
#> ℹ [2026-07-28 03:31:08] Perform `NormalizeData()` with `normalization.method = 'LogNormalize'` on 1/1 of `srt_list`...
#> ℹ [2026-07-28 03:31:08] Perform `FindVariableFeatures()` on 1/1 of `srt_list`...
#> ℹ [2026-07-28 03:31:09] Use the separate HVF from `srt_list`
#> ℹ [2026-07-28 03:31:09] Number of available HVF: 2000
#> ℹ [2026-07-28 03:31:09] Finished check
#> ℹ [2026-07-28 03:31:09] Perform `ScaleData()`
#> ℹ [2026-07-28 03:31:09] Perform pca linear dimension reduction
#> ℹ [2026-07-28 03:31:09] Use stored estimated dimensions 1:23 for Standardpca
#> ℹ [2026-07-28 03:31:10] Perform `Seurat::FindClusters()` with `cluster_algorithm = 'louvain'` and `cluster_resolution = 0.6`
#> ℹ [2026-07-28 03:31:10] Reorder clusters...
#> ℹ [2026-07-28 03:31:10] Skip `log1p()` because `layer = data` is not "counts"
#> ℹ [2026-07-28 03:31:10] Perform umap nonlinear dimension reduction
#> ✔ [2026-07-28 03:31:15] Standard processing workflow completed
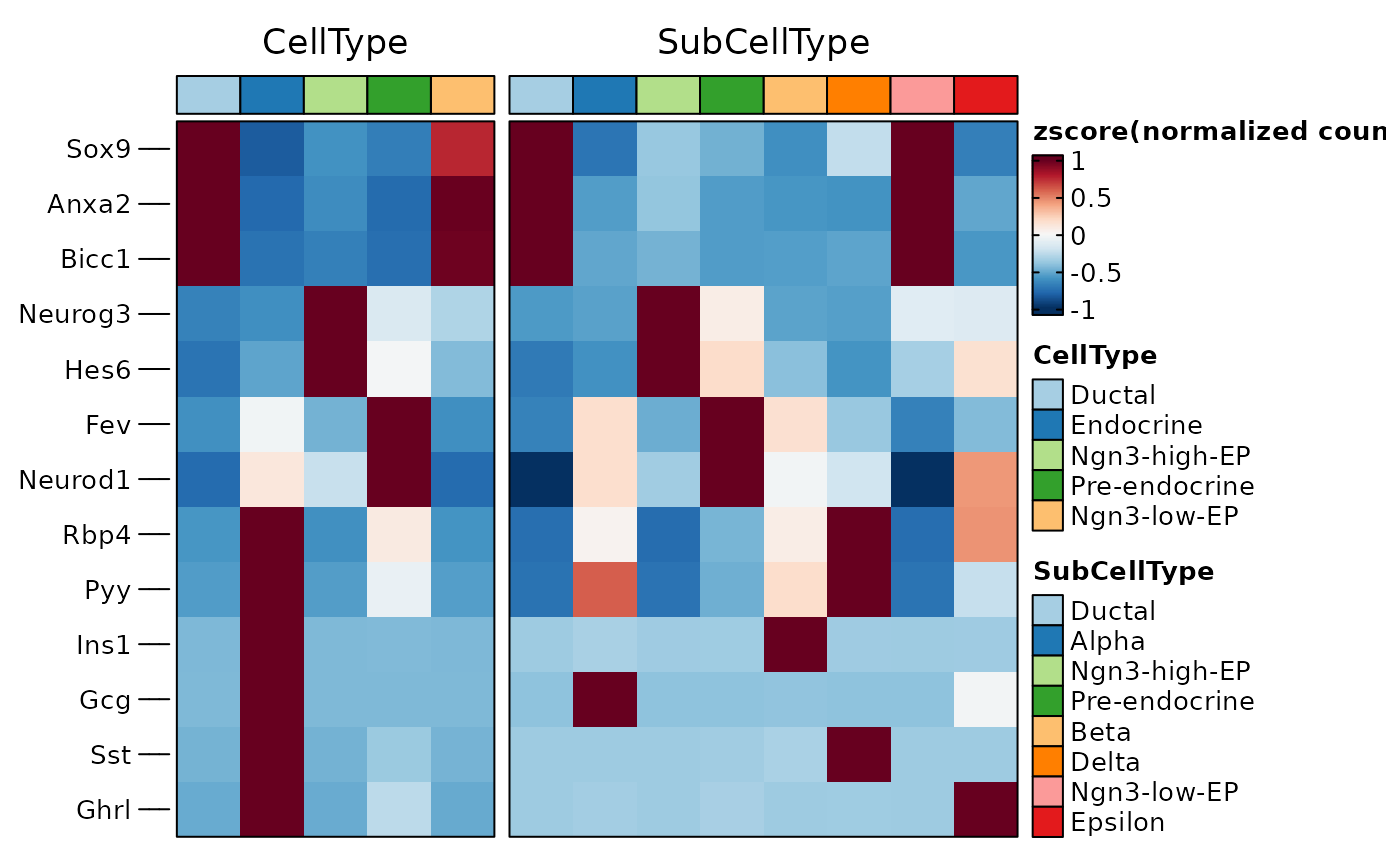
ht1 <- GroupHeatmap(
pancreas_sub,
features = c(
"Sox9", "Anxa2", "Bicc1", # Ductal
"Neurog3", "Hes6", # EPs
"Fev", "Neurod1", # Pre-endocrine
"Rbp4", "Pyy", # Endocrine
"Ins1", "Gcg", "Sst", "Ghrl"
# Beta, Alpha, Delta, Epsilon
),
group.by = c("CellType", "SubCellType")
)
ht1$plot
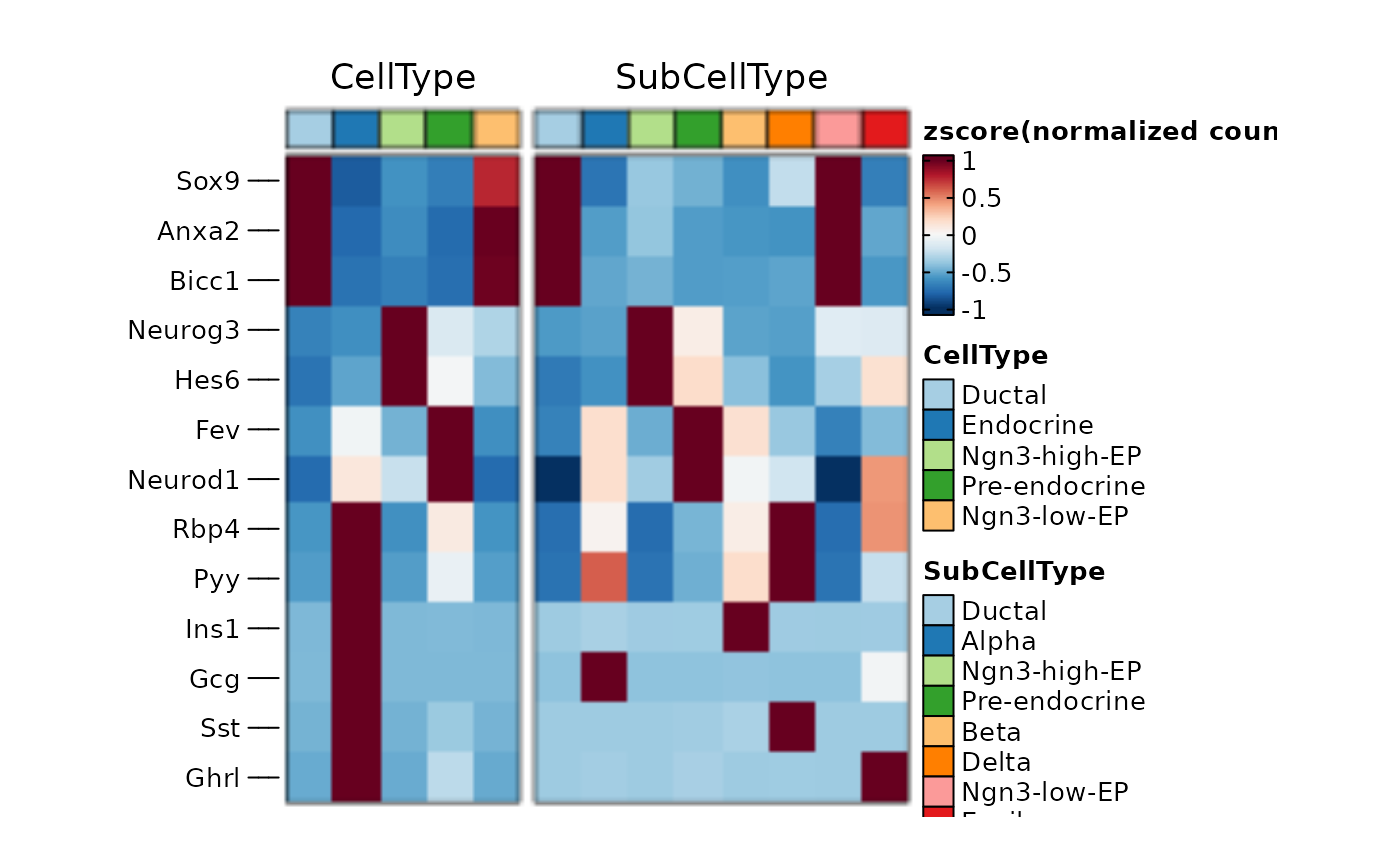
 thisplot::panel_fix(
ht1$plot,
height = 4,
width = 6,
raster = TRUE,
dpi = 50
)
thisplot::panel_fix(
ht1$plot,
height = 4,
width = 6,
raster = TRUE,
dpi = 50
)
 pancreas_sub <- AnnotateFeatures(
pancreas_sub,
species = "Mus_musculus",
db = c("CSPA", "TF")
)
#> ℹ [2026-07-28 03:31:16] Species: "Mus_musculus"
#> ℹ [2026-07-28 03:31:16] Loading cached: CSPA version: CSPA nterm:1 created: 2026-07-28 03:30:25
#> ℹ [2026-07-28 03:31:16] Loading cached: TF version: AnimalTFDB4 nterm:2 created: 2026-07-28 03:30:24
pancreas_sub <- RunDEtest(
pancreas_sub,
group.by = "CellType"
)
#> ℹ [2026-07-28 03:31:18] Data type is log-normalized
#> ℹ [2026-07-28 03:31:18] Start differential expression test
#> ℹ [2026-07-28 03:31:18] Find all markers(wilcox) among [1] 5 groups...
#> ℹ [2026-07-28 03:31:18] Using 1 core
#> ⠙ [2026-07-28 03:31:18] Running for Ductal [1/5] ■■ 20% | ETA: 2s
#> ⠹ [2026-07-28 03:31:18] Running for Endocrine [3/5] ■■■■■■ 60% | ETA: 1s
#> ✔ [2026-07-28 03:31:18] Completed 5 tasks in 2.6s
#>
#> ℹ [2026-07-28 03:31:18] Building results
#> ✔ [2026-07-28 03:31:21] Differential expression test completed
de_filter <- dplyr::filter(
pancreas_sub@tools$DEtest_CellType$AllMarkers_wilcox,
p_val_adj < 0.05 & avg_log2FC > 1
)
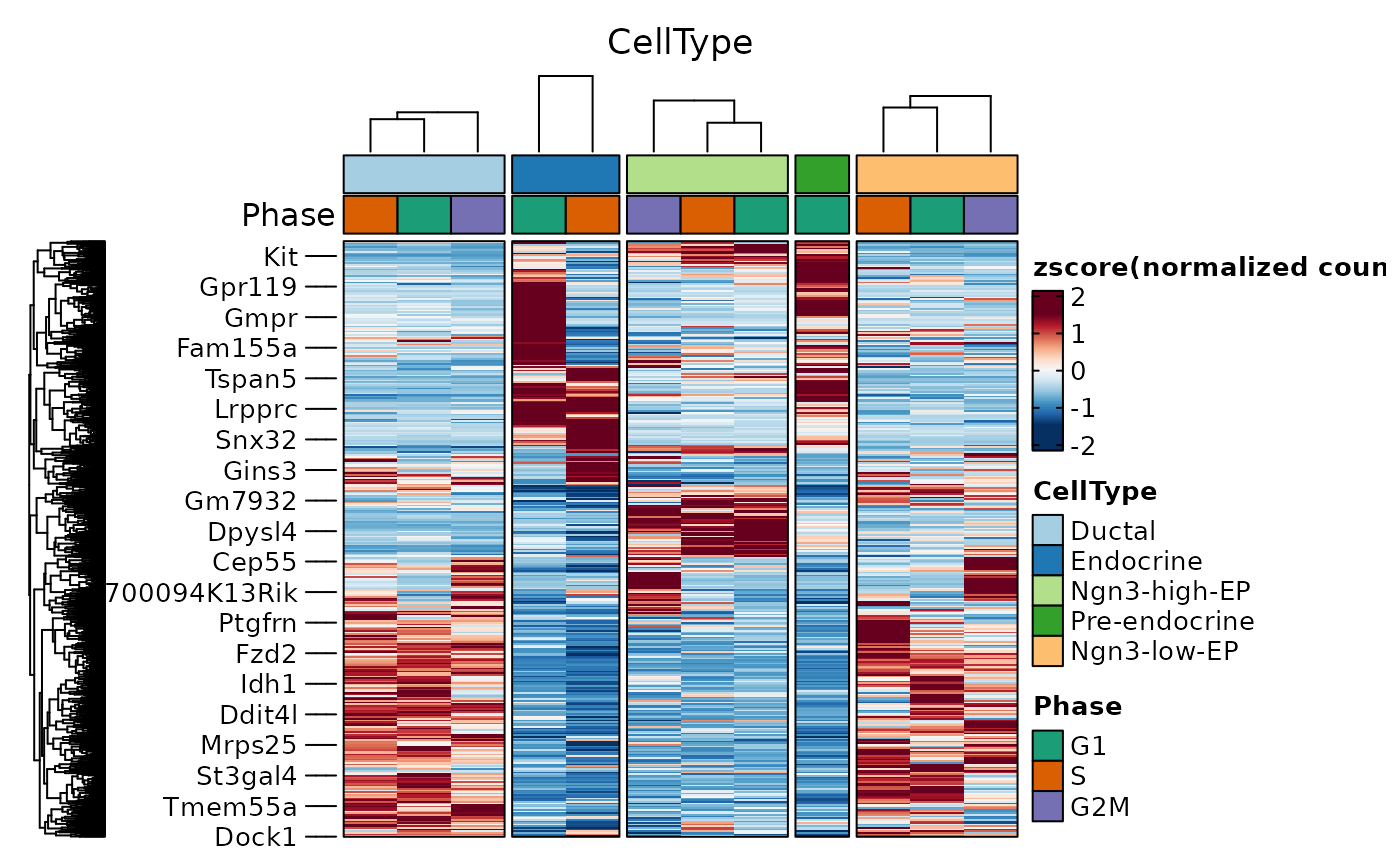
ht2 <- GroupHeatmap(
pancreas_sub,
features = de_filter$gene,
group.by = "CellType",
split.by = "Phase",
cell_split_palette = "Dark2",
cluster_rows = TRUE,
cluster_columns = TRUE
)
#> `use_raster` is automatically set to TRUE for a matrix with more than
#> 2000 rows. You can control `use_raster` argument by explicitly setting
#> TRUE/FALSE to it.
#>
#> Set `ht_opt$message = FALSE` to turn off this message.
ht2$plot
pancreas_sub <- AnnotateFeatures(
pancreas_sub,
species = "Mus_musculus",
db = c("CSPA", "TF")
)
#> ℹ [2026-07-28 03:31:16] Species: "Mus_musculus"
#> ℹ [2026-07-28 03:31:16] Loading cached: CSPA version: CSPA nterm:1 created: 2026-07-28 03:30:25
#> ℹ [2026-07-28 03:31:16] Loading cached: TF version: AnimalTFDB4 nterm:2 created: 2026-07-28 03:30:24
pancreas_sub <- RunDEtest(
pancreas_sub,
group.by = "CellType"
)
#> ℹ [2026-07-28 03:31:18] Data type is log-normalized
#> ℹ [2026-07-28 03:31:18] Start differential expression test
#> ℹ [2026-07-28 03:31:18] Find all markers(wilcox) among [1] 5 groups...
#> ℹ [2026-07-28 03:31:18] Using 1 core
#> ⠙ [2026-07-28 03:31:18] Running for Ductal [1/5] ■■ 20% | ETA: 2s
#> ⠹ [2026-07-28 03:31:18] Running for Endocrine [3/5] ■■■■■■ 60% | ETA: 1s
#> ✔ [2026-07-28 03:31:18] Completed 5 tasks in 2.6s
#>
#> ℹ [2026-07-28 03:31:18] Building results
#> ✔ [2026-07-28 03:31:21] Differential expression test completed
de_filter <- dplyr::filter(
pancreas_sub@tools$DEtest_CellType$AllMarkers_wilcox,
p_val_adj < 0.05 & avg_log2FC > 1
)
ht2 <- GroupHeatmap(
pancreas_sub,
features = de_filter$gene,
group.by = "CellType",
split.by = "Phase",
cell_split_palette = "Dark2",
cluster_rows = TRUE,
cluster_columns = TRUE
)
#> `use_raster` is automatically set to TRUE for a matrix with more than
#> 2000 rows. You can control `use_raster` argument by explicitly setting
#> TRUE/FALSE to it.
#>
#> Set `ht_opt$message = FALSE` to turn off this message.
ht2$plot
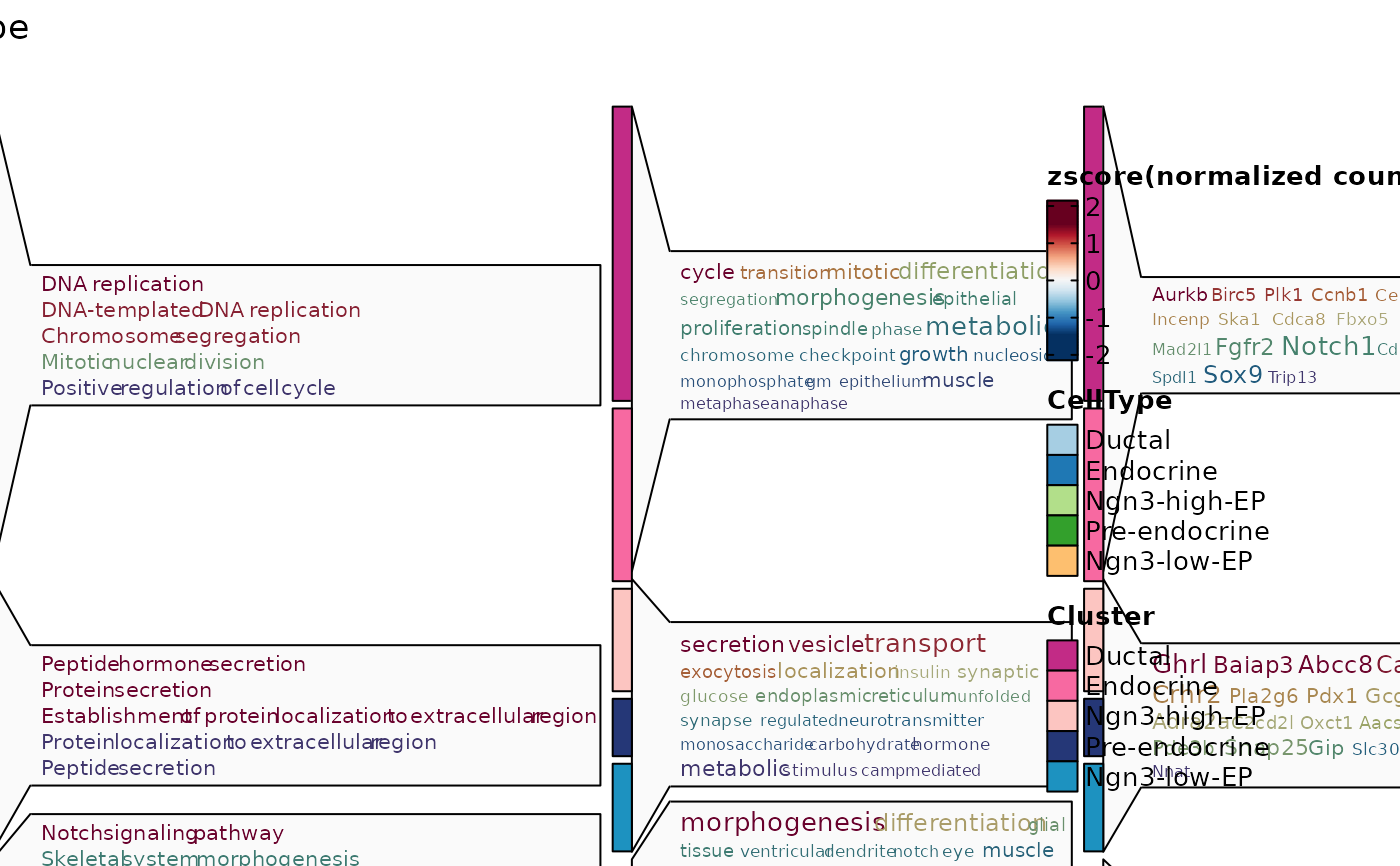
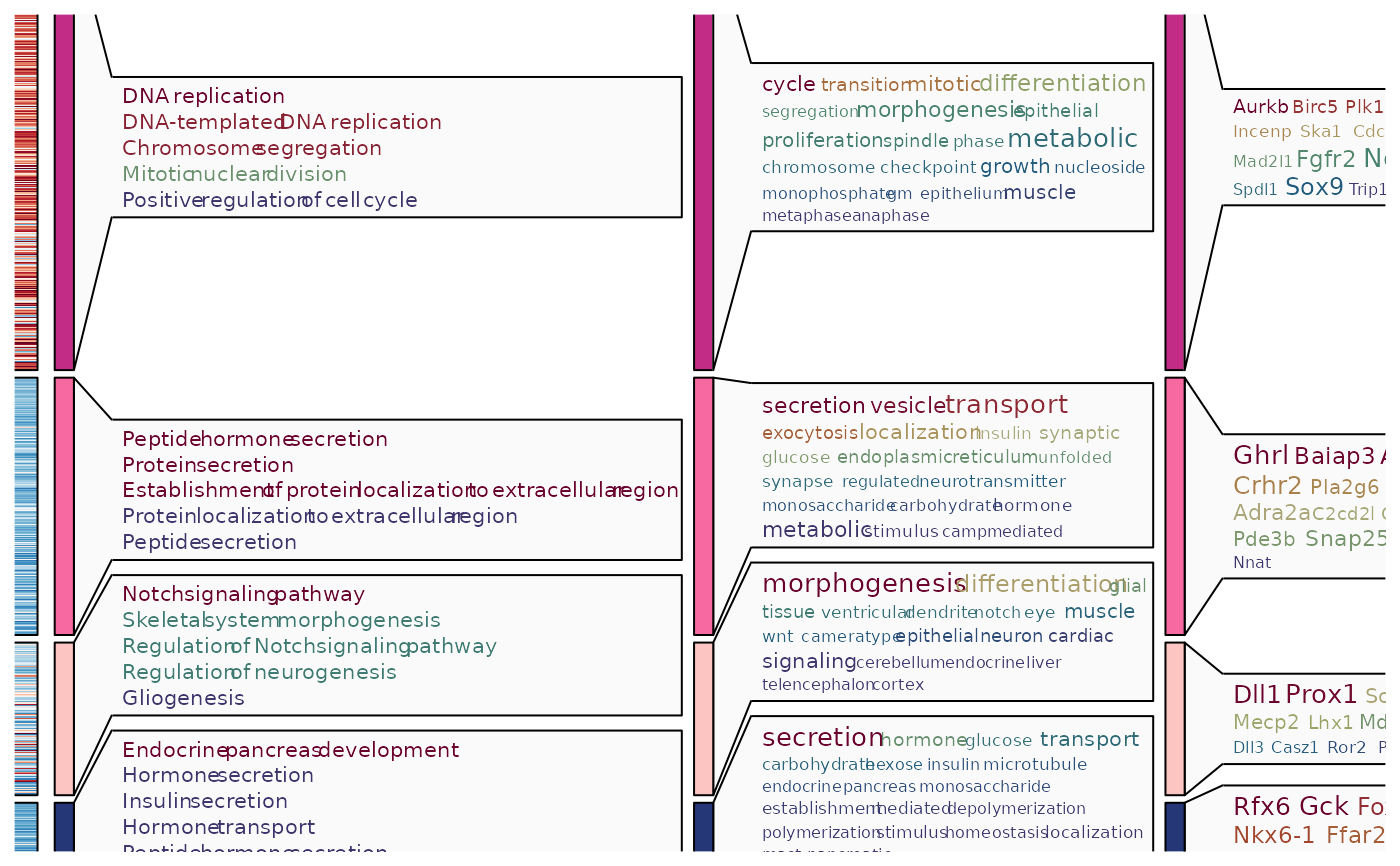
 ht3 <- GroupHeatmap(
pancreas_sub,
features = de_filter$gene,
feature_split = de_filter$group1,
group.by = "CellType",
species = "Mus_musculus",
db = "GO_BP",
anno_terms = TRUE,
anno_keys = TRUE,
anno_features = TRUE
)
#> ℹ [2026-07-28 03:31:29] Start Enrichment analysis
#> ℹ [2026-07-28 03:31:29] Species: "Mus_musculus"
#> ℹ [2026-07-28 03:31:29] Loading cached: GO_BP version: 3.23.0 nterm:14957 created: 2026-07-28 03:29:14
#> ℹ [2026-07-28 03:31:30] Permform enrichment...
#> ℹ [2026-07-28 03:31:31] Using 1 core
#> ⠙ [2026-07-28 03:31:31] Running for 1 [1/5] ■■ 20% | ETA: 7s
#> ⠹ [2026-07-28 03:31:31] Running for 2 [2/5] ■■■■ 40% | ETA: 5s
#> ⠸ [2026-07-28 03:31:31] Running for 4 [4/5] ■■■■■■■■ 80% | ETA: 2s
#> ✔ [2026-07-28 03:31:31] Completed 5 tasks in 8.9s
#>
#> ℹ [2026-07-28 03:31:31] Building results
#> ✔ [2026-07-28 03:31:40] Enrichment analysis done
#> ℹ [2026-07-28 03:32:21] The size of the heatmap is fixed because certain elements are not scalable.
#> ℹ [2026-07-28 03:32:21] The width and height of the heatmap are determined by the size of the current viewport.
#> ℹ [2026-07-28 03:32:21] If you want to have more control over the size, you can manually set the parameters 'width' and 'height'.
ht3$plot
ht3 <- GroupHeatmap(
pancreas_sub,
features = de_filter$gene,
feature_split = de_filter$group1,
group.by = "CellType",
species = "Mus_musculus",
db = "GO_BP",
anno_terms = TRUE,
anno_keys = TRUE,
anno_features = TRUE
)
#> ℹ [2026-07-28 03:31:29] Start Enrichment analysis
#> ℹ [2026-07-28 03:31:29] Species: "Mus_musculus"
#> ℹ [2026-07-28 03:31:29] Loading cached: GO_BP version: 3.23.0 nterm:14957 created: 2026-07-28 03:29:14
#> ℹ [2026-07-28 03:31:30] Permform enrichment...
#> ℹ [2026-07-28 03:31:31] Using 1 core
#> ⠙ [2026-07-28 03:31:31] Running for 1 [1/5] ■■ 20% | ETA: 7s
#> ⠹ [2026-07-28 03:31:31] Running for 2 [2/5] ■■■■ 40% | ETA: 5s
#> ⠸ [2026-07-28 03:31:31] Running for 4 [4/5] ■■■■■■■■ 80% | ETA: 2s
#> ✔ [2026-07-28 03:31:31] Completed 5 tasks in 8.9s
#>
#> ℹ [2026-07-28 03:31:31] Building results
#> ✔ [2026-07-28 03:31:40] Enrichment analysis done
#> ℹ [2026-07-28 03:32:21] The size of the heatmap is fixed because certain elements are not scalable.
#> ℹ [2026-07-28 03:32:21] The width and height of the heatmap are determined by the size of the current viewport.
#> ℹ [2026-07-28 03:32:21] If you want to have more control over the size, you can manually set the parameters 'width' and 'height'.
ht3$plot
 de_top <- de_filter |>
dplyr::group_by(gene) |>
dplyr::top_n(1, avg_log2FC) |>
dplyr::group_by(group1) |>
dplyr::top_n(3, avg_log2FC)
ht4 <- GroupHeatmap(
pancreas_sub,
features = de_top$gene,
feature_split = de_top$group1,
group.by = "CellType",
heatmap_palette = "YlOrRd",
cell_annotation = c(
"Phase", "G2M_score", "Neurod2"
),
cell_annotation_palette = c(
"Dark2", "Chinese", "Chinese"
),
cell_annotation_params = list(
height = grid::unit(10, "mm")
),
feature_annotation = c("TF", "CSPA"),
feature_annotation_palcolor = list(
c("gold", "steelblue"),
c("forestgreen")
),
add_dot = TRUE,
add_bg = TRUE,
nlabel = 0,
show_row_names = TRUE
)
#> Warning: No shared levels found between `names(values)` of the manual scale and the
#> data's colour values.
#> Warning: No shared levels found between `names(values)` of the manual scale and the
#> data's colour values.
#> Warning: No shared levels found between `names(values)` of the manual scale and the
#> data's colour values.
#> Warning: No shared levels found between `names(values)` of the manual scale and the
#> data's colour values.
#> Warning: No shared levels found between `names(values)` of the manual scale and the
#> data's colour values.
#> Warning: No shared levels found between `names(values)` of the manual scale and the
#> data's colour values.
#> Warning: No shared levels found between `names(values)` of the manual scale and the
#> data's colour values.
#> Warning: No shared levels found between `names(values)` of the manual scale and the
#> data's colour values.
#> Warning: No shared levels found between `names(values)` of the manual scale and the
#> data's colour values.
#> Warning: No shared levels found between `names(values)` of the manual scale and the
#> data's colour values.
ht4$plot
de_top <- de_filter |>
dplyr::group_by(gene) |>
dplyr::top_n(1, avg_log2FC) |>
dplyr::group_by(group1) |>
dplyr::top_n(3, avg_log2FC)
ht4 <- GroupHeatmap(
pancreas_sub,
features = de_top$gene,
feature_split = de_top$group1,
group.by = "CellType",
heatmap_palette = "YlOrRd",
cell_annotation = c(
"Phase", "G2M_score", "Neurod2"
),
cell_annotation_palette = c(
"Dark2", "Chinese", "Chinese"
),
cell_annotation_params = list(
height = grid::unit(10, "mm")
),
feature_annotation = c("TF", "CSPA"),
feature_annotation_palcolor = list(
c("gold", "steelblue"),
c("forestgreen")
),
add_dot = TRUE,
add_bg = TRUE,
nlabel = 0,
show_row_names = TRUE
)
#> Warning: No shared levels found between `names(values)` of the manual scale and the
#> data's colour values.
#> Warning: No shared levels found between `names(values)` of the manual scale and the
#> data's colour values.
#> Warning: No shared levels found between `names(values)` of the manual scale and the
#> data's colour values.
#> Warning: No shared levels found between `names(values)` of the manual scale and the
#> data's colour values.
#> Warning: No shared levels found between `names(values)` of the manual scale and the
#> data's colour values.
#> Warning: No shared levels found between `names(values)` of the manual scale and the
#> data's colour values.
#> Warning: No shared levels found between `names(values)` of the manual scale and the
#> data's colour values.
#> Warning: No shared levels found between `names(values)` of the manual scale and the
#> data's colour values.
#> Warning: No shared levels found between `names(values)` of the manual scale and the
#> data's colour values.
#> Warning: No shared levels found between `names(values)` of the manual scale and the
#> data's colour values.
ht4$plot
 ht5 <- GroupHeatmap(
pancreas_sub,
features = de_top$gene,
feature_split = de_top$group1,
group.by = "CellType",
heatmap_palette = "YlOrRd",
cell_annotation = c(
"Phase", "G2M_score", "Neurod2"
),
cell_annotation_palette = c(
"Dark2", "Chinese", "Chinese"
),
cell_annotation_params = list(
width = grid::unit(10, "mm")
),
feature_annotation = c("TF", "CSPA"),
feature_annotation_palcolor = list(
c("gold", "steelblue"), c("forestgreen")
),
add_dot = TRUE,
add_bg = TRUE,
flip = TRUE,
column_title_rot = 45,
nlabel = 0,
show_row_names = TRUE
)
#> Warning: No shared levels found between `names(values)` of the manual scale and the
#> data's colour values.
#> Warning: No shared levels found between `names(values)` of the manual scale and the
#> data's colour values.
#> Warning: No shared levels found between `names(values)` of the manual scale and the
#> data's colour values.
#> Warning: No shared levels found between `names(values)` of the manual scale and the
#> data's colour values.
#> Warning: No shared levels found between `names(values)` of the manual scale and the
#> data's colour values.
#> Warning: No shared levels found between `names(values)` of the manual scale and the
#> data's colour values.
#> Warning: No shared levels found between `names(values)` of the manual scale and the
#> data's colour values.
#> Warning: No shared levels found between `names(values)` of the manual scale and the
#> data's colour values.
#> Warning: No shared levels found between `names(values)` of the manual scale and the
#> data's colour values.
#> Warning: No shared levels found between `names(values)` of the manual scale and the
#> data's colour values.
ht5$plot
ht5 <- GroupHeatmap(
pancreas_sub,
features = de_top$gene,
feature_split = de_top$group1,
group.by = "CellType",
heatmap_palette = "YlOrRd",
cell_annotation = c(
"Phase", "G2M_score", "Neurod2"
),
cell_annotation_palette = c(
"Dark2", "Chinese", "Chinese"
),
cell_annotation_params = list(
width = grid::unit(10, "mm")
),
feature_annotation = c("TF", "CSPA"),
feature_annotation_palcolor = list(
c("gold", "steelblue"), c("forestgreen")
),
add_dot = TRUE,
add_bg = TRUE,
flip = TRUE,
column_title_rot = 45,
nlabel = 0,
show_row_names = TRUE
)
#> Warning: No shared levels found between `names(values)` of the manual scale and the
#> data's colour values.
#> Warning: No shared levels found between `names(values)` of the manual scale and the
#> data's colour values.
#> Warning: No shared levels found between `names(values)` of the manual scale and the
#> data's colour values.
#> Warning: No shared levels found between `names(values)` of the manual scale and the
#> data's colour values.
#> Warning: No shared levels found between `names(values)` of the manual scale and the
#> data's colour values.
#> Warning: No shared levels found between `names(values)` of the manual scale and the
#> data's colour values.
#> Warning: No shared levels found between `names(values)` of the manual scale and the
#> data's colour values.
#> Warning: No shared levels found between `names(values)` of the manual scale and the
#> data's colour values.
#> Warning: No shared levels found between `names(values)` of the manual scale and the
#> data's colour values.
#> Warning: No shared levels found between `names(values)` of the manual scale and the
#> data's colour values.
ht5$plot
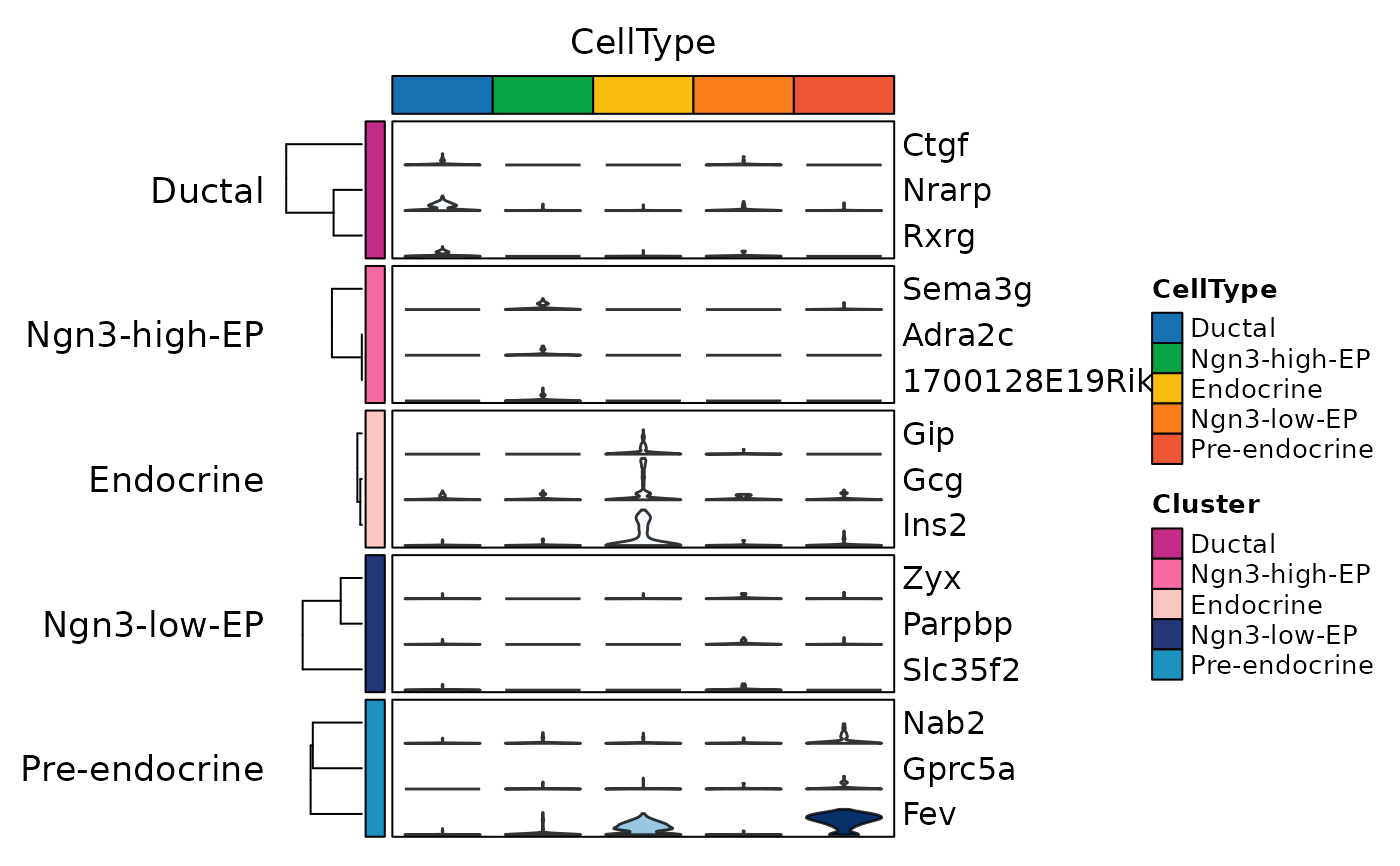
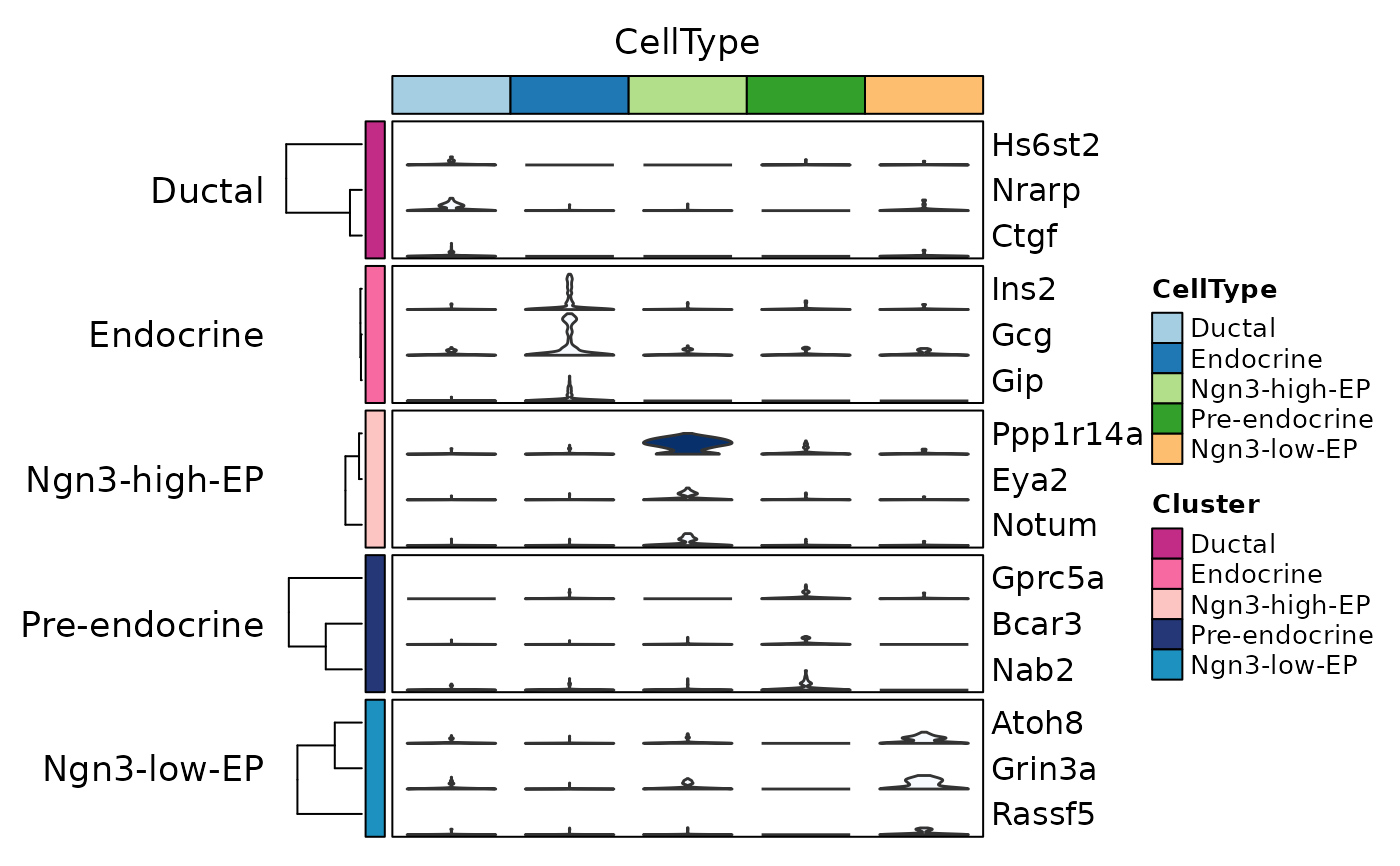
 ht6 <- GroupHeatmap(
pancreas_sub,
features = de_top$gene,
feature_split = de_top$group1,
group.by = "CellType",
add_violin = TRUE,
cluster_rows = TRUE,
nlabel = 0,
show_row_names = TRUE
)
#> Warning: No shared levels found between `names(values)` of the manual scale and the
#> data's colour values.
#> Warning: No shared levels found between `names(values)` of the manual scale and the
#> data's colour values.
#> Warning: No shared levels found between `names(values)` of the manual scale and the
#> data's colour values.
#> Warning: No shared levels found between `names(values)` of the manual scale and the
#> data's colour values.
#> Warning: No shared levels found between `names(values)` of the manual scale and the
#> data's colour values.
#> Warning: No shared levels found between `names(values)` of the manual scale and the
#> data's colour values.
#> Warning: No shared levels found between `names(values)` of the manual scale and the
#> data's colour values.
#> Warning: No shared levels found between `names(values)` of the manual scale and the
#> data's colour values.
#> Warning: No shared levels found between `names(values)` of the manual scale and the
#> data's colour values.
#> Warning: No shared levels found between `names(values)` of the manual scale and the
#> data's colour values.
#> Warning: No shared levels found between `names(values)` of the manual scale and the
#> data's colour values.
#> Warning: No shared levels found between `names(values)` of the manual scale and the
#> data's colour values.
#> Warning: No shared levels found between `names(values)` of the manual scale and the
#> data's colour values.
#> Warning: No shared levels found between `names(values)` of the manual scale and the
#> data's colour values.
#> Warning: No shared levels found between `names(values)` of the manual scale and the
#> data's colour values.
#> Warning: No shared levels found between `names(values)` of the manual scale and the
#> data's colour values.
#> Warning: No shared levels found between `names(values)` of the manual scale and the
#> data's colour values.
#> Warning: No shared levels found between `names(values)` of the manual scale and the
#> data's colour values.
#> Warning: No shared levels found between `names(values)` of the manual scale and the
#> data's colour values.
#> Warning: No shared levels found between `names(values)` of the manual scale and the
#> data's colour values.
#> Warning: No shared levels found between `names(values)` of the manual scale and the
#> data's colour values.
#> Warning: No shared levels found between `names(values)` of the manual scale and the
#> data's colour values.
#> Warning: No shared levels found between `names(values)` of the manual scale and the
#> data's colour values.
#> Warning: No shared levels found between `names(values)` of the manual scale and the
#> data's colour values.
#> Warning: No shared levels found between `names(values)` of the manual scale and the
#> data's colour values.
#> Warning: No shared levels found between `names(values)` of the manual scale and the
#> data's colour values.
#> Warning: No shared levels found between `names(values)` of the manual scale and the
#> data's colour values.
#> Warning: No shared levels found between `names(values)` of the manual scale and the
#> data's colour values.
#> Warning: No shared levels found between `names(values)` of the manual scale and the
#> data's colour values.
#> Warning: No shared levels found between `names(values)` of the manual scale and the
#> data's colour values.
#> Warning: No shared levels found between `names(values)` of the manual scale and the
#> data's colour values.
#> Warning: No shared levels found between `names(values)` of the manual scale and the
#> data's colour values.
#> Warning: No shared levels found between `names(values)` of the manual scale and the
#> data's colour values.
#> Warning: No shared levels found between `names(values)` of the manual scale and the
#> data's colour values.
#> Warning: No shared levels found between `names(values)` of the manual scale and the
#> data's colour values.
#> Warning: No shared levels found between `names(values)` of the manual scale and the
#> data's colour values.
#> Warning: No shared levels found between `names(values)` of the manual scale and the
#> data's colour values.
#> Warning: No shared levels found between `names(values)` of the manual scale and the
#> data's colour values.
#> Warning: No shared levels found between `names(values)` of the manual scale and the
#> data's colour values.
#> Warning: No shared levels found between `names(values)` of the manual scale and the
#> data's colour values.
#> Warning: No shared levels found between `names(values)` of the manual scale and the
#> data's colour values.
#> Warning: No shared levels found between `names(values)` of the manual scale and the
#> data's colour values.
#> Warning: No shared levels found between `names(values)` of the manual scale and the
#> data's colour values.
#> Warning: No shared levels found between `names(values)` of the manual scale and the
#> data's colour values.
#> Warning: No shared levels found between `names(values)` of the manual scale and the
#> data's colour values.
#> Warning: No shared levels found between `names(values)` of the manual scale and the
#> data's colour values.
#> Warning: No shared levels found between `names(values)` of the manual scale and the
#> data's colour values.
#> Warning: No shared levels found between `names(values)` of the manual scale and the
#> data's colour values.
#> Warning: No shared levels found between `names(values)` of the manual scale and the
#> data's colour values.
#> Warning: No shared levels found between `names(values)` of the manual scale and the
#> data's colour values.
#> Warning: No shared levels found between `names(values)` of the manual scale and the
#> data's colour values.
#> Warning: No shared levels found between `names(values)` of the manual scale and the
#> data's colour values.
#> Warning: No shared levels found between `names(values)` of the manual scale and the
#> data's colour values.
#> Warning: No shared levels found between `names(values)` of the manual scale and the
#> data's colour values.
#> Warning: No shared levels found between `names(values)` of the manual scale and the
#> data's colour values.
#> Warning: No shared levels found between `names(values)` of the manual scale and the
#> data's colour values.
#> Warning: No shared levels found between `names(values)` of the manual scale and the
#> data's colour values.
#> Warning: No shared levels found between `names(values)` of the manual scale and the
#> data's colour values.
#> Warning: No shared levels found between `names(values)` of the manual scale and the
#> data's colour values.
#> Warning: No shared levels found between `names(values)` of the manual scale and the
#> data's colour values.
#> Warning: No shared levels found between `names(values)` of the manual scale and the
#> data's colour values.
#> Warning: No shared levels found between `names(values)` of the manual scale and the
#> data's colour values.
#> Warning: No shared levels found between `names(values)` of the manual scale and the
#> data's colour values.
#> Warning: No shared levels found between `names(values)` of the manual scale and the
#> data's colour values.
#> Warning: No shared levels found between `names(values)` of the manual scale and the
#> data's colour values.
#> Warning: No shared levels found between `names(values)` of the manual scale and the
#> data's colour values.
#> Warning: No shared levels found between `names(values)` of the manual scale and the
#> data's colour values.
#> Warning: No shared levels found between `names(values)` of the manual scale and the
#> data's colour values.
#> Warning: No shared levels found between `names(values)` of the manual scale and the
#> data's colour values.
#> Warning: No shared levels found between `names(values)` of the manual scale and the
#> data's colour values.
#> Warning: No shared levels found between `names(values)` of the manual scale and the
#> data's colour values.
#> Warning: No shared levels found between `names(values)` of the manual scale and the
#> data's colour values.
#> Warning: No shared levels found between `names(values)` of the manual scale and the
#> data's colour values.
#> Warning: No shared levels found between `names(values)` of the manual scale and the
#> data's colour values.
#> Warning: No shared levels found between `names(values)` of the manual scale and the
#> data's colour values.
ht6$plot
ht6 <- GroupHeatmap(
pancreas_sub,
features = de_top$gene,
feature_split = de_top$group1,
group.by = "CellType",
add_violin = TRUE,
cluster_rows = TRUE,
nlabel = 0,
show_row_names = TRUE
)
#> Warning: No shared levels found between `names(values)` of the manual scale and the
#> data's colour values.
#> Warning: No shared levels found between `names(values)` of the manual scale and the
#> data's colour values.
#> Warning: No shared levels found between `names(values)` of the manual scale and the
#> data's colour values.
#> Warning: No shared levels found between `names(values)` of the manual scale and the
#> data's colour values.
#> Warning: No shared levels found between `names(values)` of the manual scale and the
#> data's colour values.
#> Warning: No shared levels found between `names(values)` of the manual scale and the
#> data's colour values.
#> Warning: No shared levels found between `names(values)` of the manual scale and the
#> data's colour values.
#> Warning: No shared levels found between `names(values)` of the manual scale and the
#> data's colour values.
#> Warning: No shared levels found between `names(values)` of the manual scale and the
#> data's colour values.
#> Warning: No shared levels found between `names(values)` of the manual scale and the
#> data's colour values.
#> Warning: No shared levels found between `names(values)` of the manual scale and the
#> data's colour values.
#> Warning: No shared levels found between `names(values)` of the manual scale and the
#> data's colour values.
#> Warning: No shared levels found between `names(values)` of the manual scale and the
#> data's colour values.
#> Warning: No shared levels found between `names(values)` of the manual scale and the
#> data's colour values.
#> Warning: No shared levels found between `names(values)` of the manual scale and the
#> data's colour values.
#> Warning: No shared levels found between `names(values)` of the manual scale and the
#> data's colour values.
#> Warning: No shared levels found between `names(values)` of the manual scale and the
#> data's colour values.
#> Warning: No shared levels found between `names(values)` of the manual scale and the
#> data's colour values.
#> Warning: No shared levels found between `names(values)` of the manual scale and the
#> data's colour values.
#> Warning: No shared levels found between `names(values)` of the manual scale and the
#> data's colour values.
#> Warning: No shared levels found between `names(values)` of the manual scale and the
#> data's colour values.
#> Warning: No shared levels found between `names(values)` of the manual scale and the
#> data's colour values.
#> Warning: No shared levels found between `names(values)` of the manual scale and the
#> data's colour values.
#> Warning: No shared levels found between `names(values)` of the manual scale and the
#> data's colour values.
#> Warning: No shared levels found between `names(values)` of the manual scale and the
#> data's colour values.
#> Warning: No shared levels found between `names(values)` of the manual scale and the
#> data's colour values.
#> Warning: No shared levels found between `names(values)` of the manual scale and the
#> data's colour values.
#> Warning: No shared levels found between `names(values)` of the manual scale and the
#> data's colour values.
#> Warning: No shared levels found between `names(values)` of the manual scale and the
#> data's colour values.
#> Warning: No shared levels found between `names(values)` of the manual scale and the
#> data's colour values.
#> Warning: No shared levels found between `names(values)` of the manual scale and the
#> data's colour values.
#> Warning: No shared levels found between `names(values)` of the manual scale and the
#> data's colour values.
#> Warning: No shared levels found between `names(values)` of the manual scale and the
#> data's colour values.
#> Warning: No shared levels found between `names(values)` of the manual scale and the
#> data's colour values.
#> Warning: No shared levels found between `names(values)` of the manual scale and the
#> data's colour values.
#> Warning: No shared levels found between `names(values)` of the manual scale and the
#> data's colour values.
#> Warning: No shared levels found between `names(values)` of the manual scale and the
#> data's colour values.
#> Warning: No shared levels found between `names(values)` of the manual scale and the
#> data's colour values.
#> Warning: No shared levels found between `names(values)` of the manual scale and the
#> data's colour values.
#> Warning: No shared levels found between `names(values)` of the manual scale and the
#> data's colour values.
#> Warning: No shared levels found between `names(values)` of the manual scale and the
#> data's colour values.
#> Warning: No shared levels found between `names(values)` of the manual scale and the
#> data's colour values.
#> Warning: No shared levels found between `names(values)` of the manual scale and the
#> data's colour values.
#> Warning: No shared levels found between `names(values)` of the manual scale and the
#> data's colour values.
#> Warning: No shared levels found between `names(values)` of the manual scale and the
#> data's colour values.
#> Warning: No shared levels found between `names(values)` of the manual scale and the
#> data's colour values.
#> Warning: No shared levels found between `names(values)` of the manual scale and the
#> data's colour values.
#> Warning: No shared levels found between `names(values)` of the manual scale and the
#> data's colour values.
#> Warning: No shared levels found between `names(values)` of the manual scale and the
#> data's colour values.
#> Warning: No shared levels found between `names(values)` of the manual scale and the
#> data's colour values.
#> Warning: No shared levels found between `names(values)` of the manual scale and the
#> data's colour values.
#> Warning: No shared levels found between `names(values)` of the manual scale and the
#> data's colour values.
#> Warning: No shared levels found between `names(values)` of the manual scale and the
#> data's colour values.
#> Warning: No shared levels found between `names(values)` of the manual scale and the
#> data's colour values.
#> Warning: No shared levels found between `names(values)` of the manual scale and the
#> data's colour values.
#> Warning: No shared levels found between `names(values)` of the manual scale and the
#> data's colour values.
#> Warning: No shared levels found between `names(values)` of the manual scale and the
#> data's colour values.
#> Warning: No shared levels found between `names(values)` of the manual scale and the
#> data's colour values.
#> Warning: No shared levels found between `names(values)` of the manual scale and the
#> data's colour values.
#> Warning: No shared levels found between `names(values)` of the manual scale and the
#> data's colour values.
#> Warning: No shared levels found between `names(values)` of the manual scale and the
#> data's colour values.
#> Warning: No shared levels found between `names(values)` of the manual scale and the
#> data's colour values.
#> Warning: No shared levels found between `names(values)` of the manual scale and the
#> data's colour values.
#> Warning: No shared levels found between `names(values)` of the manual scale and the
#> data's colour values.
#> Warning: No shared levels found between `names(values)` of the manual scale and the
#> data's colour values.
#> Warning: No shared levels found between `names(values)` of the manual scale and the
#> data's colour values.
#> Warning: No shared levels found between `names(values)` of the manual scale and the
#> data's colour values.
#> Warning: No shared levels found between `names(values)` of the manual scale and the
#> data's colour values.
#> Warning: No shared levels found between `names(values)` of the manual scale and the
#> data's colour values.
#> Warning: No shared levels found between `names(values)` of the manual scale and the
#> data's colour values.
#> Warning: No shared levels found between `names(values)` of the manual scale and the
#> data's colour values.
#> Warning: No shared levels found between `names(values)` of the manual scale and the
#> data's colour values.
#> Warning: No shared levels found between `names(values)` of the manual scale and the
#> data's colour values.
#> Warning: No shared levels found between `names(values)` of the manual scale and the
#> data's colour values.
#> Warning: No shared levels found between `names(values)` of the manual scale and the
#> data's colour values.
ht6$plot
 ht7 <- GroupHeatmap(
pancreas_sub,
features = de_top$gene,
feature_split = de_top$group1,
group.by = "CellType",
add_violin = TRUE,
fill.by = "expression",
fill_palette = "Blues",
cluster_rows = TRUE,
nlabel = 0,
show_row_names = TRUE
)
ht7$plot
ht7 <- GroupHeatmap(
pancreas_sub,
features = de_top$gene,
feature_split = de_top$group1,
group.by = "CellType",
add_violin = TRUE,
fill.by = "expression",
fill_palette = "Blues",
cluster_rows = TRUE,
nlabel = 0,
show_row_names = TRUE
)
ht7$plot
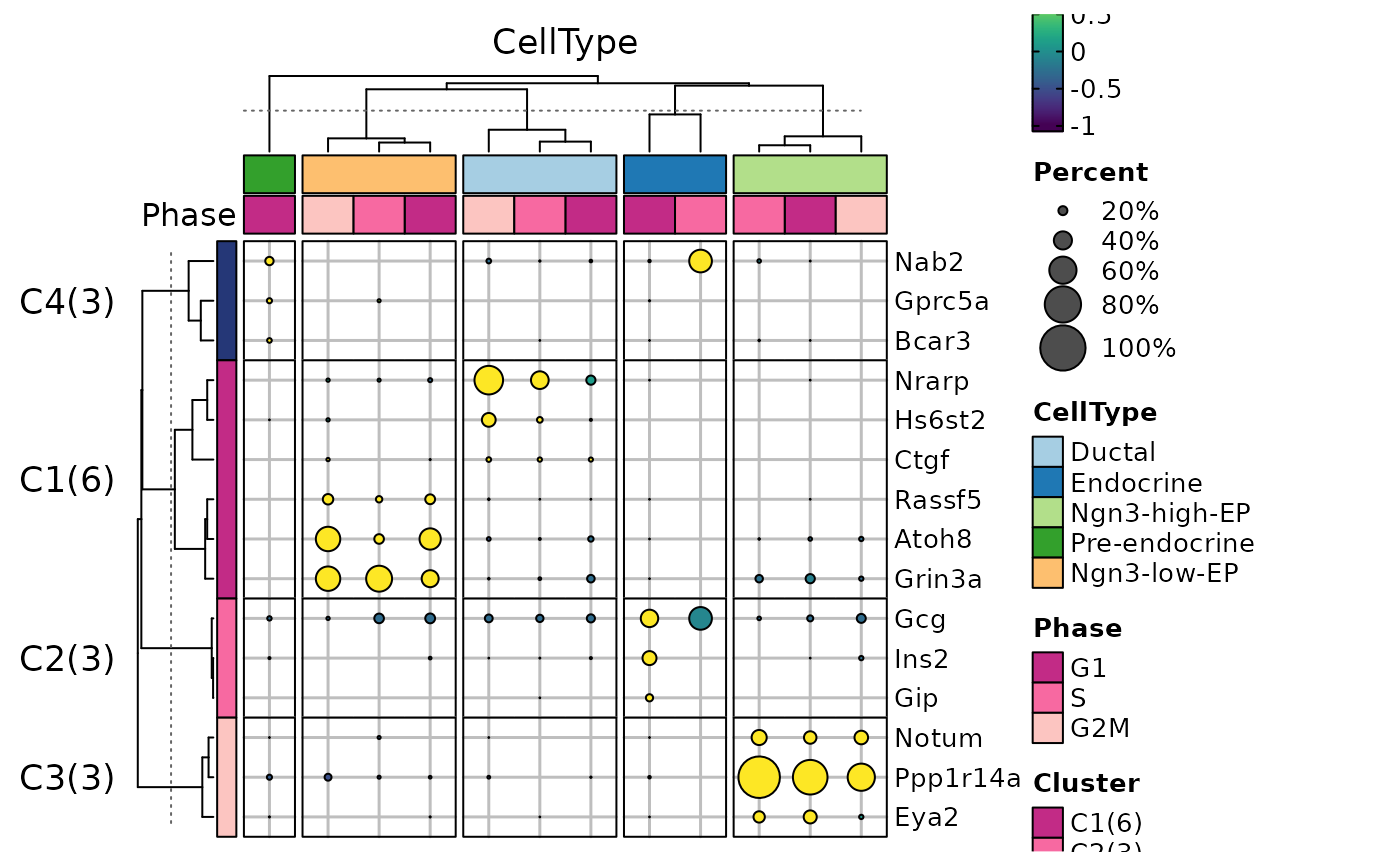 ht8 <- GroupHeatmap(
pancreas_sub,
features = de_top$gene,
group.by = "CellType",
split.by = "Phase",
n_split = 4,
cluster_rows = TRUE,
cluster_columns = TRUE,
cluster_row_slices = TRUE,
cluster_column_slices = TRUE,
add_dot = TRUE,
add_reticle = TRUE,
heatmap_palette = "viridis",
nlabel = 0,
show_row_names = TRUE,
ht_params = list(
row_gap = grid::unit(0, "mm"),
row_names_gp = grid::gpar(fontsize = 10)
)
)
ht8$plot
ht8 <- GroupHeatmap(
pancreas_sub,
features = de_top$gene,
group.by = "CellType",
split.by = "Phase",
n_split = 4,
cluster_rows = TRUE,
cluster_columns = TRUE,
cluster_row_slices = TRUE,
cluster_column_slices = TRUE,
add_dot = TRUE,
add_reticle = TRUE,
heatmap_palette = "viridis",
nlabel = 0,
show_row_names = TRUE,
ht_params = list(
row_gap = grid::unit(0, "mm"),
row_names_gp = grid::gpar(fontsize = 10)
)
)
ht8$plot