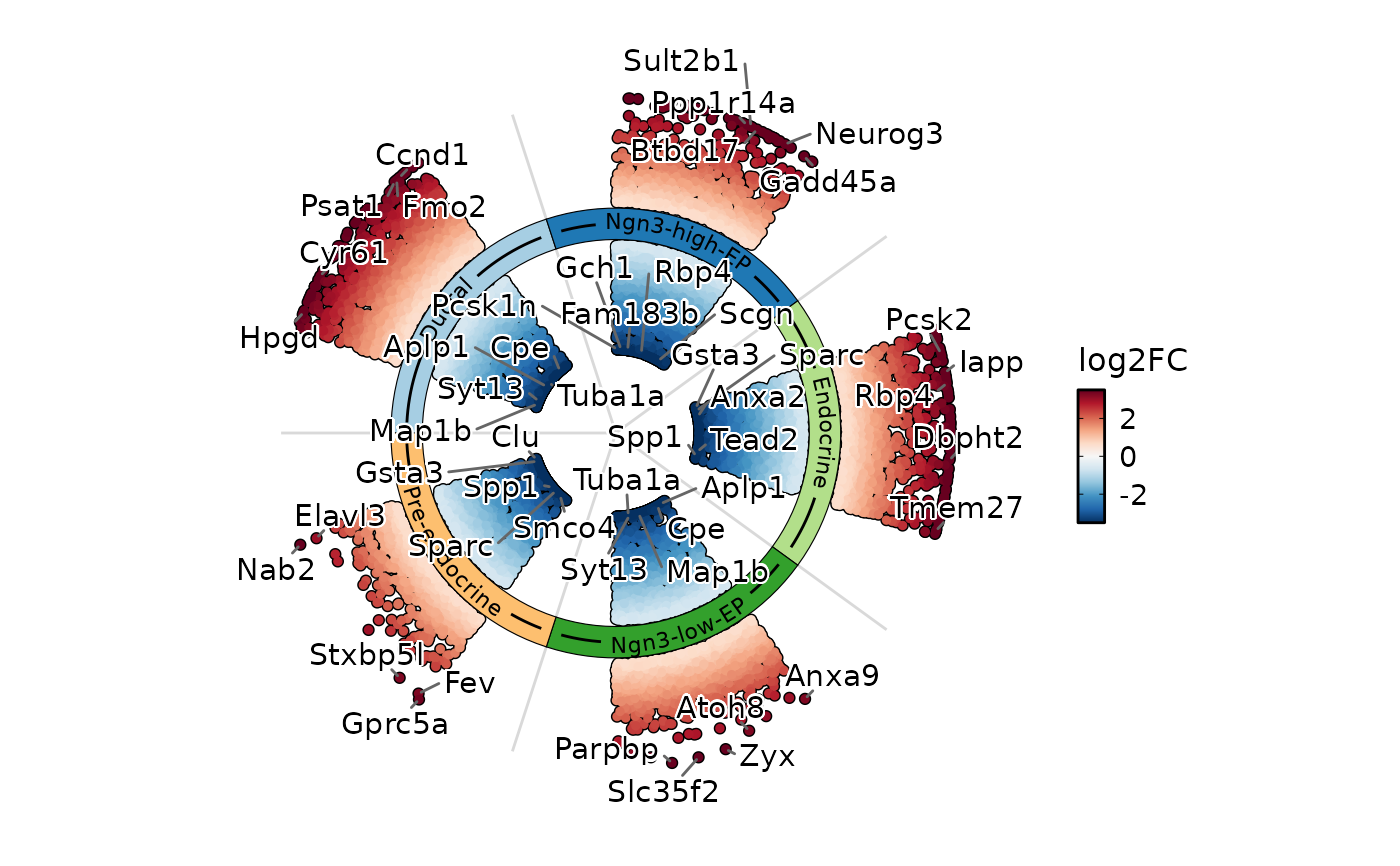
Draw a circular (ring) plot of differential expression results by cell type.
Usage
DEtestRingPlot(
  srt,
  group.by = NULL,
  test.use = "wilcox",
  res = NULL,
  group_use = NULL,
  DE_threshold = "avg_log2FC > 0 & p_val_adj < 0.05",
  group_palette = "Chinese",
  group_palcolor = NULL,
  pt.size = 1,
  pt.alpha = 1,
  cols.highlight = "black",
  sizes.highlight = 1,
  alpha.highlight = 1,
  stroke.highlight = 0.5,
  nlabel = 5,
  features_label = NULL,
  only.pos = FALSE,
  label.by = c("p_val_adj", "p_val", "diff_pct", "avg_log2FC"),
  label.fg = "black",
  label.bg = "white",
  label.bg.r = 0.1,
  label.size = 4,
  palette = "RdBu",
  palcolor = NULL,
  theme_use = "theme_scop",
  theme_args = list(),
  tile_height = 0.3,
  tile_gap = 0.1,
  jitter_width = 0.5,
  ring_segments = TRUE,
  seed = 11
)
Arguments
- srt
A
Seuratobject orSummarizedExperimentobject containing the results of differential expression analysis.- group.by
Name of one or more meta.data columns to group (color) cells by.
- test.use
A character string specifying the type of statistical test to use. Default is
"wilcox".- res
A
data.frameordata.tablewith differential expression results. Whenresis provided,srtwill be ignored. The data.frame must contain columns:gene,group1(factor or character),avg_log2FC,p_val_adj, and optionallypct.1andpct.2for calculatingdiff_pct.- group_use
Groups to plot. Default is
NULL(all groups).- DE_threshold
A character string specifying the threshold for differential expression (used to highlight significant genes in all plot types). Default is
"p_val < 0.05"for sample-level methods ("edgeR"and"limma"). For cell-level volcano plots, it is"abs(avg_log2FC) > 0 & p_val_adj < 0.05"whenonly.pos = FALSE, and"avg_log2FC > 0 & p_val_adj < 0.05"otherwise.- group_palette
Palette for cell types (groups) in Manhattan plot. Default is
"Chinese".- group_palcolor
Custom colors for cell types (groups) in Manhattan plot. Default is
NULL.- pt.size
The size of the points. Default is
1.- pt.alpha
The transparency of the data points. Default is
1.- cols.highlight
A character string specifying the color for highlighted points. Default is
"black".- sizes.highlight
The size of the highlighted points. Default is
1.- alpha.highlight
The transparency of the highlighted points. Default is
1.- stroke.highlight
The stroke width for the highlighted points. Default is
0.5.- nlabel
An integer value specifying the number of labeled points per group. Default is
5.- features_label
A character vector specifying the feature labels to plot. Default is
NULL.- only.pos
Whether to show only positive log2 fold-change results in differential expression visualizations. Default is
FALSE.- label.by
Metric used to select automatic labels when
features_label = NULL. Options are"p_val_adj","p_val","diff_pct", and"avg_log2FC". Smaller p-values are ranked first;diff_pctandavg_log2FCuse the strongest positive and negative effects within each group. Default is"p_val_adj".- label.fg
A character string specifying the color for the labels' foreground. Default is
"black".- label.bg
A character string specifying the color for the labels' background. Default is
"white".- label.bg.r
The radius of the rounding of the labels' background. Default is
0.1.- label.size
The size of the labels. Default is
4.- palette
Color palette name. Available palettes can be found in thisplot::show_palettes. Default is
"RdBu".- palcolor
Custom colors used to create a color palette. Default is
NULL.- theme_use
Theme to use for the plot. Default is
"theme_scop".- theme_args
A list of additional arguments to pass to the theme function. Default is
list().- tile_height
Height of the cell-type track in ring plot. Default is
0.3.- tile_gap
Gap between the track and nudged points in ring plot. Default is
0.1.- jitter_width
Horizontal jitter range for points in Manhattan plot. Default is
0.5.- ring_segments
Whether to draw segment lines between cell types in ring plot. Default is
TRUE.- seed
Random seed for jitter in Manhattan and ring plots. Default is
11.
Examples
data(pancreas_sub)
pancreas_sub <- standard_scop(pancreas_sub)
#> ℹ [2026-07-20 17:26:13] Start standard processing workflow...
#> ℹ [2026-07-20 17:26:13] Checking a list of <Seurat>...
#> ! [2026-07-20 17:26:13] Data 1/1 of the `srt_list` is "unknown"
#> ℹ [2026-07-20 17:26:13] Perform `NormalizeData()` with `normalization.method = 'LogNormalize'` on 1/1 of `srt_list`...
#> ℹ [2026-07-20 17:26:13] Perform `FindVariableFeatures()` on 1/1 of `srt_list`...
#> ℹ [2026-07-20 17:26:14] Use the separate HVF from `srt_list`
#> ℹ [2026-07-20 17:26:14] Number of available HVF: 2000
#> ℹ [2026-07-20 17:26:14] Finished check
#> ℹ [2026-07-20 17:26:14] Perform `ScaleData()`
#> ℹ [2026-07-20 17:26:14] Perform pca linear dimension reduction
#> ℹ [2026-07-20 17:26:15] Use stored estimated dimensions 1:23 for Standardpca
#> ℹ [2026-07-20 17:26:15] Perform `Seurat::FindClusters()` with `cluster_algorithm = 'louvain'` and `cluster_resolution = 0.6`
#> ℹ [2026-07-20 17:26:15] Reorder clusters...
#> ℹ [2026-07-20 17:26:15] Skip `log1p()` because `layer = data` is not "counts"
#> ℹ [2026-07-20 17:26:15] Perform umap nonlinear dimension reduction
#> ✔ [2026-07-20 17:26:21] Standard processing workflow completed
pancreas_sub <- RunDEtest(
  pancreas_sub,
  group.by = "CellType",
  only.pos = FALSE
)
#> ℹ [2026-07-20 17:26:22] Data type is log-normalized
#> ℹ [2026-07-20 17:26:22] Start differential expression test
#> ℹ [2026-07-20 17:26:22] Find all markers(wilcox) among [1] 5 groups...
#> ℹ [2026-07-20 17:26:22] Using 1 core
#> ⠙ [2026-07-20 17:26:22] Running for Ductal [1/5] ■■          20% | ETA:  1s
#> ✔ [2026-07-20 17:26:22] Completed 5 tasks in 1.2s
#>
#> ℹ [2026-07-20 17:26:22] Building results
#> ✔ [2026-07-20 17:26:23] Differential expression test completed
DEtestRingPlot(
  pancreas_sub,
  group.by = "CellType"
)