Plots the density of specified features in a single or multiple groups, grouped by specified variables.
Usage
CellDensityPlot(
  srt,
  features,
  group.by = NULL,
  split.by = NULL,
  assay = NULL,
  layer = "data",
  flip = FALSE,
  reverse = FALSE,
  x_order = c("value", "rank"),
  decreasing = NULL,
  palette = "Chinese",
  palcolor = NULL,
  cells = NULL,
  keep_empty = FALSE,
  y.nbreaks = 4,
  y.min = NULL,
  y.max = NULL,
  same.y.lims = FALSE,
  aspect.ratio = NULL,
  title = NULL,
  subtitle = NULL,
  legend.position = "right",
  legend.direction = "vertical",
  theme_use = "theme_scop",
  theme_args = list(),
  combine = TRUE,
  nrow = NULL,
  ncol = NULL,
  byrow = TRUE,
  force = FALSE,
  verbose = TRUE
)
Arguments
- srt
A Seurat object.
- features
A character vector of features to use.
- group.by
Name of one or more meta.data columns to group (color) cells by.
- split.by
Name of a column in meta.data column to split plot by. Default is
NULL.- assay
Which assay to use. If
NULL, the default assay of the Seurat object will be used. When the object also containsChromatinAssay, the default assay and additionalChromatinAssaywill be preprocessed sequentially.- layer
Which layer to use. Default is
data.- flip
Whether to flip the x-axis. Default is
FALSE.- reverse
Whether to reverse the y-axis. Default is
FALSE.- x_order
A character specifying how to order the x-axis. Can be
"value"or"rank". Default is"value".- decreasing
Whether to order the groups in decreasing order. Default is
NULL.- palette
Color palette name. Available palettes can be found in thisplot::show_palettes. Default is
"Chinese".- palcolor
Custom colors used to create a color palette. Default is
NULL.- cells
A character vector of cell names to use. Default is
NULL, which means all cells are included.- keep_empty
Whether to keep empty groups. Default is
FALSE.- y.nbreaks
A number of breaks on the y-axis. Default is
4.- y.min
A numeric specifying the minimum value on the y-axis. Default is
NULL, which means the minimum value will be automatically determined.- y.max
A numeric specifying the maximum value on the y-axis. Default is
NULL, which means the maximum value will be automatically determined.- same.y.lims
Whether to use the same y-axis limits for all plots. Default is
FALSE.- aspect.ratio
Aspect ratio of the panel. Default is
NULL.- title
The text for the title. Default is
NULL.- subtitle
The text for the subtitle for the plot which will be displayed below the title. Default is
NULL.- legend.position
The position of legends, one of
"none","left","right","bottom","top". Default is"right".- legend.direction
The direction of the legend in the plot. Can be one of
"vertical"or"horizontal".- theme_use
Theme used. Can be a character string or a theme function. Default is
"theme_scop".- theme_args
Other arguments passed to the
theme_use. Default islist().- combine
Combine plots into a single
patchworkobject. IfFALSE, return a list of ggplot objects.- nrow
Number of rows in the combined plot. Default is
NULL, which means determined automatically based on the number of plots.- ncol
Number of columns in the combined plot. Default is
NULL, which means determined automatically based on the number of plots.- byrow
Whether to arrange the plots by row in the combined plot. Default is
TRUE.- force
Whether to continue plotting if there are more than 50 features. Default is
FALSE.- verbose
Whether to print the message. Default is
TRUE.
Examples
data(pancreas_sub)
pancreas_sub <- standard_scop(pancreas_sub)
#> ℹ [2026-07-02 08:19:56] Start standard processing workflow...
#> ℹ [2026-07-02 08:19:57] Checking a list of <Seurat>...
#> ! [2026-07-02 08:19:57] Data 1/1 of the `srt_list` is "unknown"
#> ℹ [2026-07-02 08:19:57] Perform `NormalizeData()` with `normalization.method = 'LogNormalize'` on 1/1 of `srt_list`...
#> ℹ [2026-07-02 08:19:57] Perform `FindVariableFeatures()` on 1/1 of `srt_list`...
#> ℹ [2026-07-02 08:19:57] Use the separate HVF from `srt_list`
#> ℹ [2026-07-02 08:19:57] Number of available HVF: 2000
#> ℹ [2026-07-02 08:19:58] Finished check
#> ℹ [2026-07-02 08:19:58] Perform `ScaleData()`
#> ℹ [2026-07-02 08:19:58] Perform pca linear dimension reduction
#> ℹ [2026-07-02 08:19:58] Use stored estimated dimensions 1:23 for Standardpca
#> ℹ [2026-07-02 08:19:58] Perform `Seurat::FindClusters()` with `cluster_algorithm = 'louvain'` and `cluster_resolution = 0.6`
#> ℹ [2026-07-02 08:19:59] Reorder clusters...
#> ℹ [2026-07-02 08:19:59] Skip `log1p()` because `layer = data` is not "counts"
#> ℹ [2026-07-02 08:19:59] Perform umap nonlinear dimension reduction
#> ✔ [2026-07-02 08:20:02] Standard processing workflow completed
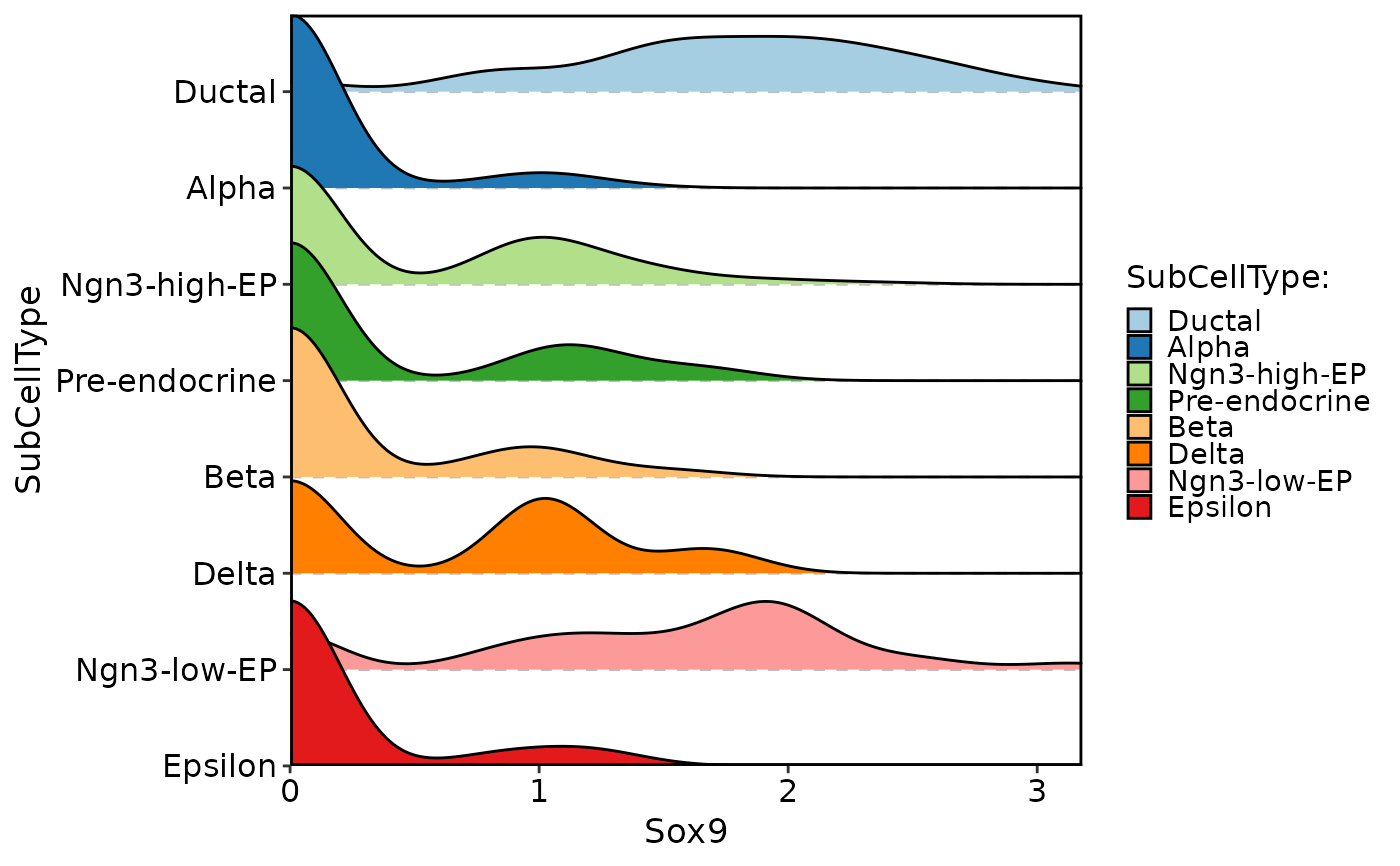
CellDensityPlot(
pancreas_sub,
features = "Sox9",
group.by = "SubCellType"
)
#> Picking joint bandwidth of 0.209
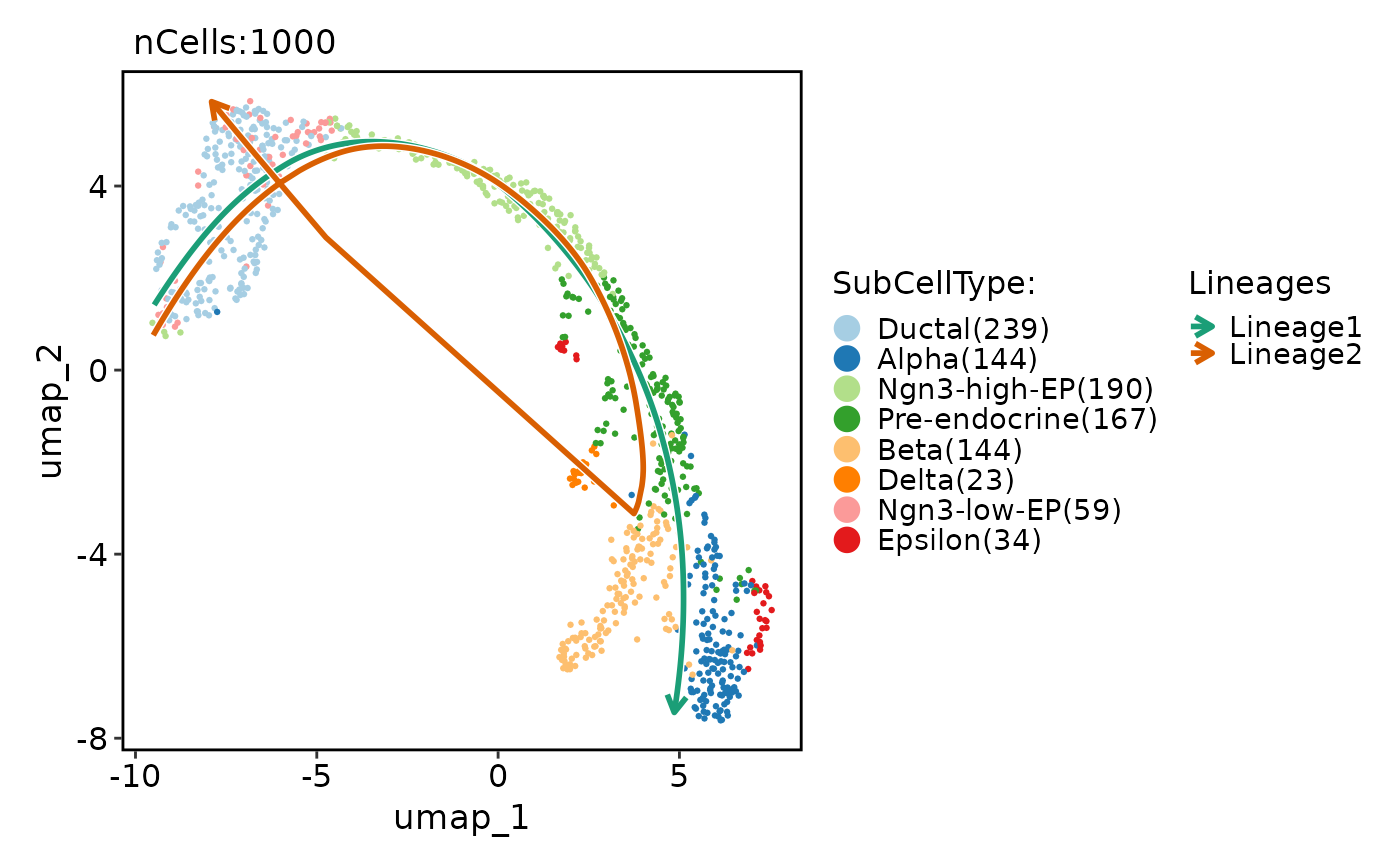
 pancreas_sub <- RunSlingshot(
pancreas_sub,
group.by = "SubCellType",
reduction = "UMAP"
)
#> Warning: Removed 18 rows containing missing values or values outside the scale range
#> (`geom_path()`).
#> Warning: Removed 18 rows containing missing values or values outside the scale range
#> (`geom_path()`).
#> Warning: Removed 4 rows containing missing values or values outside the scale range
#> (`geom_path()`).
#> Warning: Removed 4 rows containing missing values or values outside the scale range
#> (`geom_path()`).
pancreas_sub <- RunSlingshot(
pancreas_sub,
group.by = "SubCellType",
reduction = "UMAP"
)
#> Warning: Removed 18 rows containing missing values or values outside the scale range
#> (`geom_path()`).
#> Warning: Removed 18 rows containing missing values or values outside the scale range
#> (`geom_path()`).
#> Warning: Removed 4 rows containing missing values or values outside the scale range
#> (`geom_path()`).
#> Warning: Removed 4 rows containing missing values or values outside the scale range
#> (`geom_path()`).
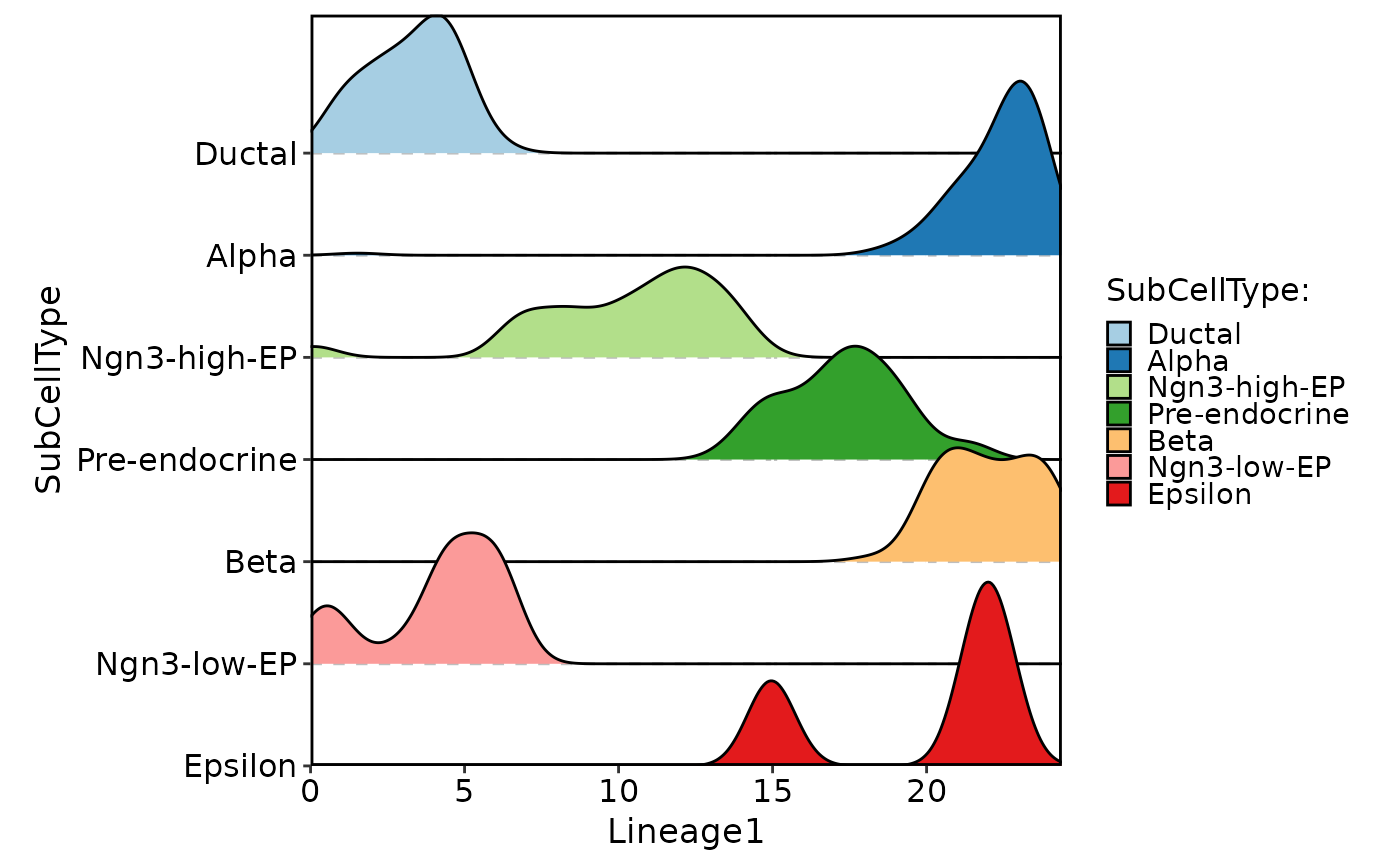
 CellDensityPlot(
pancreas_sub,
features = "Lineage1",
group.by = "SubCellType",
aspect.ratio = 1
)
#> Picking joint bandwidth of 0.421
CellDensityPlot(
pancreas_sub,
features = "Lineage1",
group.by = "SubCellType",
aspect.ratio = 1
)
#> Picking joint bandwidth of 0.421
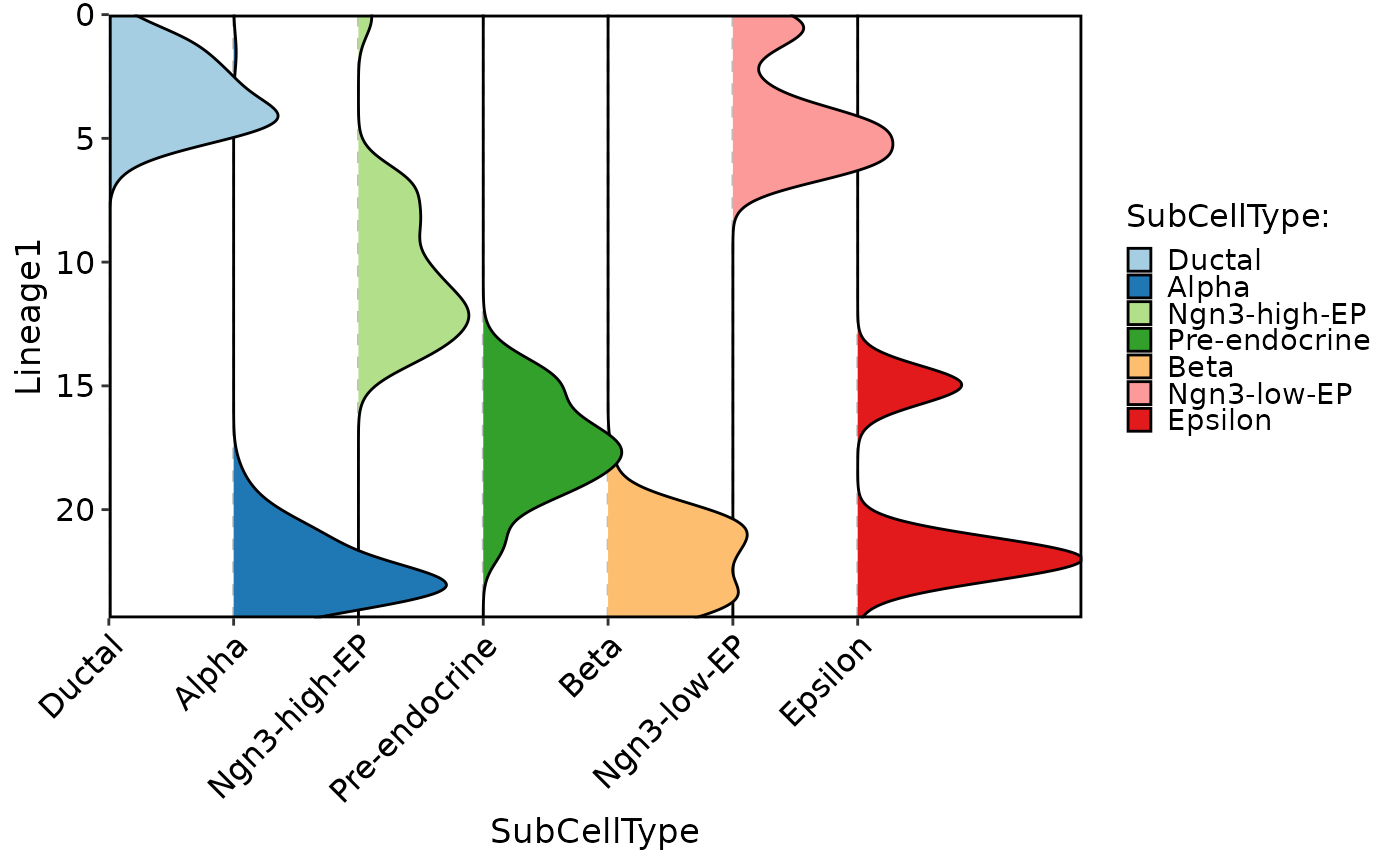
 CellDensityPlot(
pancreas_sub,
features = "Lineage1",
group.by = "SubCellType",
flip = TRUE
)
#> Picking joint bandwidth of 0.421
CellDensityPlot(
pancreas_sub,
features = "Lineage1",
group.by = "SubCellType",
flip = TRUE
)
#> Picking joint bandwidth of 0.421