Run Palantir analysis
Usage
RunPalantir(
  srt = NULL,
  assay_x = "RNA",
  layer_x = "counts",
  assay_y = c("spliced", "unspliced"),
  layer_y = "counts",
  adata = NULL,
  group.by = NULL,
  linear_reduction = NULL,
  nonlinear_reduction = NULL,
  basis = NULL,
  n_pcs = 30,
  n_neighbors = 30,
  dm_n_components = 10,
  dm_alpha = 0,
  dm_n_eigs = NULL,
  early_group = NULL,
  early_cell = NULL,
  terminal_cells = NULL,
  terminal_groups = NULL,
  num_waypoints = 1200,
  scale_components = TRUE,
  use_early_cell_as_start = TRUE,
  adjust_early_cell = FALSE,
  adjust_terminal_cells = FALSE,
  max_iterations = 25,
  cores = 1,
  point_size = 20,
  palette = "Chinese",
  palcolor = NULL,
  legend.position = "on data",
  show_plot = FALSE,
  save_plot = FALSE,
  plot_format = c("pdf", "png", "svg"),
  plot_dpi = 300,
  plot_prefix = "palantir",
  dirpath = "./",
  backend = c("cpp", "python"),
  return_seurat = !is.null(srt),
  verbose = TRUE
)
Arguments
- srt
A Seurat object. Default is
NULL. If provided,adatawill be ignored.- assay_x
Assay to convert as the main data matrix in the anndata object. Default is
"RNA".- layer_x
Layer name for assay_x in the Seurat object. Default is
"counts".- assay_y
Assays to convert as layers in the anndata object. Default is
c("spliced", "unspliced").- layer_y
Layer names for the assay_y in the Seurat object. Default is
"counts".- adata
An anndata object. Default is
NULL.- group.by
Name of one or more meta.data columns to group (color) cells by.
- linear_reduction
The linear dimensionality reduction method to use. Options are
"pca","svd","ica","nmf","mds", or"glmpca". Default is"pca".- nonlinear_reduction
The nonlinear dimensionality reduction method to use. Options are
"umap","umap-naive","tsne","dm","phate","pacmap","trimap","largevis", or"fr". Default is"umap".- basis
The basis to use for reduction, e.g.,
"UMAP".- n_pcs
Number of principal components to use for linear reduction. Default is
30.- n_neighbors
Number of neighbors to use for constructing the KNN graph. Default is
30.- dm_n_components
The number of diffusion components to calculate.
- dm_alpha
Normalization parameter for the diffusion operator.
- dm_n_eigs
Number of eigen vectors to use.
- early_group
Name of the group to start Palantir analysis from.
- early_cell
Name of the cell to start Palantir analysis from.
- terminal_cells
Character vector specifying terminal cells for Palantir analysis.
- terminal_groups
Character vector specifying terminal groups for Palantir analysis.
- num_waypoints
Number of waypoints to be included.
- scale_components
Should the cell fate probabilities be scaled for each component independently?
- use_early_cell_as_start
Should the starting cell for each terminal group be set as early_cell?
- adjust_early_cell
Whether to adjust the early cell to the cell with the minimum pseudotime value.
- adjust_terminal_cells
Whether to adjust the terminal cells to the cells with the maximum pseudotime value for each terminal group.
- max_iterations
Maximum number of iterations for pseudotime convergence.
- cores
The number of cores to use for
cellrank.- point_size
The point size for plotting.
- palette
Color palette name. Available palettes can be found in thisplot::show_palettes. Default is
"Chinese".- palcolor
Custom colors used to create a color palette. Default is
NULL.- legend.position
Position of legend in plots. Can be
"on data","right margin","bottom right", etc. Default is"on data".- show_plot
Whether to show the plot. Default is
FALSE.- save_plot
Whether to save plots to files. Default is
FALSE.- plot_format
Format for saved plots:
"pdf","png", or"svg". Default is"pdf".- plot_dpi
Resolution (DPI) for saved plots. Default is
300.- plot_prefix
Prefix for saved plot filenames. Default is
"palantir".- dirpath
The directory to save the plots. Default is
"./".- backend
Backend used to compute Palantir.
"python"keeps the original Palantir workflow and remains the default."cpp"uses the C++ implementation and stores results insrt@misc$palantir. Default is"cpp".- return_seurat
Whether to return a Seurat object instead of an anndata object. Default is
TRUE.- verbose
Whether to print the message. Default is
TRUE.
Examples
data(pancreas_sub)
pancreas_sub <- standard_scop(pancreas_sub)
#> ℹ [2026-07-02 09:47:46] Start standard processing workflow...
#> ℹ [2026-07-02 09:47:47] Checking a list of <Seurat>...
#> ! [2026-07-02 09:47:47] Data 1/1 of the `srt_list` is "unknown"
#> ℹ [2026-07-02 09:47:47] Perform `NormalizeData()` with `normalization.method = 'LogNormalize'` on 1/1 of `srt_list`...
#> ℹ [2026-07-02 09:47:47] Perform `FindVariableFeatures()` on 1/1 of `srt_list`...
#> ℹ [2026-07-02 09:47:47] Use the separate HVF from `srt_list`
#> ℹ [2026-07-02 09:47:47] Number of available HVF: 2000
#> ℹ [2026-07-02 09:47:48] Finished check
#> ℹ [2026-07-02 09:47:48] Perform `ScaleData()`
#> ℹ [2026-07-02 09:47:48] Perform pca linear dimension reduction
#> ℹ [2026-07-02 09:47:48] Use stored estimated dimensions 1:23 for Standardpca
#> ℹ [2026-07-02 09:47:48] Perform `Seurat::FindClusters()` with `cluster_algorithm = 'louvain'` and `cluster_resolution = 0.6`
#> ℹ [2026-07-02 09:47:49] Reorder clusters...
#> ℹ [2026-07-02 09:47:49] Skip `log1p()` because `layer = data` is not "counts"
#> ℹ [2026-07-02 09:47:49] Perform umap nonlinear dimension reduction
#> ✔ [2026-07-02 09:47:55] Standard processing workflow completed
pancreas_sub <- RunPalantir(
pancreas_sub,
group.by = "SubCellType",
linear_reduction = "PCA",
nonlinear_reduction = "UMAP",
early_group = "Ductal",
terminal_groups = c("Alpha", "Beta", "Delta", "Epsilon")
)
#> ℹ [2026-07-02 09:47:55] Computing Palantir KNN graph with BiocNeighbors...
#> ✔ [2026-07-02 09:47:56] Palantir cpp backend completed
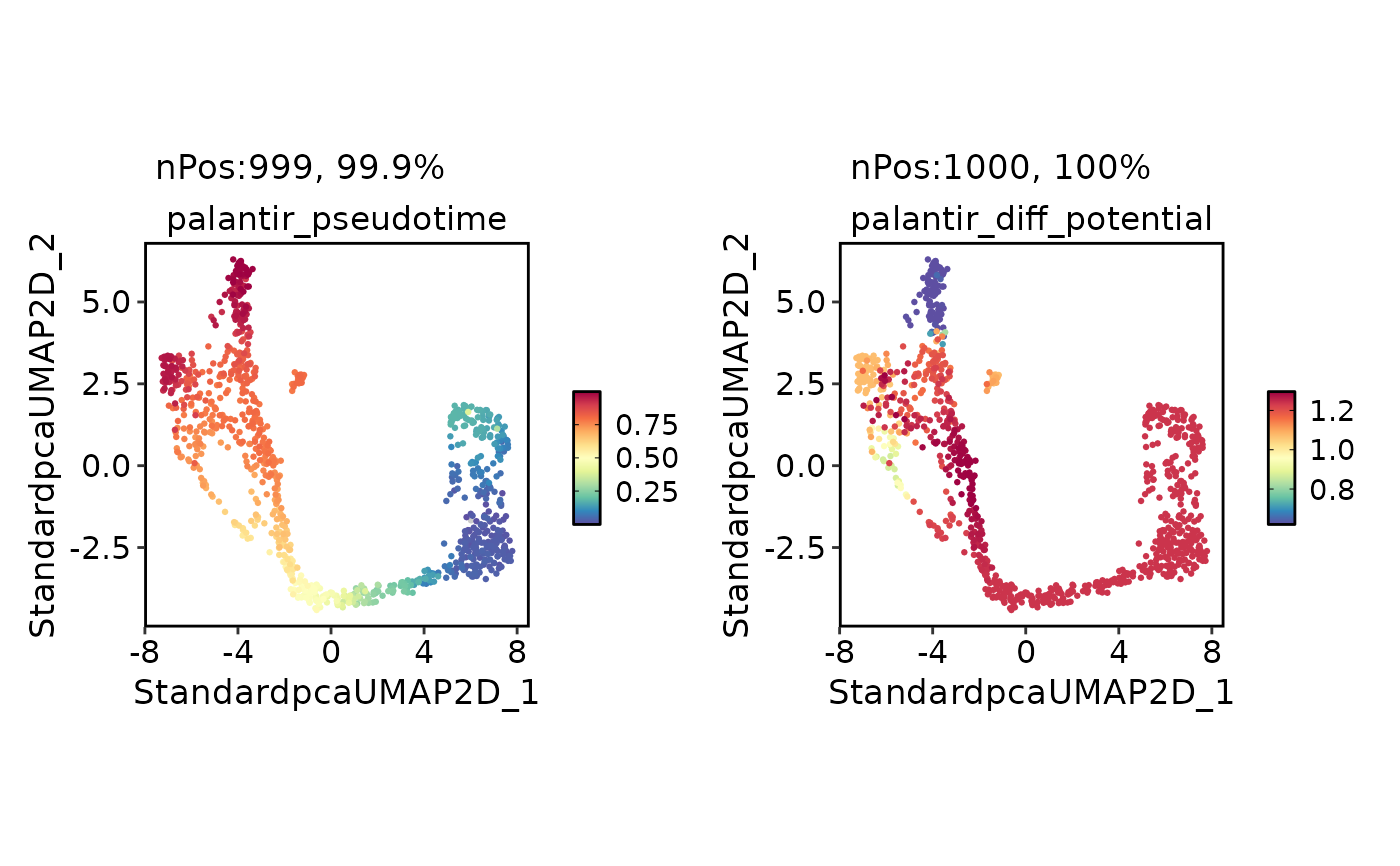
FeatureDimPlot(
pancreas_sub,
c("palantir_pseudotime", "palantir_diff_potential")
)
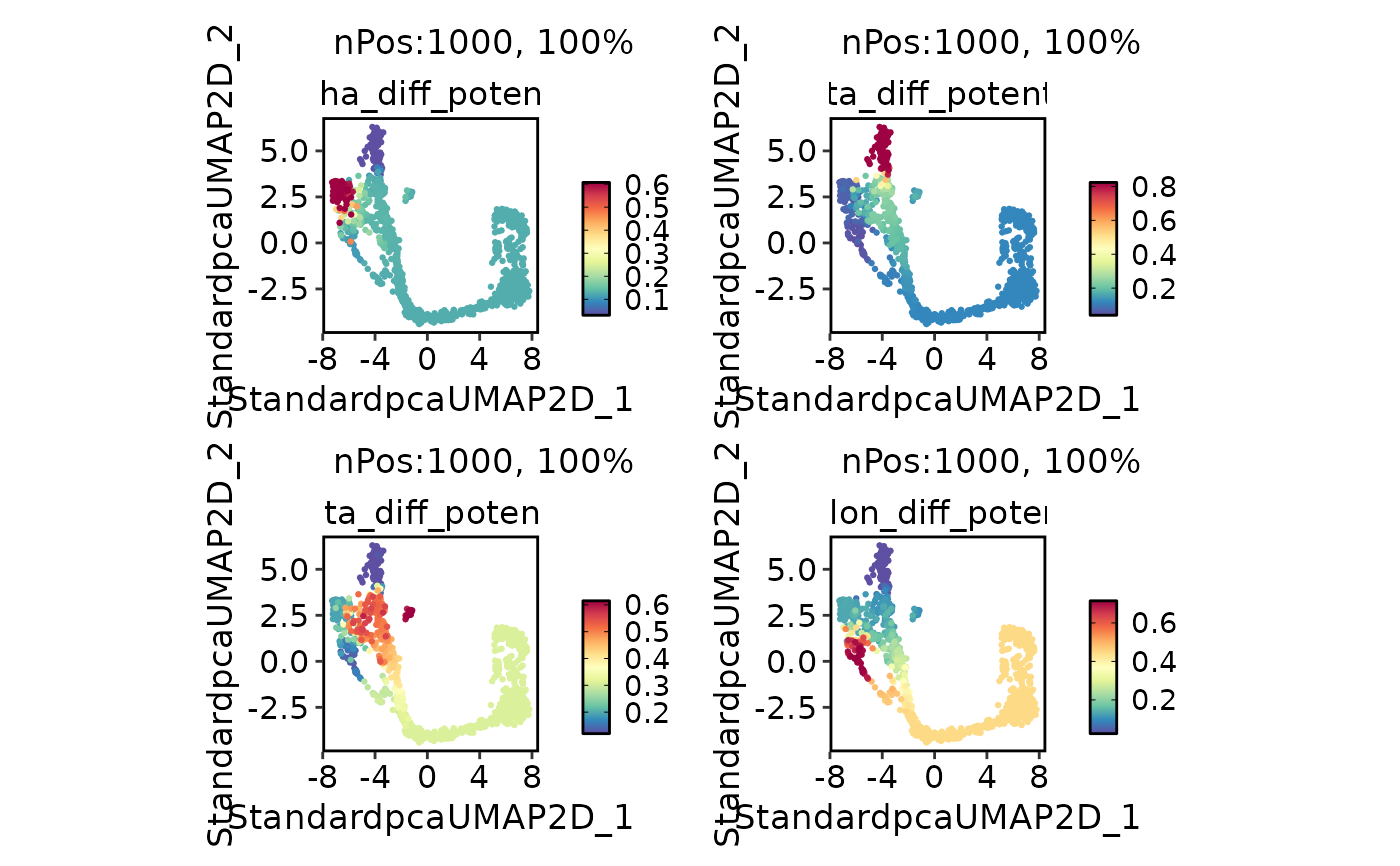
 FeatureDimPlot(
pancreas_sub,
grep(
"TerminalState_.*_diff_potential$",
colnames(pancreas_sub@meta.data),
value = TRUE
)
)
FeatureDimPlot(
pancreas_sub,
grep(
"TerminalState_.*_diff_potential$",
colnames(pancreas_sub@meta.data),
value = TRUE
)
)
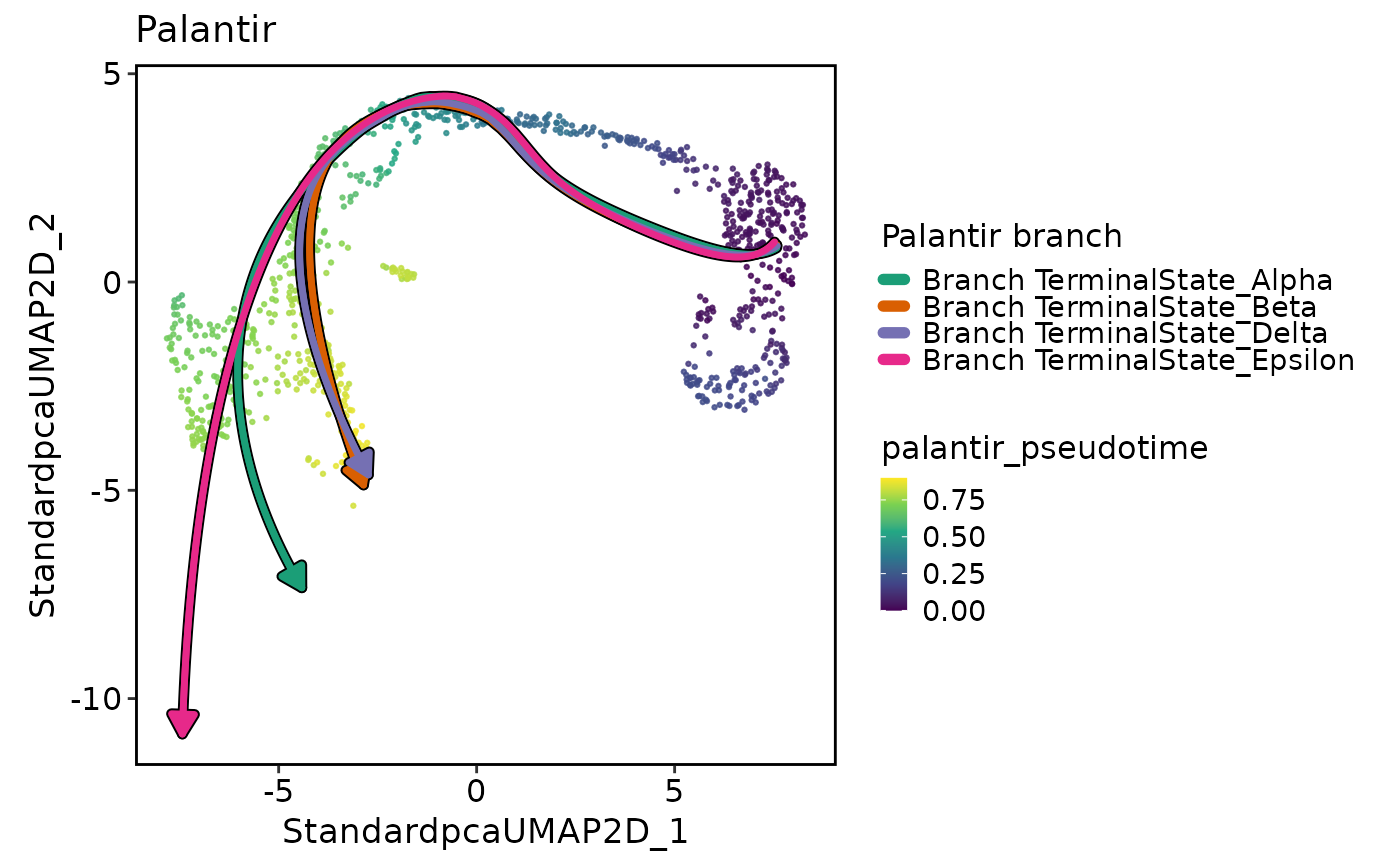
 PalantirTrajectoryPlot(
pancreas_sub,
reduction = "UMAP",
pseudotime_interval = c(0, 0.9)
)
PalantirTrajectoryPlot(
pancreas_sub,
reduction = "UMAP",
pseudotime_interval = c(0, 0.9)
)
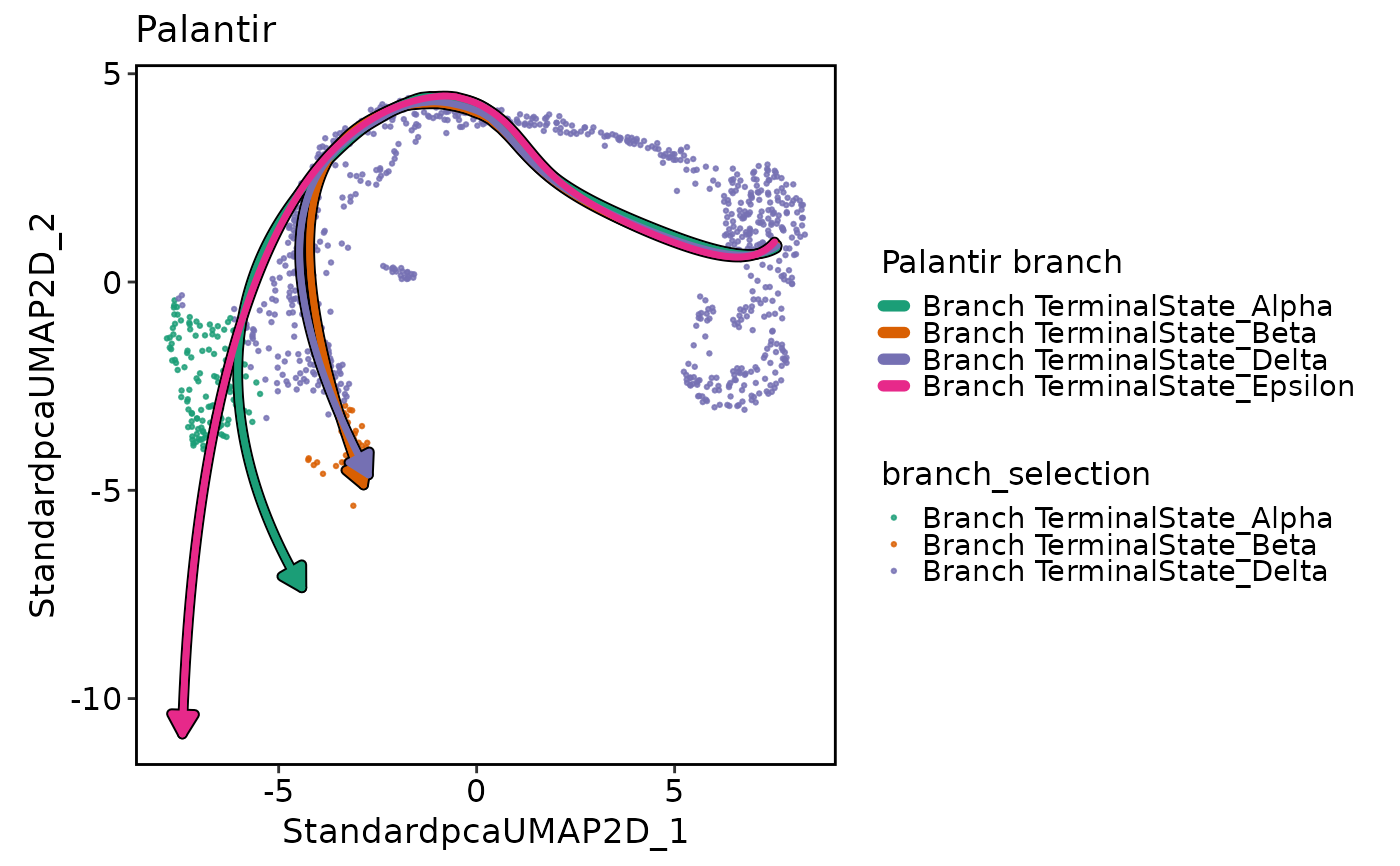
 PalantirTrajectoryPlot(
pancreas_sub,
reduction = "UMAP",
cell_color = "branch_selection",
pseudotime_interval = c(0, 0.9)
)
PalantirTrajectoryPlot(
pancreas_sub,
reduction = "UMAP",
cell_color = "branch_selection",
pseudotime_interval = c(0, 0.9)
)