Run transcription factor activity inference
Usage
RunDorothea(
  object,
  assay = NULL,
  layer = "data",
  species = c("Homo_sapiens", "Mus_musculus"),
  input_species = NULL,
  geneID_from_IDtype = "symbol",
  geneID_to_IDtype = "symbol",
  homolog_params = list(),
  confidence = c("A", "B", "C"),
  regulons = NULL,
  method = c("ulm", "viper", "wmean"),
  minsize = 5,
  options = list(),
  assay_name = "dorothea",
  new_assay = TRUE,
  add_meta = TRUE,
  verbose = TRUE,
  srt = NULL
)
Arguments
- object
A
Seuratobject.- assay
Assay to use.
NULLuses the default assay.- layer
Assay layer used as the expression matrix.
- species
Species used to select the regulatory network. The bundled DoRothEA and CollecTRI networks support human and mouse. For other input species, set
input_speciesand project expression values to this network species through homologous gene conversion before activity inference.- input_species
Species of the input expression features. If
NULL, the input is assumed to use the same gene namespace asspecies. When this differs fromspecies, expression features are converted with ConvertHomologs before DoRothEA activity inference.- geneID_from_IDtype, geneID_to_IDtype
Gene identifier types passed to ConvertHomologs for cross-species projection. For bundled DoRothEA regulons,
geneID_to_IDtypeshould normally remain"symbol".- homolog_params
Additional named arguments passed to ConvertHomologs when
input_speciesdiffers fromspecies, such asEnsembl_version,biomart,mirror,max_tries,multi_mapping, andcollapse_fun.- confidence
DoRothEA confidence levels to keep when a
confidencecolumn is present.- regulons
Regulon source.
NULLor"dorothea"loads the bundled DoRothEA network,"collectri"loads CollecTRI, and a data-frame-like object supplies a custom network. Custom networks may usetf,TF,source, orregulatorfor the regulator column,targetfor targets, andmor,importance, orweightfor edge weights.moris treated as signed regulation;importanceandweightare treated as non-negative unsigned weights.- method
Activity inference backend from
decoupleR.- minsize
Minimum regulon size passed to
decoupleR.- options
Additional named options passed to the selected
decoupleRfunction.- assay_name
Name of the assay used to store TF activity scores.
- new_assay
Whether to store TF activity scores as a new assay.
- add_meta
Whether to also write TF activity scores to
srt@meta.datawith theassay_nameprefix for direct plotting withFeatureDimPlot().- verbose
Whether to print the message. Default is
TRUE.- srt
Deprecated alias for
object; supply exactly one of the two. It will be removed in scop 1.0.0.
Value
A Seurat object with TF activity results stored in
srt@tools[["Dorothea"]], optionally TF activity scores stored in
srt@meta.data, and optionally a TF activity assay when
new_assay = TRUE. The normalized network is stored in
srt@tools[["Dorothea"]]$regulons, with the source and signedness recorded
in network_info. For cross-species runs, the homolog projection summary
is stored in srt@tools[["Dorothea"]]$homolog_conversion.
Details
RunGRN() returns a TF, target, and importance table that can be
supplied directly through regulons. Such a network is unsigned: its
scores describe target-program activity and do not distinguish activation
from repression. For signed TF activity, supply a network with a mor
column instead.
References
Garcia-Alonso, L., Holland, C.H., Ibrahim, M.M., Turei, D., and Saez-Rodriguez, J. (2019). Benchmark and integration of resources for the estimation of human transcription factor activities. Genome Research, 29, 1363-1375. doi:10.1101/gr.240663.118
Badia-i-Mompel, P., Velez Santiago, J., Braunger, J., Geiss, C., Dimitrov, D., Muller-Dott, S., Taus, P., Dugourd, A., Holland, C.H., Ramirez Flores, R.O., and Saez-Rodriguez, J. (2022). decoupleR: ensemble of computational methods to infer biological activities from omics data. Bioinformatics Advances, 2, vbac016. doi:10.1093/bioadv/vbac016
Examples
data(pancreas_sub)
pancreas_sub <- RunStandardWorkflow(
pancreas_sub,
verbose = FALSE
)
#> ℹ [2026-10-11 23:14:44] Skip `log1p()` because `layer = data` is not "counts"
pancreas_sub <- RunDorothea(
pancreas_sub,
layer = "counts",
species = "Mus_musculus",
confidence = c("A", "B", "C"),
method = "ulm",
minsize = 5
)
#> ℹ [2026-10-11 23:14:51] Run "DoRothEA"/decoupleR with 12895 regulon edges
#> ℹ [2026-10-11 23:15:01] "DoRothEA" TF activity scores stored in assay "dorothea"
#> ℹ [2026-10-11 23:15:02] "DoRothEA" TF activity scores stored in <Seurat> metadata
pancreas_sub@tools$Dorothea$regulon_summary
#> n_tfs n_targets n_edges confidence
#> 1 273 5130 12895 A,B,C
head(pancreas_sub@tools$Dorothea$result)
#> statistic source condition score p_value
#> 1 ulm Ar AAACCTGAGCCTTGAT 1.9230738 0.0544885134
#> 2 ulm Ar AAACCTGGTAAGTGGC 3.8375556 0.0001247429
#> 3 ulm Ar AAACGGGAGATATGGT 2.3175899 0.0204841737
#> 4 ulm Ar AAACGGGCAAAGAATC 0.9565534 0.3388071679
#> 5 ulm Ar AAACGGGGTACAGTTC 0.6864447 0.4924426684
#> 6 ulm Ar AAACGGGTCAGCTCTC 1.0246312 0.3055527415
tf_use <- intersect(
c("Sox9", "Neurod1", "Pdx1", "Foxa2"),
rownames(pancreas_sub@tools$Dorothea$scores)
)
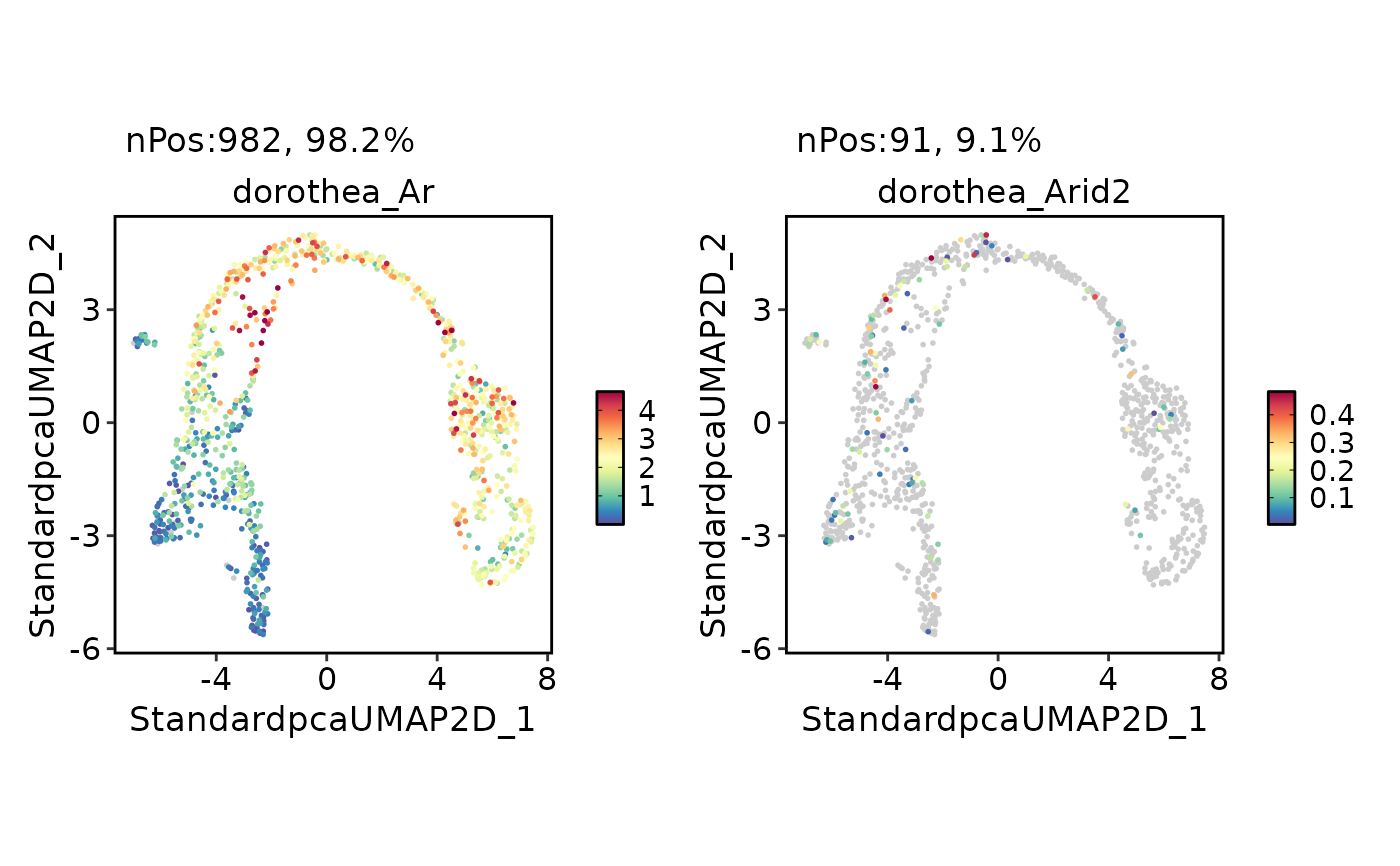
FeatureDimPlot(
pancreas_sub,
assay = "dorothea",
features = tf_use,
ncol = 2
)
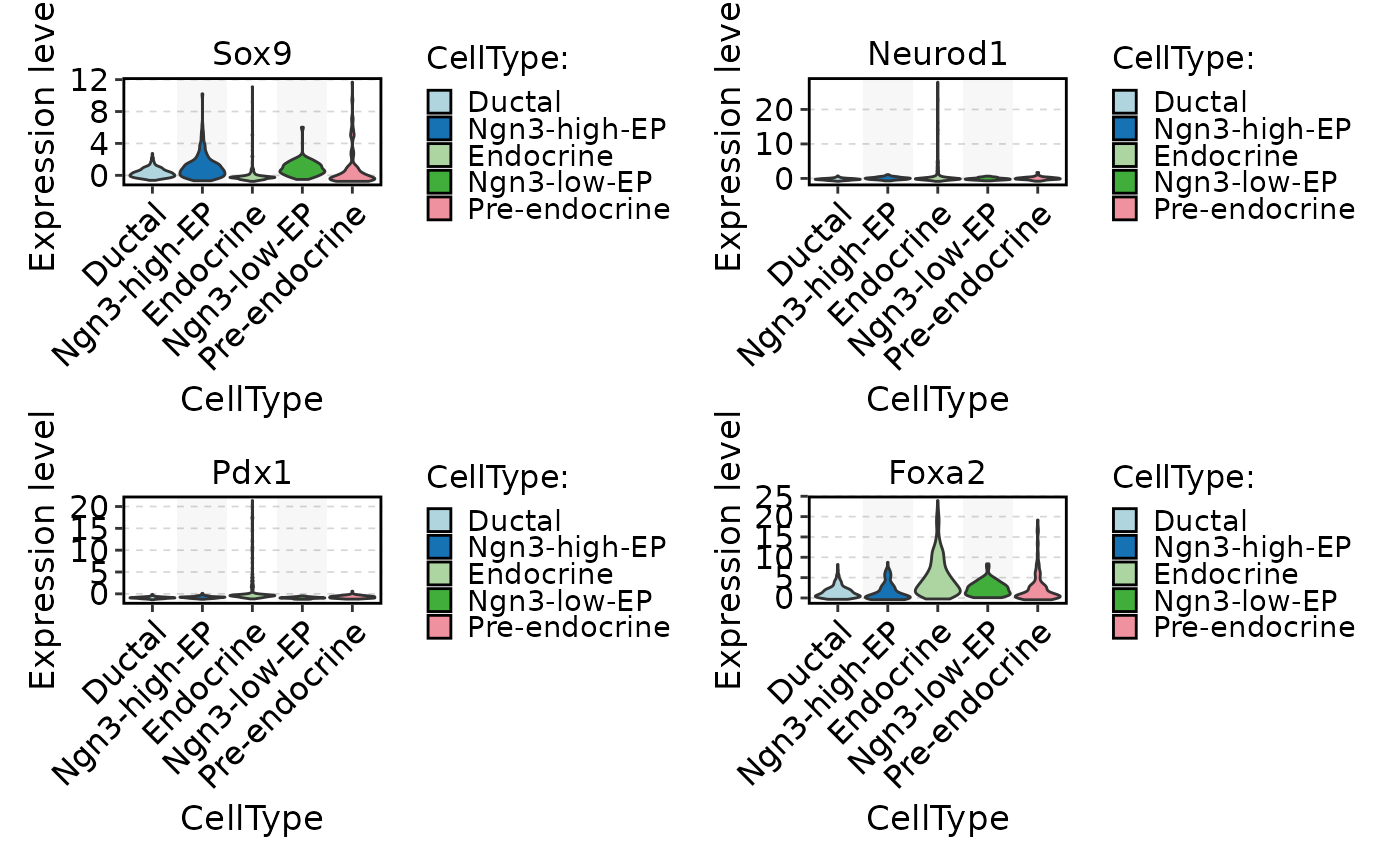
 FeatureStatPlot(
pancreas_sub,
assay = "dorothea",
stat.by = tf_use,
group.by = "CellType",
plot_type = "violin"
)
FeatureStatPlot(
pancreas_sub,
assay = "dorothea",
stat.by = tf_use,
group.by = "CellType",
plot_type = "violin"
)
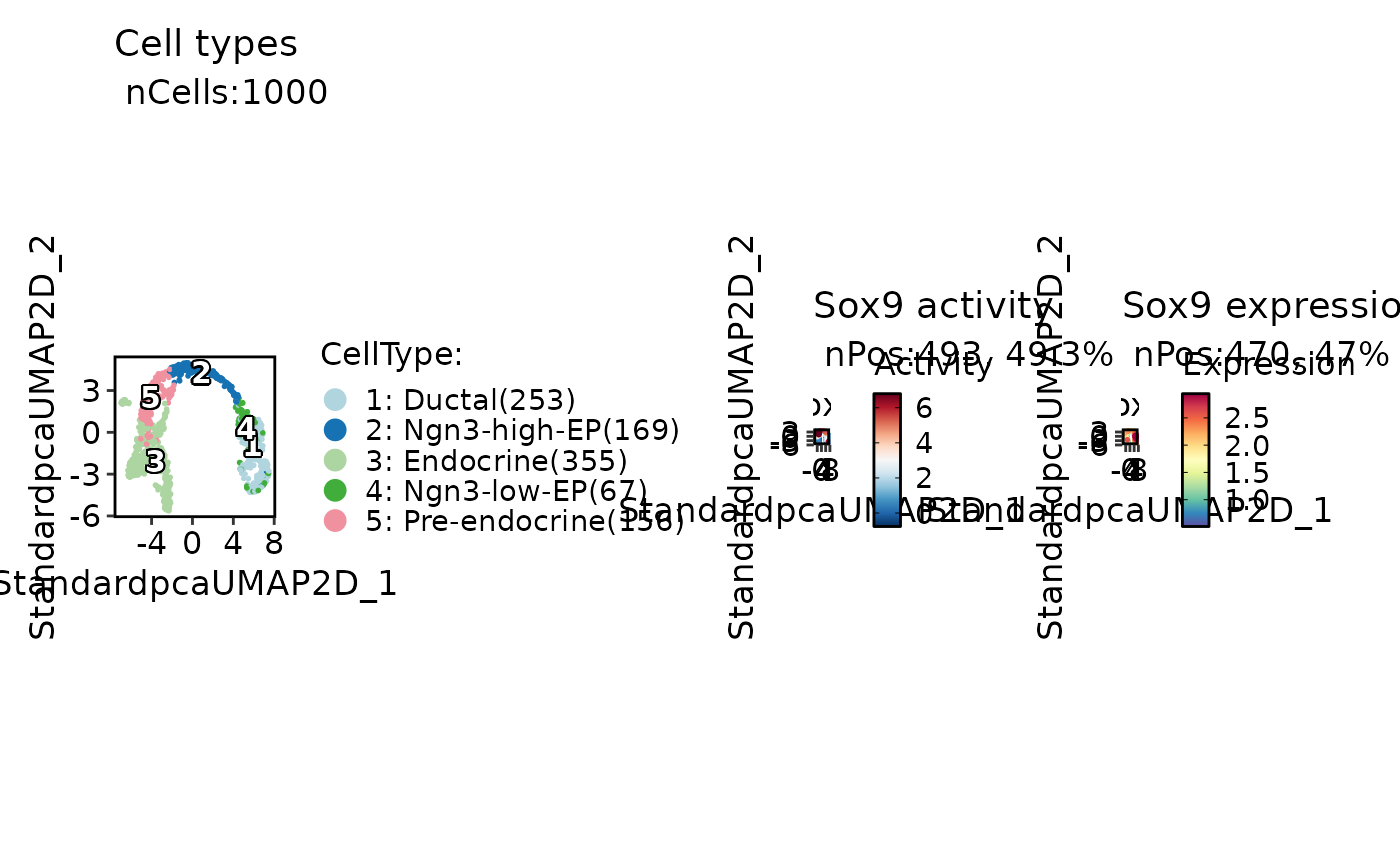
 DorotheaPlot(
pancreas_sub,
group.by = "CellType",
features = "Sox9",
plot_type = "dim"
)
#> ℹ [2026-10-11 23:15:04] Draw "DoRothEA" embedding plots for 1 TFs
DorotheaPlot(
pancreas_sub,
group.by = "CellType",
features = "Sox9",
plot_type = "dim"
)
#> ℹ [2026-10-11 23:15:04] Draw "DoRothEA" embedding plots for 1 TFs
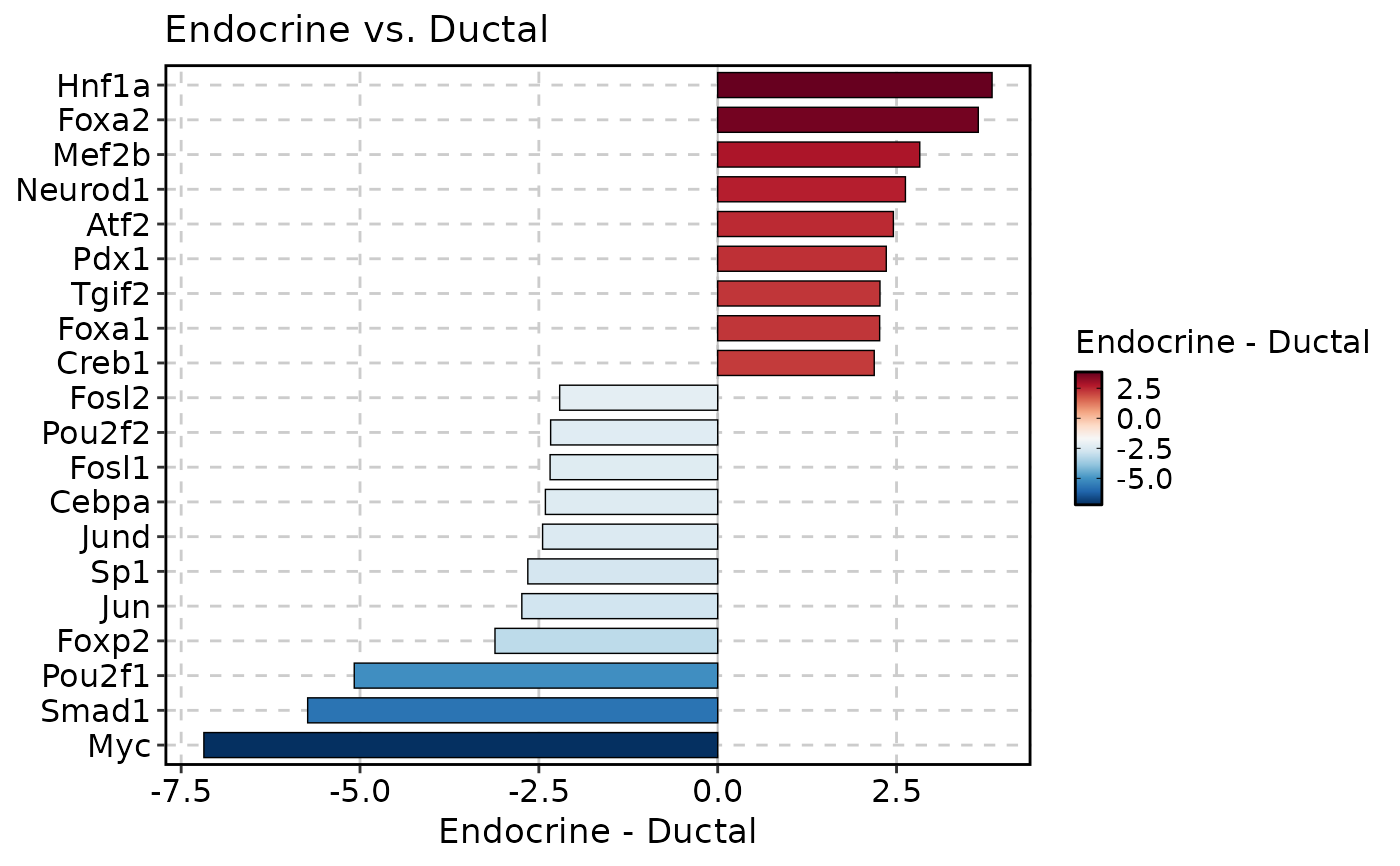
 DorotheaPlot(
pancreas_sub,
group.by = "CellType",
group1 = "Endocrine",
group2 = "Ductal",
plot_type = "bar",
top_n = 20
)
#> ℹ [2026-10-11 23:15:04] Compare "DoRothEA" TF activity: "Endocrine" vs "Ductal"
DorotheaPlot(
pancreas_sub,
group.by = "CellType",
group1 = "Endocrine",
group2 = "Ductal",
plot_type = "bar",
top_n = 20
)
#> ℹ [2026-10-11 23:15:04] Compare "DoRothEA" TF activity: "Endocrine" vs "Ductal"
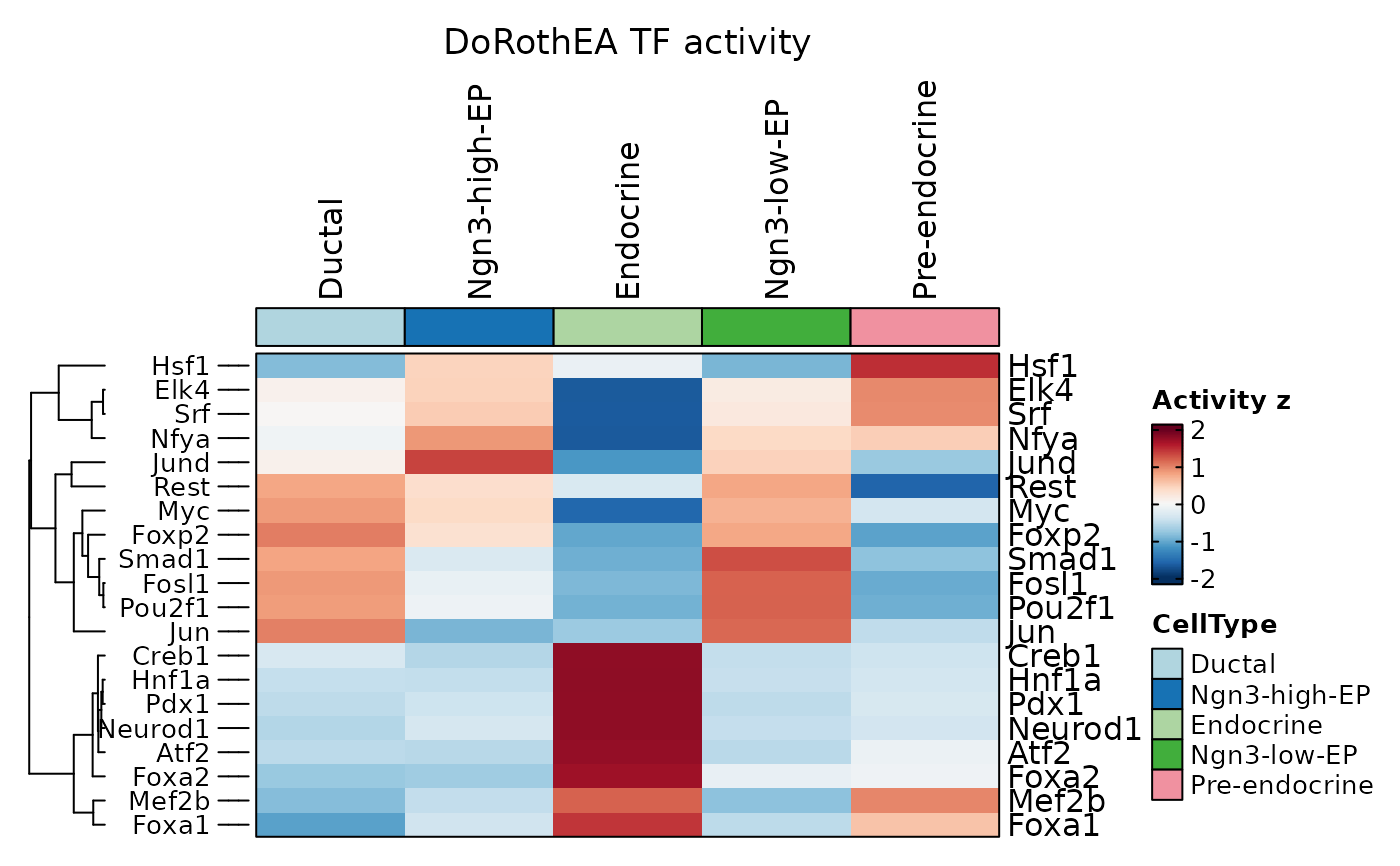
 ht <- DorotheaPlot(
pancreas_sub,
group.by = "CellType",
plot_type = "heatmap",
top_n = 20
)
#> ℹ [2026-10-11 23:15:05] Draw "DoRothEA" TF activity heatmap for 20 TFs
ht$plot
ht <- DorotheaPlot(
pancreas_sub,
group.by = "CellType",
plot_type = "heatmap",
top_n = 20
)
#> ℹ [2026-10-11 23:15:05] Draw "DoRothEA" TF activity heatmap for 20 TFs
ht$plot
 DorotheaPlot(
pancreas_sub,
group.by = "CellType",
group1 = "Endocrine",
group2 = "Ductal",
features = "Sox9",
plot_type = "targets"
)
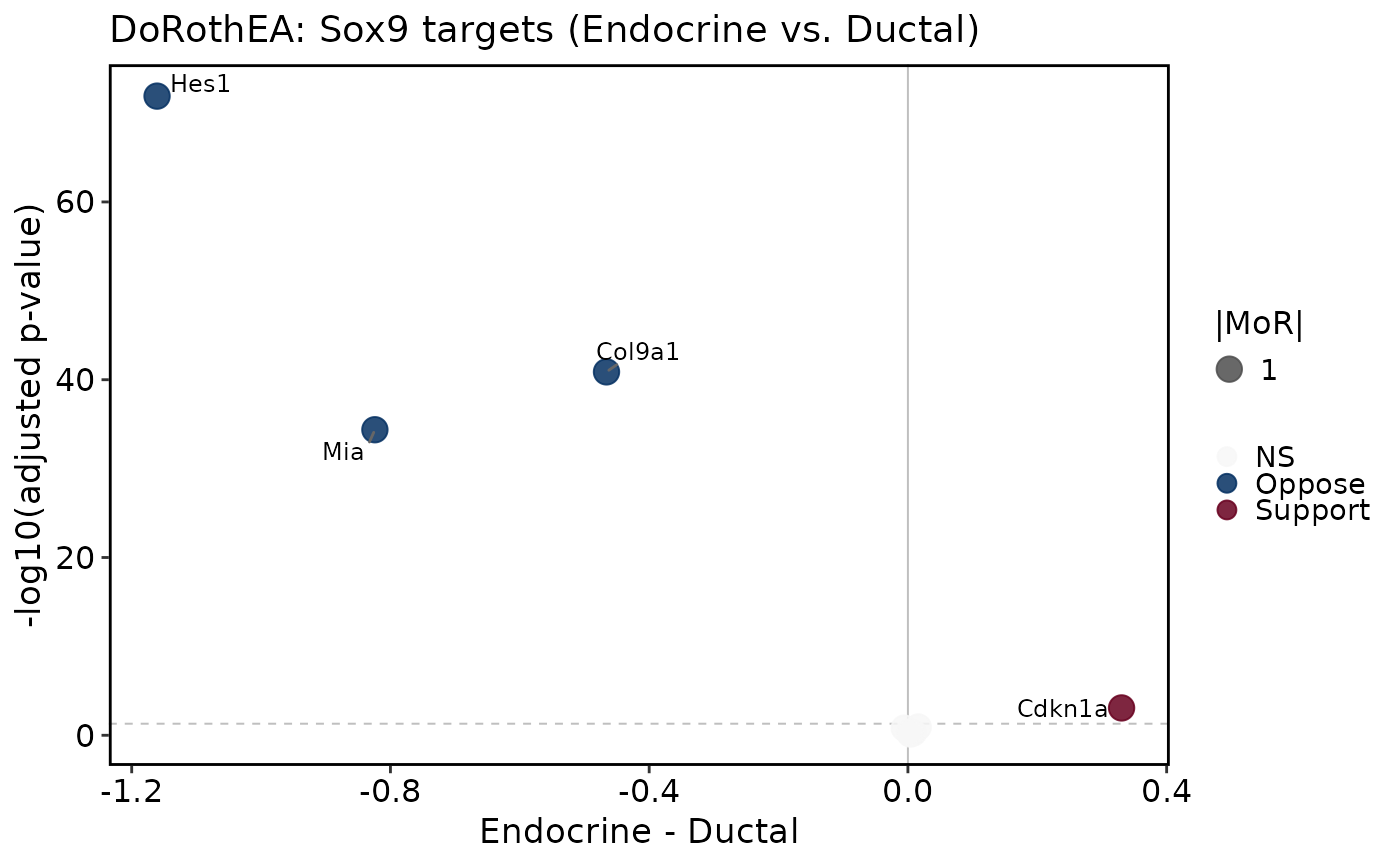
#> ! [2026-10-11 23:15:05] Dropping 3 "Sox9" targets missing from assay "RNA"
#> ℹ [2026-10-11 23:15:05] Draw "DoRothEA" regulon-target volcano for "Sox9" (10 targets)
DorotheaPlot(
pancreas_sub,
group.by = "CellType",
group1 = "Endocrine",
group2 = "Ductal",
features = "Sox9",
plot_type = "targets"
)
#> ! [2026-10-11 23:15:05] Dropping 3 "Sox9" targets missing from assay "RNA"
#> ℹ [2026-10-11 23:15:05] Draw "DoRothEA" regulon-target volcano for "Sox9" (10 targets)
 # A RunGRN-compatible unsigned network can be passed directly.
grn_targets <- head(rownames(pancreas_sub), 5)
grn_edges <- data.frame(
TF = rep("ExampleTF", length(grn_targets)),
target = grn_targets,
importance = seq_along(grn_targets) / length(grn_targets)
)
pancreas_sub <- RunDorothea(
pancreas_sub,
regulons = grn_edges,
species = "Mus_musculus",
minsize = 1,
new_assay = FALSE,
add_meta = FALSE,
verbose = FALSE
)
#> ℹ [2026-10-11 23:15:05] The supplied network is unsigned; "importance" is used as positive edge weight. Scores represent target-program activity, not signed TF activation or repression.
pancreas_sub@tools$Dorothea$network_info
#> $source
#> [1] "custom"
#>
#> $label
#> [1] "custom TF network"
#>
#> $format
#> [1] "scop_grn"
#>
#> $signed
#> [1] FALSE
#>
#> $regulator_column
#> [1] "TF"
#>
#> $target_column
#> [1] "target"
#>
#> $weight_column
#> [1] "importance"
#>
#> $weight_semantics
#> [1] "unsigned_positive_weight"
#>
#> $species
#> [1] "Mus_musculus"
#>
#> $input_species
#> [1] "Mus_musculus"
#>
# A real RunGRN result can be connected in the same way:
# grn <- RunGRN(pancreas_sub, grn_method = "genie3")
# pancreas_sub <- RunDorothea(pancreas_sub, regulons = grn)
if (FALSE) { # \dontrun{
pancreas_sub <- RunDorothea(
pancreas_sub,
regulons = "collectri",
species = "Mus_musculus",
minsize = 5
)
} # }
# A RunGRN-compatible unsigned network can be passed directly.
grn_targets <- head(rownames(pancreas_sub), 5)
grn_edges <- data.frame(
TF = rep("ExampleTF", length(grn_targets)),
target = grn_targets,
importance = seq_along(grn_targets) / length(grn_targets)
)
pancreas_sub <- RunDorothea(
pancreas_sub,
regulons = grn_edges,
species = "Mus_musculus",
minsize = 1,
new_assay = FALSE,
add_meta = FALSE,
verbose = FALSE
)
#> ℹ [2026-10-11 23:15:05] The supplied network is unsigned; "importance" is used as positive edge weight. Scores represent target-program activity, not signed TF activation or repression.
pancreas_sub@tools$Dorothea$network_info
#> $source
#> [1] "custom"
#>
#> $label
#> [1] "custom TF network"
#>
#> $format
#> [1] "scop_grn"
#>
#> $signed
#> [1] FALSE
#>
#> $regulator_column
#> [1] "TF"
#>
#> $target_column
#> [1] "target"
#>
#> $weight_column
#> [1] "importance"
#>
#> $weight_semantics
#> [1] "unsigned_positive_weight"
#>
#> $species
#> [1] "Mus_musculus"
#>
#> $input_species
#> [1] "Mus_musculus"
#>
# A real RunGRN result can be connected in the same way:
# grn <- RunGRN(pancreas_sub, grn_method = "genie3")
# pancreas_sub <- RunDorothea(pancreas_sub, regulons = grn)
if (FALSE) { # \dontrun{
pancreas_sub <- RunDorothea(
pancreas_sub,
regulons = "collectri",
species = "Mus_musculus",
minsize = 5
)
} # }