This function creates a correlation plot to visualize the pairwise correlations between selected features in a Seurat object.
Usage
FeatureCorPlot(
  srt,
  features,
  group.by = NULL,
  split.by = NULL,
  cells = NULL,
  layer = "data",
  assay = NULL,
  cor_method = "pearson",
  adjust = 1,
  margin = 1,
  reverse = FALSE,
  add_equation = FALSE,
  add_r2 = TRUE,
  add_pvalue = TRUE,
  add_smooth = TRUE,
  palette = "Chinese",
  palcolor = NULL,
  cor_palette = "RdBu",
  cor_palcolor = NULL,
  cor_range = c(-1, 1),
  pt.size = NULL,
  pt.alpha = 1,
  cells.highlight = NULL,
  cols.highlight = "black",
  sizes.highlight = 1,
  alpha.highlight = 1,
  stroke.highlight = 0.5,
  calculate_coexp = FALSE,
  raster = NULL,
  raster.dpi = c(512, 512),
  aspect.ratio = 1,
  title = NULL,
  subtitle = NULL,
  legend.position = "right",
  legend.direction = "vertical",
  theme_use = "theme_scop",
  theme_args = list(),
  combine = TRUE,
  nrow = NULL,
  ncol = NULL,
  byrow = TRUE,
  force = FALSE,
  seed = 11,
  verbose = TRUE
)
Arguments
- srt
A Seurat object.
- features
A character vector specifying the features to compare. Should be present in both the assay data and the metadata of the Seurat object.
- group.by
Name of one or more meta.data columns to group (color) cells by.
- split.by
Name of a column in meta.data column to split plot by. Default is
NULL.- cells
A character vector of cell names to use.
- layer
Which layer to use. Default is
data.- assay
Which assay to use. If
NULL, the default assay of the Seurat object will be used. When the object also containsChromatinAssay, the default assay and additionalChromatinAssaywill be preprocessed sequentially.- cor_method
A character string specifying the correlation method to use. Can be
"pearson"or"spearman". Default is"pearson".- adjust
The adjustment factor for the width of the violin plots. Default is
1.- margin
The margin size for the plot. Default is
1.- reverse
Whether to reverse the order of the features in the plot. Default is
FALSE.- add_equation
Whether to add the equation of the linear regression line to each scatter plot. Default is
FALSE.- add_r2
Whether to add the R-squared value of the linear regression line to each scatter plot. Default is
TRUE.- add_pvalue
Whether to add the p-value of the linear regression line to each scatter plot. Default is
TRUE.- add_smooth
Whether to add a smoothed line to each scatter plot. Default is
TRUE.- palette
Color palette name. Available palettes can be found in thisplot::show_palettes. Default is
"Chinese".- palcolor
Custom colors used to create a color palette. Default is
NULL.- cor_palette
A character string specifying the name of the color palette to use for the correlation. Default is
"RdBu".- cor_palcolor
A character string specifying the color for the correlation. Default is
"RdBu".- cor_range
A two-length numeric vector specifying the range for the correlation.
- pt.size
The size of the points in the plot.
- pt.alpha
The transparency of the data points. Default is
1.- cells.highlight
A logical or character vector specifying the cells to highlight in the plot. If
TRUE, all cells are highlighted. IfFALSE, no cells are highlighted. Default isNULL.- cols.highlight
Color used to highlight the cells.
- sizes.highlight
Size of highlighted cell points.
- alpha.highlight
Transparency of highlighted cell points.
- stroke.highlight
Border width of highlighted cell points.
- calculate_coexp
Whether to calculate the co-expression of selected features. Default is
FALSE.- raster
Convert points to raster format. Default is
NULL, which automatically rasterizes if plotting more than 100,000 cells.- raster.dpi
Pixel resolution for rasterized plots. Default is
c(512, 512).- aspect.ratio
Aspect ratio of the panel. Default is
1.- title
The text for the title. Default is
NULL.- subtitle
The text for the subtitle for the plot which will be displayed below the title. Default is
NULL.- legend.position
The position of legends, one of
"none","left","right","bottom","top". Default is"right".- legend.direction
The direction of the legend in the plot. Can be one of
"vertical"or"horizontal".- theme_use
Theme used. Can be a character string or a theme function. Default is
"theme_scop".- theme_args
Other arguments passed to the
theme_use. Default islist().- combine
Combine plots into a single
patchworkobject. IfFALSE, return a list of ggplot objects.- nrow
Number of rows in the combined plot. Default is
NULL, which means determined automatically based on the number of plots.- ncol
Number of columns in the combined plot. Default is
NULL, which means determined automatically based on the number of plots.- byrow
Whether to arrange the plots by row in the combined plot. Default is
TRUE.- force
Whether to force the creation of the plot, even if it contains more than 50 subplots. Default is
FALSE.- seed
Random seed for reproducibility. Default is
11.- verbose
Whether to print the message. Default is
TRUE.
Examples
data(pancreas_sub)
pancreas_sub <- standard_scop(pancreas_sub)
#> ℹ [2026-07-02 09:00:47] Start standard processing workflow...
#> ℹ [2026-07-02 09:00:48] Checking a list of <Seurat>...
#> ! [2026-07-02 09:00:48] Data 1/1 of the `srt_list` is "unknown"
#> ℹ [2026-07-02 09:00:48] Perform `NormalizeData()` with `normalization.method = 'LogNormalize'` on 1/1 of `srt_list`...
#> ℹ [2026-07-02 09:00:48] Perform `FindVariableFeatures()` on 1/1 of `srt_list`...
#> ℹ [2026-07-02 09:00:48] Use the separate HVF from `srt_list`
#> ℹ [2026-07-02 09:00:48] Number of available HVF: 2000
#> ℹ [2026-07-02 09:00:48] Finished check
#> ℹ [2026-07-02 09:00:48] Perform `ScaleData()`
#> ℹ [2026-07-02 09:00:48] Perform pca linear dimension reduction
#> ℹ [2026-07-02 09:00:49] Use stored estimated dimensions 1:23 for Standardpca
#> ℹ [2026-07-02 09:00:49] Perform `Seurat::FindClusters()` with `cluster_algorithm = 'louvain'` and `cluster_resolution = 0.6`
#> ℹ [2026-07-02 09:00:49] Reorder clusters...
#> ℹ [2026-07-02 09:00:49] Skip `log1p()` because `layer = data` is not "counts"
#> ℹ [2026-07-02 09:00:49] Perform umap nonlinear dimension reduction
#> ✔ [2026-07-02 09:00:55] Standard processing workflow completed
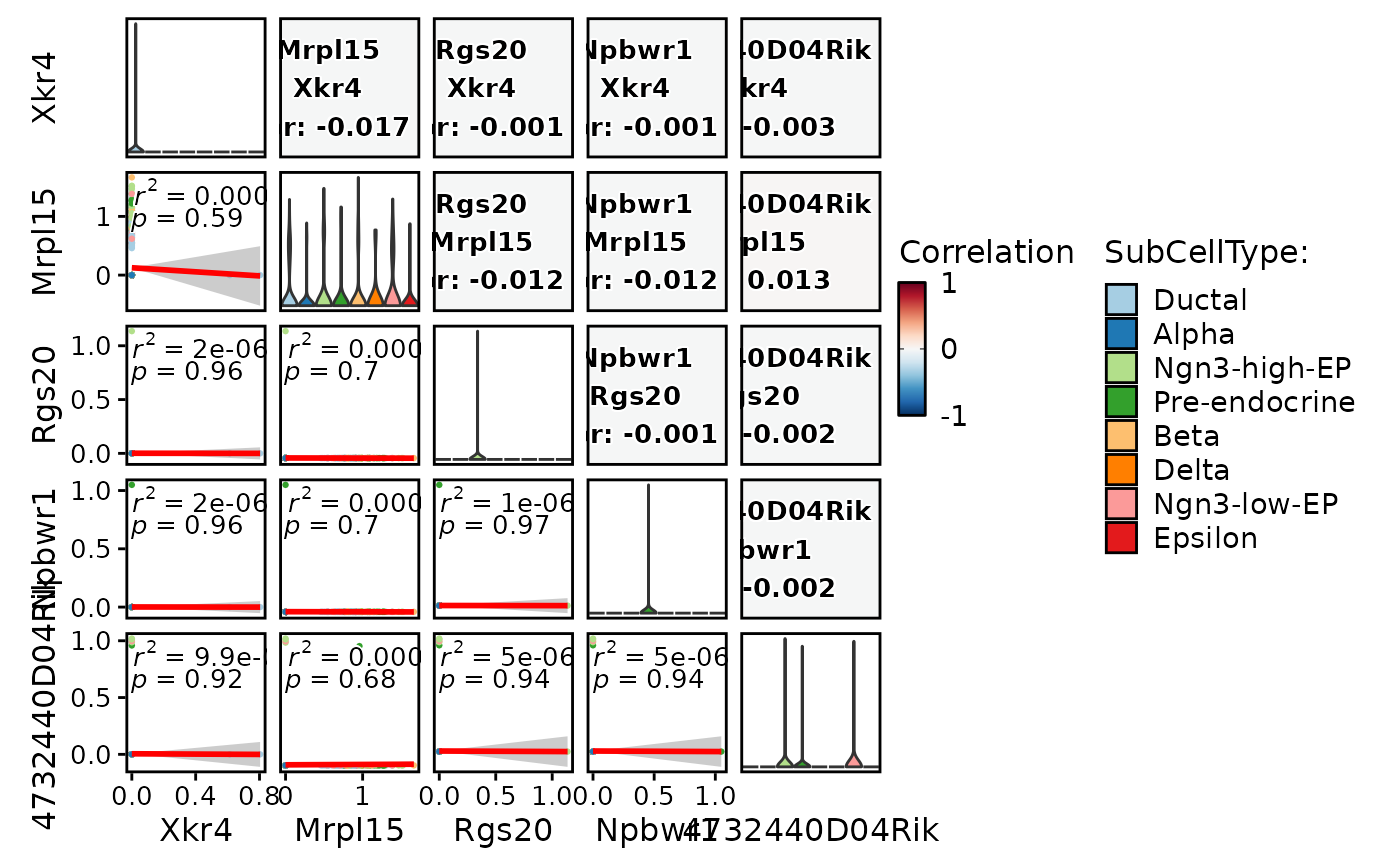
FeatureCorPlot(
pancreas_sub,
features = rownames(pancreas_sub)[1:5],
group.by = "SubCellType"
)
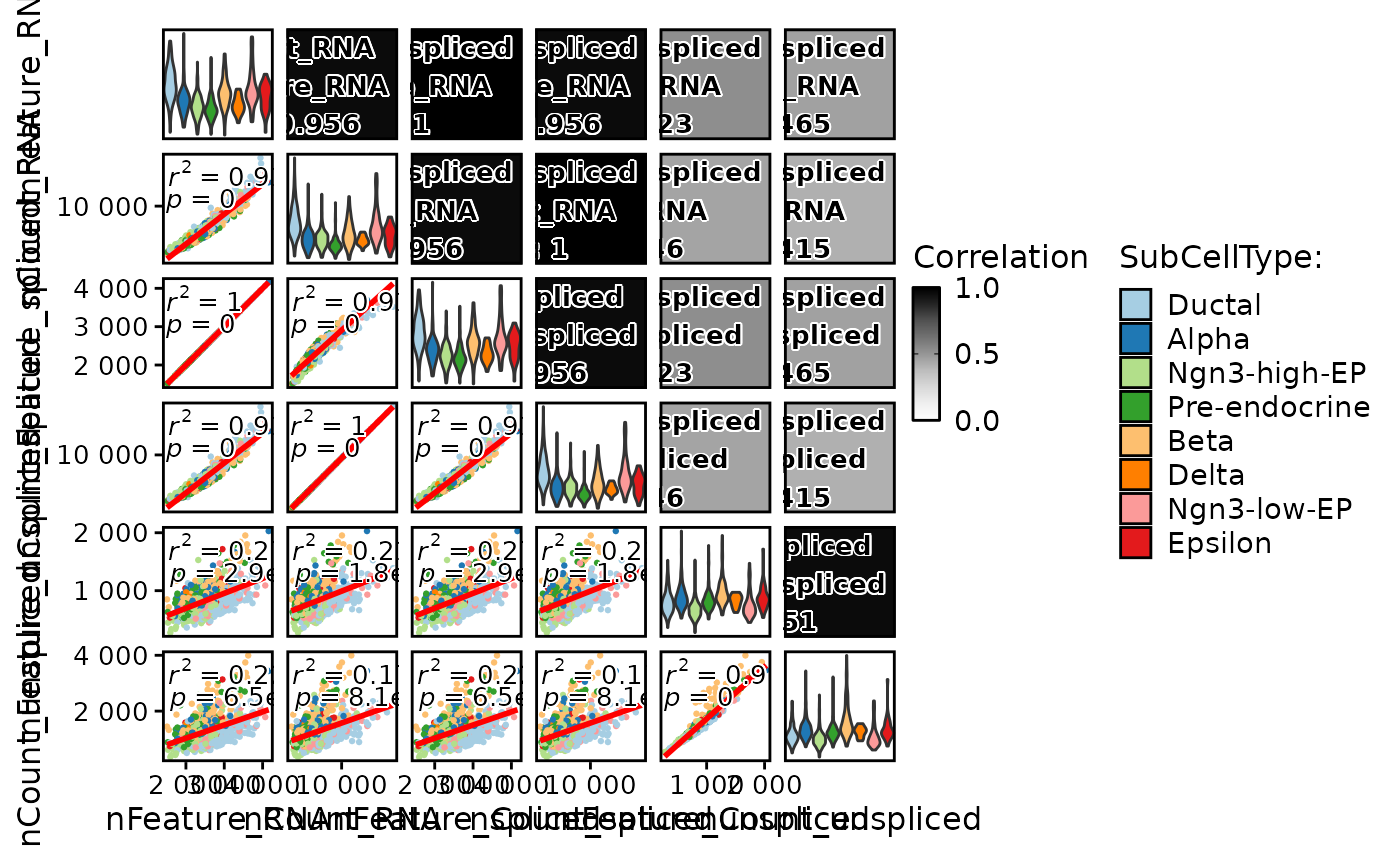
 FeatureCorPlot(
pancreas_sub,
features = c(
"nFeature_RNA",
"nCount_RNA",
"nFeature_spliced",
"nCount_spliced",
"nFeature_unspliced",
"nCount_unspliced"
),
group.by = "SubCellType",
cor_palette = "Greys",
cor_range = c(0, 1)
)
#> Warning: essentially perfect fit: summary may be unreliable
#> Warning: essentially perfect fit: summary may be unreliable
#> Warning: essentially perfect fit: summary may be unreliable
#> Warning: essentially perfect fit: summary may be unreliable
FeatureCorPlot(
pancreas_sub,
features = c(
"nFeature_RNA",
"nCount_RNA",
"nFeature_spliced",
"nCount_spliced",
"nFeature_unspliced",
"nCount_unspliced"
),
group.by = "SubCellType",
cor_palette = "Greys",
cor_range = c(0, 1)
)
#> Warning: essentially perfect fit: summary may be unreliable
#> Warning: essentially perfect fit: summary may be unreliable
#> Warning: essentially perfect fit: summary may be unreliable
#> Warning: essentially perfect fit: summary may be unreliable
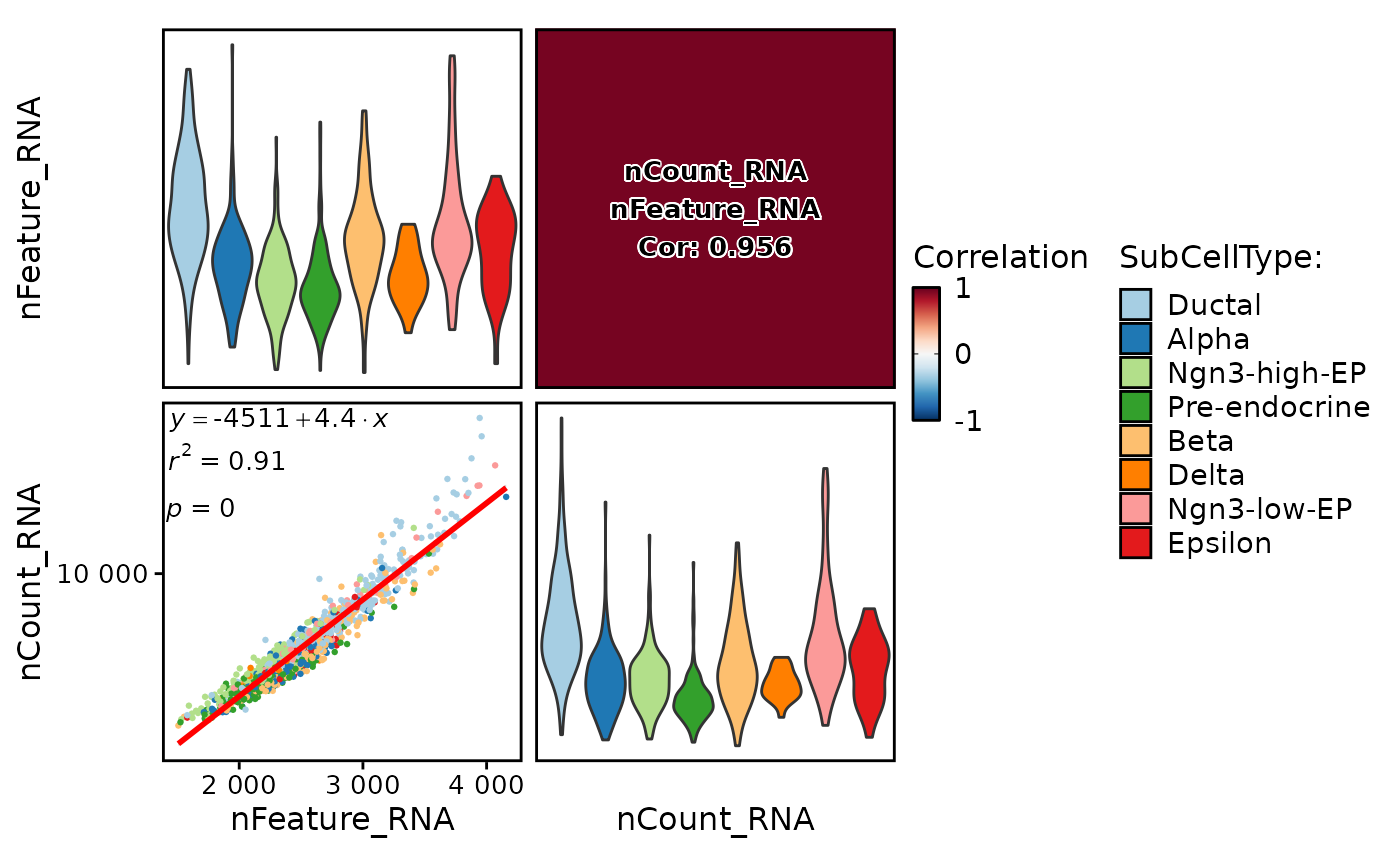
 FeatureCorPlot(
pancreas_sub,
features = c("nFeature_RNA", "nCount_RNA"),
group.by = "SubCellType",
add_equation = TRUE
)
FeatureCorPlot(
pancreas_sub,
features = c("nFeature_RNA", "nCount_RNA"),
group.by = "SubCellType",
add_equation = TRUE
)