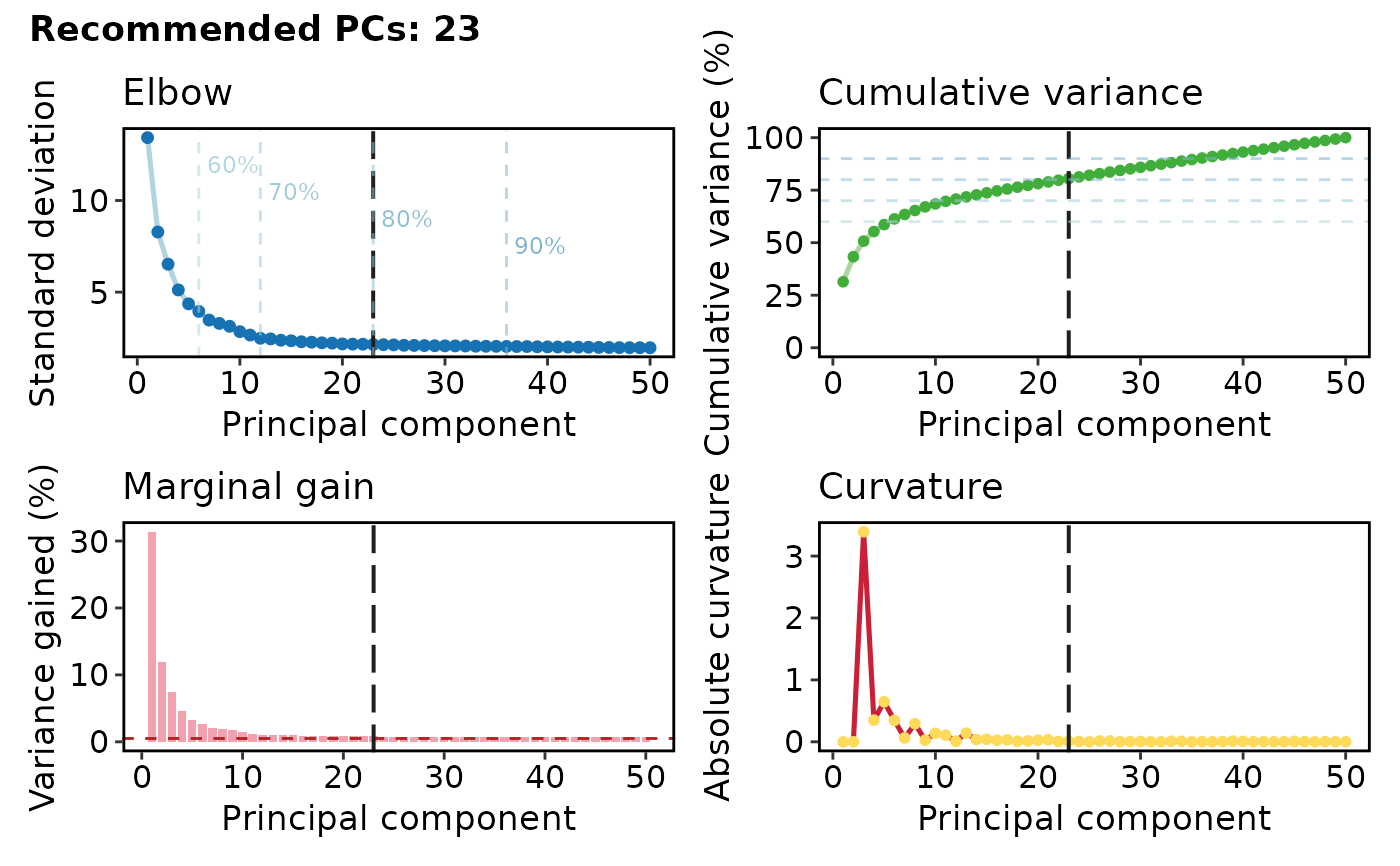
Dimension estimate diagnostic plot
Usage
DimsEstimatePlot(
  srt,
  max_pcs = 50,
  variance_thresholds = c(0.6, 0.7, 0.8, 0.9),
  reduction = NULL,
  palette = "Chinese",
  palcolor = NULL,
  aspect.ratio = NULL,
  title = NULL,
  subtitle = NULL,
  xlab = "Principal component",
  theme_use = "theme_scop",
  theme_args = list(),
  combine = TRUE,
  nrow = NULL,
  ncol = NULL,
  seed = 11,
  verbose = TRUE
)
Arguments
- srt
A
Seuratobject with a PCA-like reduction computed.- max_pcs
Maximum number of PCs to visualize. Default is
50.- variance_thresholds
Numeric vector of variance thresholds to mark. Default is
c(0.60, 0.70, 0.80, 0.90).- reduction
Reduction name to inspect. Default is
NULL, which automatically selects a PCA-like reduction viaDefaultReduction()withpattern = "pca".- palette
Palette used for the main curves. Default is
"Chinese".- palcolor
Optional palette colors.
- aspect.ratio
Aspect ratio of each panel. Default is
NULL.- title
Title for the combined plot. When
NULL(default), an auto-generated summary line is used.- subtitle
Subtitle for the combined plot. Default is
NULL.- xlab
X-axis label shared by all panels. Default is
"Principal component".- theme_use
Theme function used to style the plot. Default is
"theme_scop".- theme_args
Other arguments passed to the
theme_use.- combine
Whether to combine the four panels into one plot. Default is
TRUE. WhenFALSE, returns a named list of ggplot objects.- nrow
Number of rows in the combined layout. Default is
NULL.- ncol
Number of columns in the combined layout. Default is
NULL- seed
Random seed. Default is
11.- verbose
Whether to print the message. Default is
TRUE.
Value
A patchwork plot object when combine = TRUE,
or a named list of ggplot objects when combine = FALSE.
Examples
data(pancreas_sub)
pancreas_sub <- standard_scop(pancreas_sub)
#> ℹ [2026-07-02 08:52:42] Start standard processing workflow...
#> ℹ [2026-07-02 08:52:43] Checking a list of <Seurat>...
#> ! [2026-07-02 08:52:43] Data 1/1 of the `srt_list` is "unknown"
#> ℹ [2026-07-02 08:52:43] Perform `NormalizeData()` with `normalization.method = 'LogNormalize'` on 1/1 of `srt_list`...
#> ℹ [2026-07-02 08:52:43] Perform `FindVariableFeatures()` on 1/1 of `srt_list`...
#> ℹ [2026-07-02 08:52:43] Use the separate HVF from `srt_list`
#> ℹ [2026-07-02 08:52:43] Number of available HVF: 2000
#> ℹ [2026-07-02 08:52:43] Finished check
#> ℹ [2026-07-02 08:52:43] Perform `ScaleData()`
#> ℹ [2026-07-02 08:52:43] Perform pca linear dimension reduction
#> ℹ [2026-07-02 08:52:44] Use stored estimated dimensions 1:23 for Standardpca
#> ℹ [2026-07-02 08:52:44] Perform `Seurat::FindClusters()` with `cluster_algorithm = 'louvain'` and `cluster_resolution = 0.6`
#> ℹ [2026-07-02 08:52:44] Reorder clusters...
#> ℹ [2026-07-02 08:52:44] Skip `log1p()` because `layer = data` is not "counts"
#> ℹ [2026-07-02 08:52:44] Perform umap nonlinear dimension reduction
#> ✔ [2026-07-02 08:52:49] Standard processing workflow completed
DimsEstimatePlot(pancreas_sub)