Visualize in-silico knockout results generated by RunscTenifoldKnk.
Usage
scTenifoldKnkPlot(
  srt,
  tool_name = "scTenifoldKnk",
  plot_type = c("qq", "effect", "network", "manifold"),
  top_n = 20,
  FDR_threshold = 0.05,
  FC_threshold = 1,
  features = NULL,
  label = TRUE,
  nlabel = 10,
  pt.size = 2,
  pt.alpha = 0.85,
  label.size = 3.5,
  edge_top_n = 100,
  edge_threshold = NULL,
  arrow.length = 0.14,
  arrow.linewidth = 0.8,
  arrow.alpha = 0.8,
  start.pt.size = 2.2,
  end.pt.size = 3,
  manifold.aspect.ratio = 1,
  cols.sig = "#D7301F",
  cols.ns = "grey70",
  cols.ko = "#542788",
  xlab = NULL,
  ylab = NULL,
  title = NULL,
  theme_use = "theme_scop",
  theme_args = list(),
  verbose = TRUE
)
Arguments
- srt
A Seurat object containing a scTenifoldKnk result in
srt@tools.- tool_name
Name of the
srt@toolsentry created by RunscTenifoldKnk.- plot_type
Plot type.
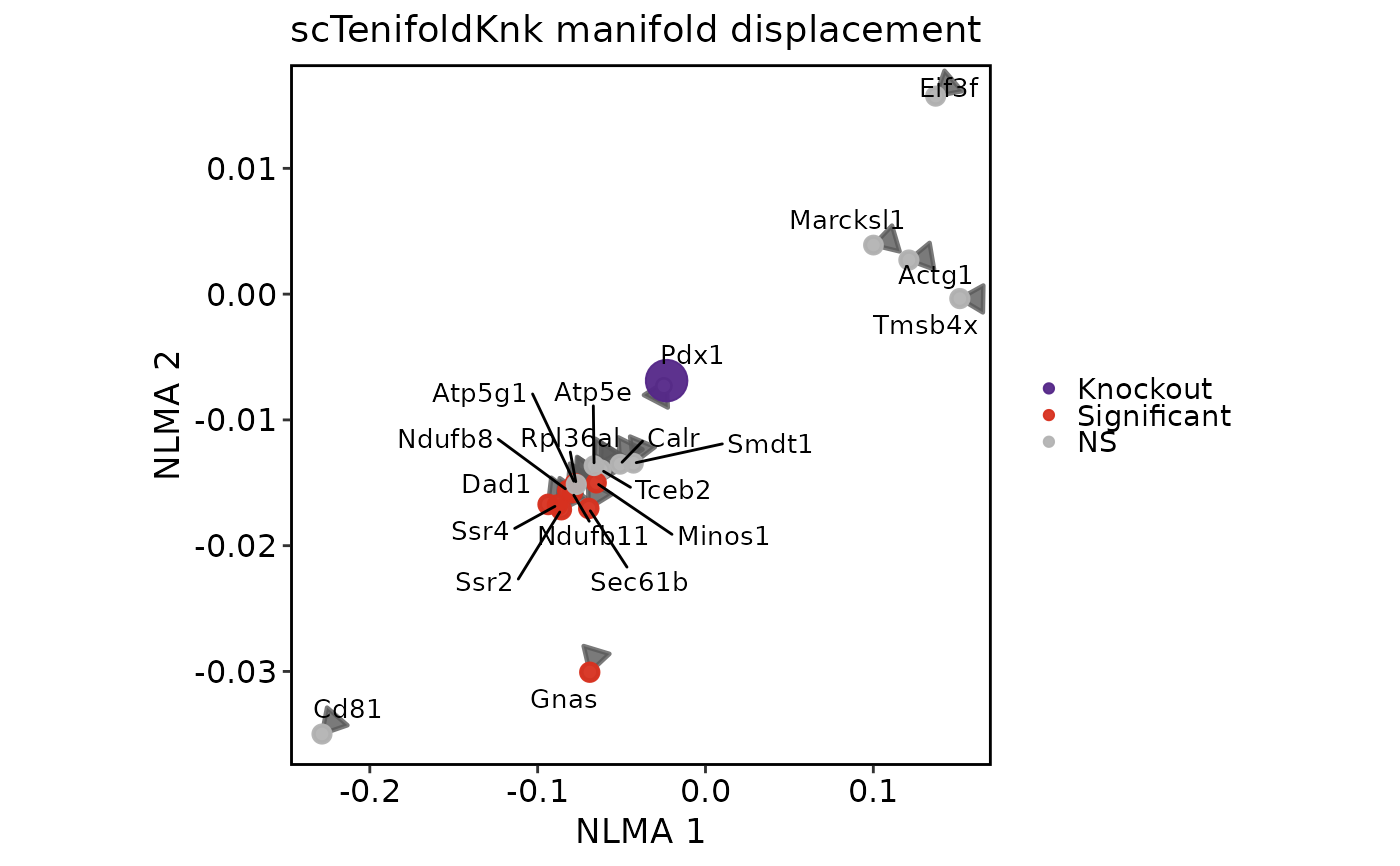
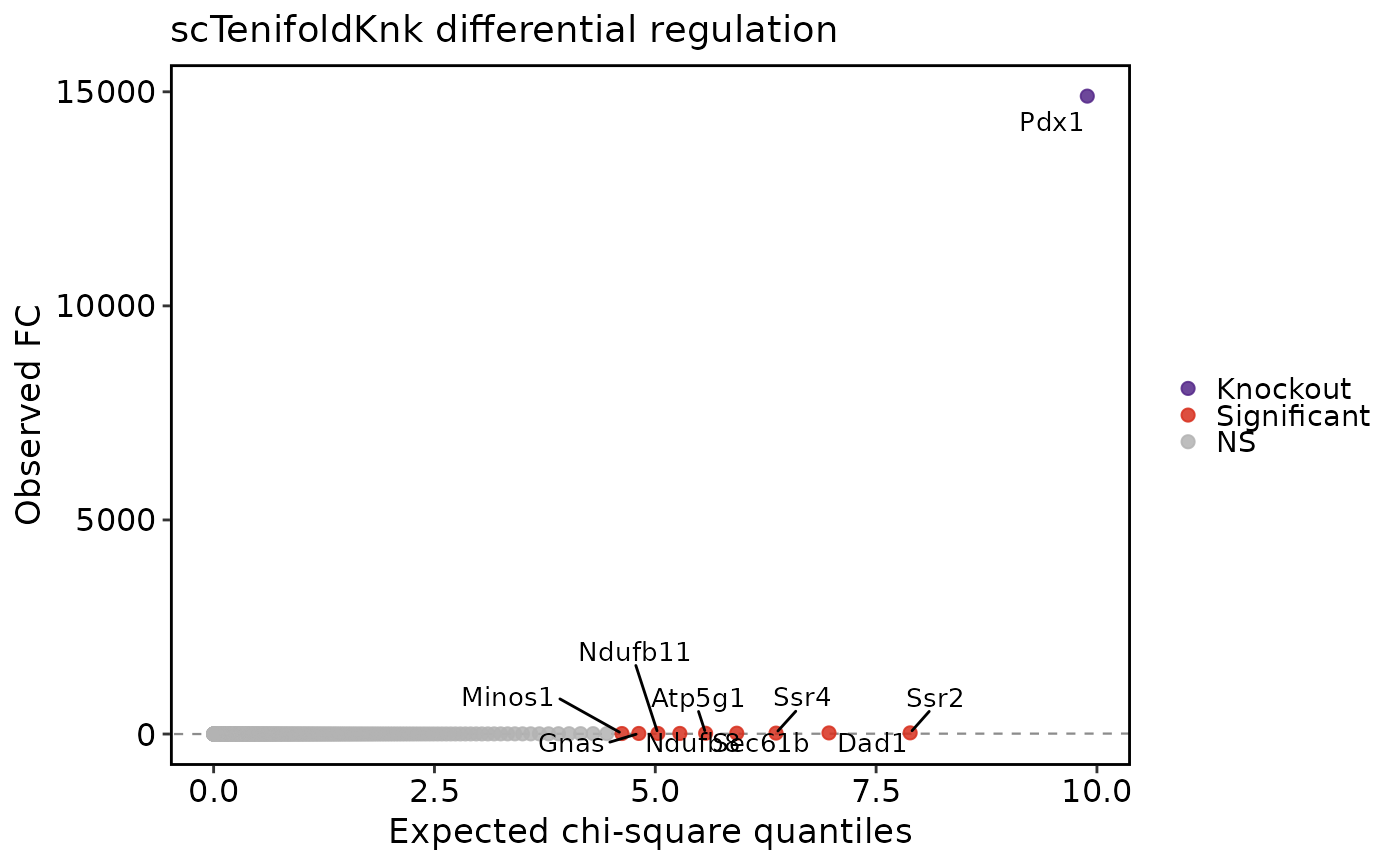
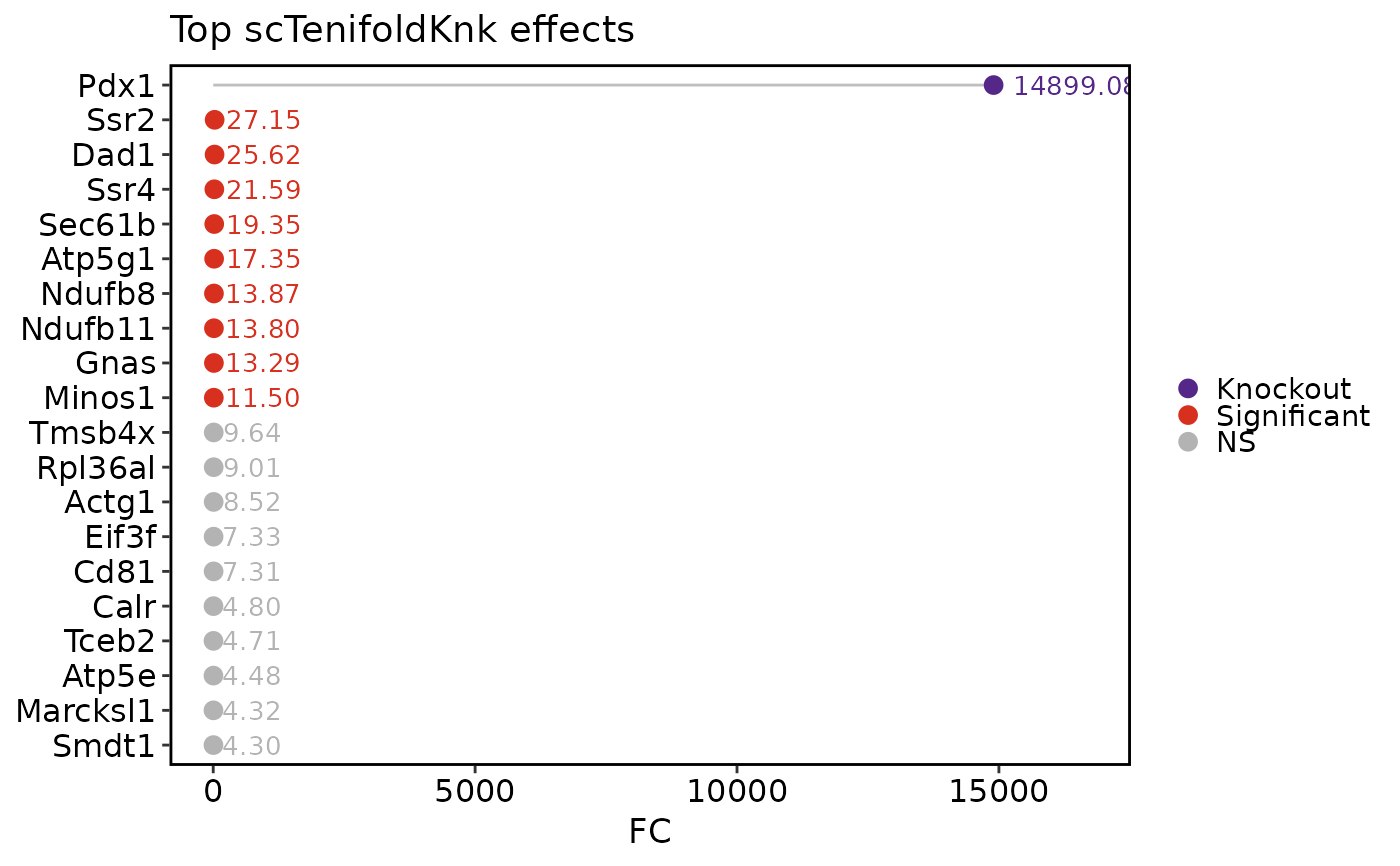
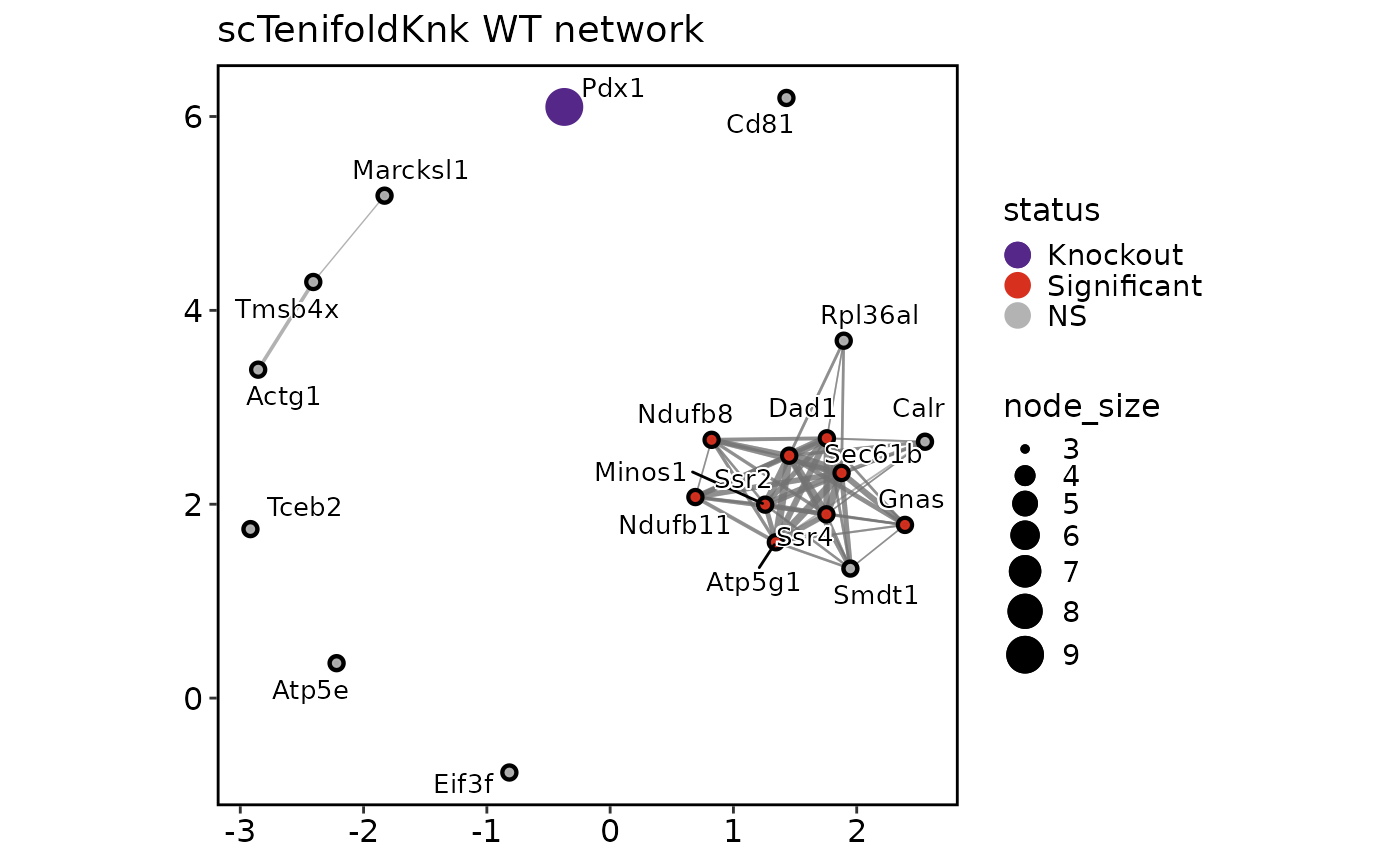
"qq"shows the common scTenifoldKnkFCversus theoretical chi-square quantile plot."effect"ranks top perturbed genes byFC."network"draws a knockout-centered WT network subgraph from saved tensor networks using thisplot::GraphPlot."manifold"draws paired WT-to-KO displacement arrows for selected genes in the non-linear manifold alignment space, showing how each gene's network context shifts after virtual knockout.- top_n
Number of top genes to show or label.
- FDR_threshold
Adjusted p-value cutoff used to mark significant genes.
- FC_threshold
FC cutoff used to mark significant genes.
- features
Character vector of genes to show or label. For
plot_type = "network"and"manifold", these genes are included in the displayed subset when present.- label
Whether to label genes.
- nlabel
Number of labels to add when
features = NULL.- pt.size
Point size.
- pt.alpha
Point transparency.
- label.size
Label text size.
- edge_top_n
Maximum number of network edges to draw.
- edge_threshold
Minimum absolute edge weight for
plot_type = "network". IfNULL, the largestedge_top_nedges are used.- arrow.length
Arrow head length for
plot_type = "manifold".- arrow.linewidth
Arrow line width for
plot_type = "manifold".- arrow.alpha
Arrow transparency for
plot_type = "manifold".- start.pt.size
WT-position point size for
plot_type = "manifold".- end.pt.size
KO-position point size for
plot_type = "manifold".- manifold.aspect.ratio
Panel aspect ratio for
plot_type = "manifold". Default1keeps the panel square. SetNULLto use the device aspect ratio.- cols.sig
Color for significant genes.
- cols.ns
Color for non-significant genes.
- cols.ko
Color for knocked-out genes.
- xlab, ylab
Axis labels.
- title
Plot title. If
NULL, a default title is used.- theme_use
Theme function used to style the plot.
- theme_args
Other arguments passed to
theme_use.- verbose
Whether to print the message. Default is
TRUE.
Examples
data(pancreas_sub)
gene_use <- "Pdx1"
counts <- GetAssayData5(pancreas_sub, assay = "RNA", layer = "counts")
detected <- names(sort(Matrix::rowSums(counts > 0), decreasing = TRUE))
features_use <- unique(c(gene_use, head(detected, 300)))

pancreas_sub <- RunscTenifoldKnk(
  pancreas_sub,
  gKO = gene_use,
  features = features_use,
  qc = FALSE,
  nc_nNet = 3,
  nc_nCells = 200,
  td_maxIter = 200,
  store_networks = TRUE,
  store_manifold = TRUE
)
#> ℹ [2026-07-02 10:24:58] Run scTenifoldKnk knockout for "Pdx1" using "r" backend
#>
  |
  |                                                                      |   0%
  |
  |=                                                                     |   1%
  |
  |=                                                                     |   2%
  |
  |==                                                                    |   2%
  |
  |==                                                                    |   3%
  |
  |==                                                                    |   4%
  |
  |===                                                                   |   4%
  |
  |====                                                                  |   5%
  |
  |====                                                                  |   6%
  |
  |======================================================================| 100%
#> ✔ [2026-07-02 10:25:00] scTenifoldKnk results stored in `srt@tools[[scTenifoldKnk]]`

scTenifoldKnkPlot(pancreas_sub, plot_type = "qq")


scTenifoldKnkPlot(pancreas_sub, plot_type = "effect")


scTenifoldKnkPlot(pancreas_sub, plot_type = "network")


scTenifoldKnkPlot(pancreas_sub, plot_type = "manifold")