A function to plot a graph with nodes and edges.
Usage
GraphPlot(
  node,
  edge,
  transition = NULL,
  node_coord = c("x", "y"),
  node_group = NULL,
  node_palette = "Chinese",
  node_palcolor = NULL,
  node_size = 4,
  node_alpha = 1,
  node_highlight = NULL,
  node_highlight_color = "red",
  label = FALSE,
  label.size = 3.5,
  label.fg = "white",
  label.bg = "black",
  label.bg.r = 0.1,
  label_insitu = FALSE,
  label_repel = FALSE,
  label_repulsion = 20,
  label_point_size = 1,
  label_point_color = "black",
  label_segment_color = "black",
  edge_threshold = 0.01,
  use_triangular = c("upper", "lower", "both"),
  edge_line = c("straight", "curved"),
  edge_line_curvature = 0.3,
  edge_line_angle = 90,
  edge_color = "grey30",
  edge_size = c(0.2, 1),
  edge_alpha = 0.5,
  edge_shorten = 0,
  edge_offset = 0,
  edge_highlight = NULL,
  edge_highlight_color = "red",
  transition_threshold = 0.01,
  transition_line = c("straight", "curved"),
  transition_line_curvature = 0.3,
  transition_line_angle = 90,
  transition_color = "black",
  transition_size = c(0.2, 1),
  transition_alpha = 1,
  transition_arrow_type = "closed",
  transition_arrow_angle = 20,
  transition_arrow_length = grid::unit(0.02, "npc"),
  transition_shorten = 0.05,
  transition_offset = 0,
  transition_highlight = NULL,
  transition_highlight_color = "red",
  aspect.ratio = 1,
  title = NULL,
  subtitle = NULL,
  xlab = NULL,
  ylab = NULL,
  legend.position = "right",
  legend.direction = "vertical",
  theme_use = "theme_this",
  theme_args = list(),
  return_layer = FALSE
)
Arguments
- node
A data frame representing the nodes of the graph.
- edge
A matrix representing the edges of the graph.
- transition
A matrix representing the transitions between nodes.
- node_coord
A character vector specifying the names of the columns in
nodethat represent the x and y coordinates.- node_group
A character vector specifying the name of the column in
nodethat represents the grouping of the nodes.- node_palette
A character vector specifying the name of the color palette for node groups.
- node_palcolor
A character vector specifying the names of the colors for each node group.
- node_size
A numeric value or column name of
nodespecifying the size of the nodes.- node_alpha
A numeric value or column name of
nodespecifying the transparency of the nodes.- node_highlight
A character vector specifying the names of nodes to highlight.
- node_highlight_color
A character vector specifying the color for highlighting nodes.
- label
Whether to show labels for the nodes.
- label.size
The size of the labels.
- label.fg
A character vector specifying the foreground color of the labels.
- label.bg
A character vector specifying the background color of the labels.
- label.bg.r
The background color transparency of the labels.
- label_insitu
Whether to display the node group labels in situ or as numeric values.
- label_repel
Whether to use force-directed label repulsion.
- label_repulsion
The repulsion force for labels.
- label_point_size
The size of the label points.
- label_point_color
A character vector specifying the color of the label points.
- label_segment_color
A character vector specifying the color for the label segments.
- edge_threshold
The threshold for removing edges.
- use_triangular
A character vector specifying which part of the edge matrix to use (upper, lower, both).
- edge_line
A character vector specifying the type of line for edges (straight, curved).
- edge_line_curvature
The curvature of curved edges.
- edge_line_angle
The angle of curved edges.
- edge_color
A character vector specifying the color of the edges.
- edge_size
A numeric vector specifying the range of edge sizes.
- edge_alpha
The transparency of the edges.
- edge_shorten
The length of the edge shorten.
- edge_offset
The length of the edge offset.
- edge_highlight
A character vector specifying the names of edges to highlight.
- edge_highlight_color
A character vector specifying the color for highlighting edges.
- transition_threshold
The threshold for removing transitions.
- transition_line
A character vector specifying the type of line for transitions (straight, curved).
- transition_line_curvature
The curvature of curved transitions.
- transition_line_angle
The angle of curved transitions.
- transition_color
A character vector specifying the color of the transitions.
- transition_size
A numeric vector specifying the range of transition sizes.
- transition_alpha
The transparency of the transitions.
- transition_arrow_type
A character vector specifying the type of arrow for transitions (closed, open).
- transition_arrow_angle
The angle of the transition arrow.
- transition_arrow_length
The length of the transition arrow.
- transition_shorten
The length of the transition shorten.
- transition_offset
The length of the transition offset.
- transition_highlight
A character vector specifying the names of transitions to highlight.
- transition_highlight_color
A character vector specifying the color for highlighting transitions.
- aspect.ratio
Aspect ratio passed to
theme().- title
Plot title.
- subtitle
Plot subtitle.
- xlab
Label for the x axis.
- ylab
Label for the y axis.
- legend.position
Legend position passed to
theme().- legend.direction
Legend direction passed to
theme().- theme_use
Theme function applied to the plot.
- theme_args
A named list of arguments passed to
theme_use.- return_layer
Whether to return the plot layers as a list. Defaults is
FALSE.
Examples
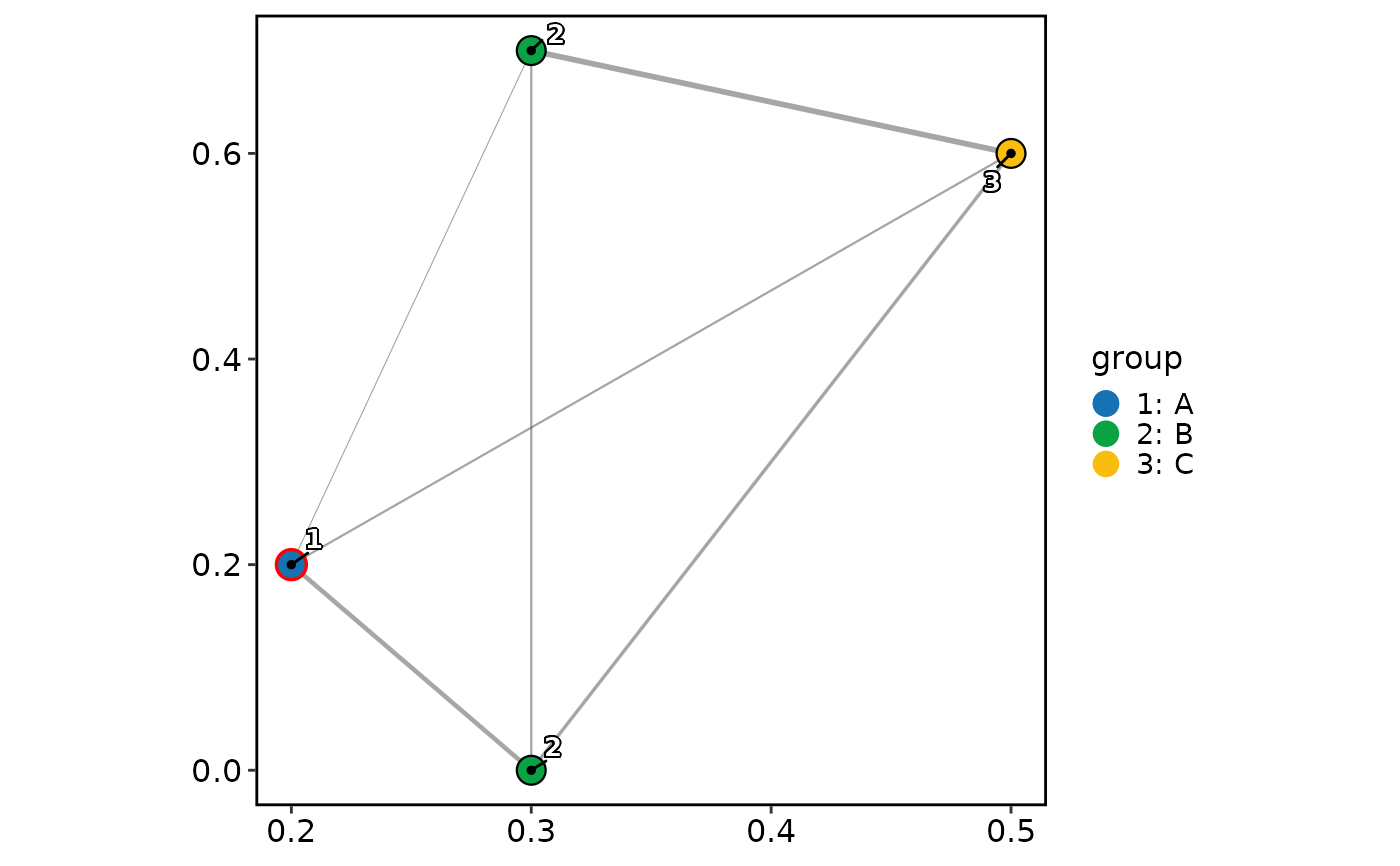
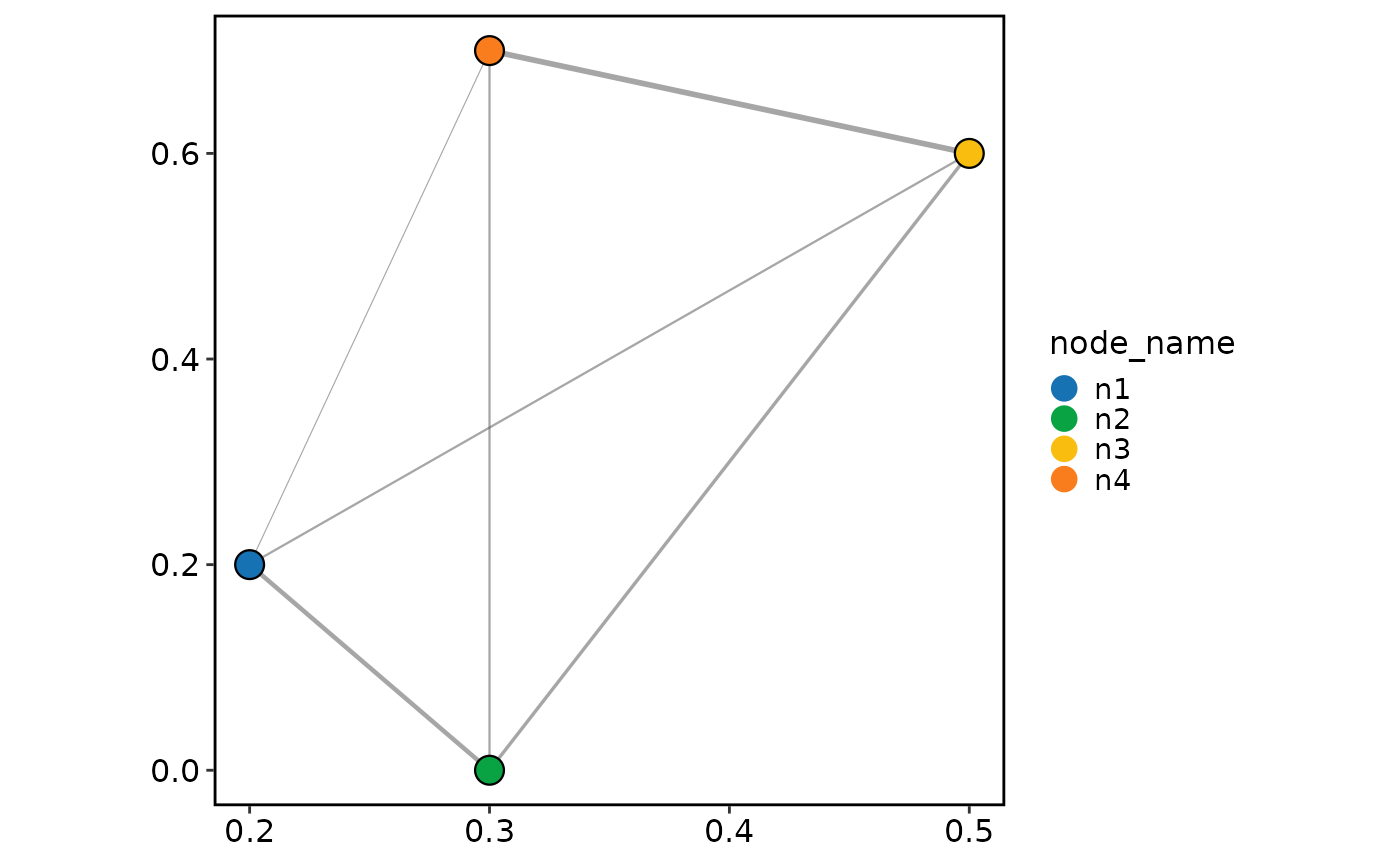
node <- data.frame(
  x = c(0.2, 0.3, 0.5, 0.3),
  y = c(0.2, 0, 0.6, 0.7),
  group = c("A", "B", "C", "B"),
  row.names = c("n1", "n2", "n3", "n4")
)
edge <- matrix(
  c(
    0, 0.4, 0.2, 0.1,
    0.4, 0, 0.3, 0.2,
    0.2, 0.3, 0 , 0.5,
    0.2, 0.2, 0.5, 0.3
  ),
  nrow = 4,
  byrow = TRUE,
  dimnames = list(rownames(node), rownames(node))
)
GraphPlot(
  node = node,
  edge = edge
)
#> Warning: Removed 1 row containing missing values or values outside the scale range
#> (`geom_segment()`).


GraphPlot(
  node = node,
  edge = edge,
  node_group = "group",
  node_highlight = "n1",
  label = TRUE,
  label_repel = TRUE
)
#> Warning: Removed 1 row containing missing values or values outside the scale range
#> (`geom_segment()`).
GraphPlot(
node = node,
edge = edge,
node_group = "group",
node_highlight = "n1",
label = TRUE,
label_repel = TRUE
)
#> Warning: Removed 1 row containing missing values or values outside the scale range
#> (`geom_segment()`).