This function takes a data frame representing segments in a plot and shortens and offsets them based on the provided arguments.
Arguments
- data
A data frame containing the segments. It should have columns 'x', 'y', 'xend', and 'yend' representing the start and end points of each segment.
- shorten_start
The amount to shorten the start of each segment by.
- shorten_end
The amount to shorten the end of each segment by.
- offset
The amount to offset each segment by.
Examples
library(ggplot2)
temp_nodes <- data.frame(
"x" = c(10, 40),
"y" = c(10, 30)
)
data <- data.frame(
"x" = c(10, 40),
"y" = c(10, 30),
"xend" = c(40, 10),
"yend" = c(30, 10)
)
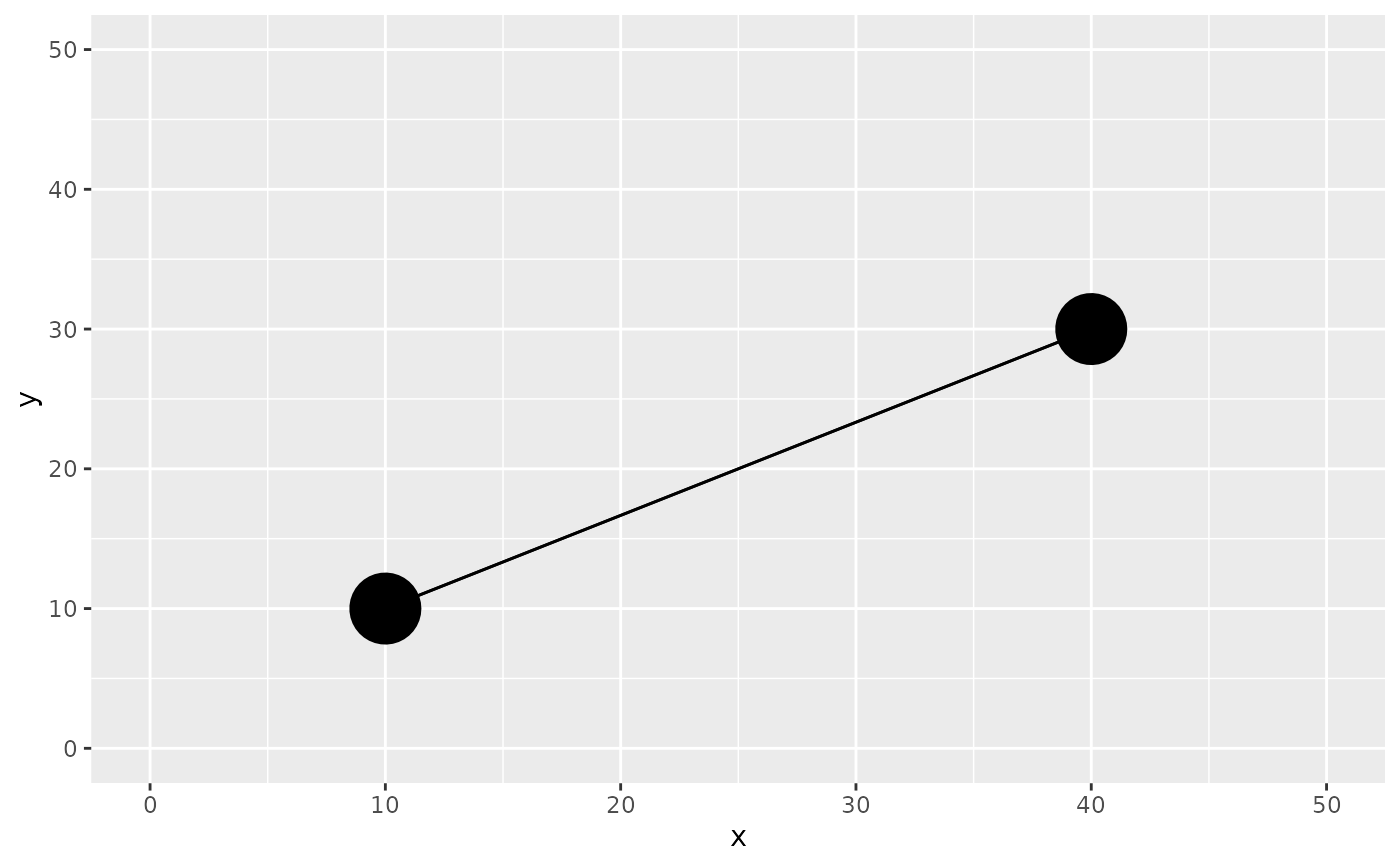
ggplot(temp_nodes, aes(x = x, y = y)) +
geom_point(size = 12) +
xlim(0, 50) +
ylim(0, 50) +
geom_segment(
data = data,
aes(x = x, xend = xend, y = y, yend = yend)
)
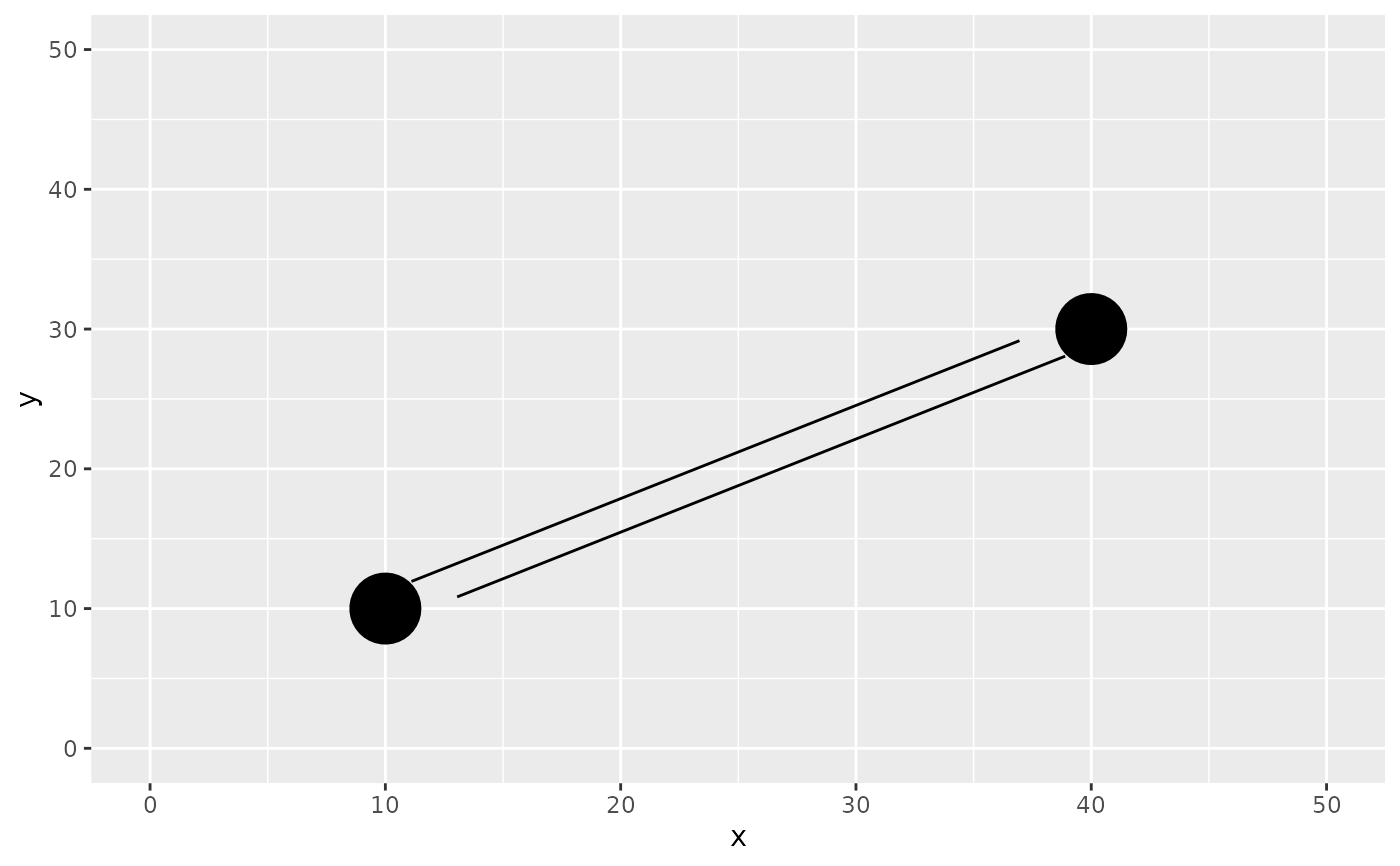
 ggplot(temp_nodes, aes(x = x, y = y)) +
geom_point(size = 12) +
xlim(0, 50) +
ylim(0, 50) +
geom_segment(
data = segements_df(
data,
shorten_start = 2,
shorten_end = 3,
offset = 1
),
aes(x = x, xend = xend, y = y, yend = yend)
)
ggplot(temp_nodes, aes(x = x, y = y)) +
geom_point(size = 12) +
xlim(0, 50) +
ylim(0, 50) +
geom_segment(
data = segements_df(
data,
shorten_start = 2,
shorten_end = 3,
offset = 1
),
aes(x = x, xend = xend, y = y, yend = yend)
)