Generate differential-abundance plots based on results from RunProportionTest. Supports both legacy storage and method-layer storage from the multi-method proportion-test workflow.
Usage
ProportionTestPlot(
  srt,
  comparison = NULL,
  proportion_method = NULL,
  result_level = c("group"),
  plot_type = c("effect", "umap"),
  umap_mode = c("discrete", "continuous"),
  reduction = "UMAP",
  projection_args = list(),
  FDR_threshold = 0.05,
  log2FD_threshold = log2(1.5),
  order_by = c("value", "name"),
  palette = "RdBu",
  palcolor = NULL,
  group_palette = "Chinese",
  group_palcolor = NULL,
  pt.size = 1,
  pt.alpha = 1,
  cols.sig = "red",
  cols.ns = "grey",
  cols.increase = "#d7301f",
  cols.decrease = "#2b8cbe",
  effect_color_mode = c("directional", "classic"),
  nlabel = 5,
  features_label = NULL,
  label = FALSE,
  label.fg = "black",
  label.bg = "white",
  label.bg.r = 0.1,
  label.size = 4,
  aspect.ratio = NULL,
  xlab = "Cell Type",
  ylab = "log2 (FD)",
  theme_use = "theme_scop",
  theme_args = list(),
  legend.position = "bottom",
  legend.direction = "vertical",
  legend.title = "Significance",
  combine = TRUE,
  nrow = NULL,
  ncol = NULL,
  byrow = TRUE,
  seed = 11,
  verbose = TRUE
)
Arguments
- srt
A Seurat object containing proportion-test results.
- comparison
A character string specifying which comparison to plot. If
NULL, plots all comparisons.- proportion_method
Optional method to select from
srt@tools[['ProportionTest']][['methods']]. IfNULL, uses the active/most recent method.- result_level
Result level to draw. Currently only
"group"is used.- plot_type
Plot type. One of
"effect"or"umap".- umap_mode
UMAP projection mode for
plot_type = "umap"."discrete"maps cells to DA direction categories;"continuous"maps cells to group-levelobs_log2FD.- reduction
Reduction name used by UMAP projection.
- projection_args
Additional arguments passed to CellDimPlot (
umap_mode = "discrete") or FeatureDimPlot (umap_mode = "continuous").- FDR_threshold
FDR value cutoff for significance.
- log2FD_threshold
Absolute value of log2FD cutoff for significance.
- order_by
Method to order clusters. Options:
"name"(alphabetical),"value"(by log2FD value).- palette
Color palette name for continuous effect coloring.
- palcolor
Custom colors for
palette.- group_palette
Palette for cluster/group coloring.
- group_palcolor
Custom colors for
group_palette.- pt.size
The size of the points.
- pt.alpha
Point transparency.
- cols.sig
Color for significant/credible points and intervals.
- cols.ns
Color for non-significant points and intervals.
- cols.increase
Default color for increased DA groups.
- cols.decrease
Default color for decreased DA groups.
- effect_color_mode
Coloring mode for
plot_type = "effect". Use"directional"(default) for increased/decreased/NS colors, or"classic"for legacy significant/non-significant coloring.- nlabel
Number of labels added when
label = TRUEandfeatures_label = NULL.- features_label
Character vector specifying points to label.
- label
Whether to add labels.
- label.fg
Label foreground color.
- label.bg
Label background color.
- label.bg.r
Label background radius.
- label.size
Label text size.
- aspect.ratio
Aspect ratio of the panel.
- xlab
A character string specifying the x-axis label. For
plot_type = "umap", this is forwarded to the projection plot when set.- ylab
A character string specifying the y-axis label. For
plot_type = "umap", this is forwarded to the projection plot when set.- theme_use
Theme used. Can be a character string or a theme function. Default is
"theme_scop".- theme_args
Other arguments passed to the
theme_use. Default islist().- legend.position
The position of legends, one of
"none","left","right","bottom","top".- legend.direction
The direction of the legend in the plot. Can be one of
"vertical"or"horizontal".- legend.title
Title of the legend.
- combine
Combine plots into a single
patchworkobject. IfFALSE, return a list of ggplot objects.- nrow
Number of rows in the combined plot. Default is
NULL, which means determined automatically based on the number of plots.- ncol
Number of columns in the combined plot. Default is
NULL, which means determined automatically based on the number of plots.- byrow
Whether to arrange the plots by row in the combined plot. Default is
TRUE.- seed
Random seed for reproducibility. Default is
11.- verbose
Whether to print the message. Default is
TRUE.
Examples
data(pancreas_sub)
pancreas_sub <- standard_scop(pancreas_sub)
#> ℹ [2026-07-02 09:19:22] Start standard processing workflow...
#> ℹ [2026-07-02 09:19:23] Checking a list of <Seurat>...
#> ! [2026-07-02 09:19:23] Data 1/1 of the `srt_list` is "unknown"
#> ℹ [2026-07-02 09:19:23] Perform `NormalizeData()` with `normalization.method = 'LogNormalize'` on 1/1 of `srt_list`...
#> ℹ [2026-07-02 09:19:23] Perform `FindVariableFeatures()` on 1/1 of `srt_list`...
#> ℹ [2026-07-02 09:19:23] Use the separate HVF from `srt_list`
#> ℹ [2026-07-02 09:19:23] Number of available HVF: 2000
#> ℹ [2026-07-02 09:19:23] Finished check
#> ℹ [2026-07-02 09:19:23] Perform `ScaleData()`
#> ℹ [2026-07-02 09:19:23] Perform pca linear dimension reduction
#> ℹ [2026-07-02 09:19:24] Use stored estimated dimensions 1:23 for Standardpca
#> ℹ [2026-07-02 09:19:24] Perform `Seurat::FindClusters()` with `cluster_algorithm = 'louvain'` and `cluster_resolution = 0.6`
#> ℹ [2026-07-02 09:19:24] Reorder clusters...
#> ℹ [2026-07-02 09:19:25] Skip `log1p()` because `layer = data` is not "counts"
#> ℹ [2026-07-02 09:19:25] Perform umap nonlinear dimension reduction
#> ✔ [2026-07-02 09:19:30] Standard processing workflow completed
pancreas_sub <- RunProportionTest(
pancreas_sub,
group.by = "CellType",
split.by = "Phase",
proportion_method = "permutation"
)
#> ℹ [2026-07-02 09:19:30] Start proportion test ("permutation")
#> ℹ [2026-07-02 09:19:30] Running comparison: "S" vs "G1"
#> ℹ [2026-07-02 09:19:32] Running comparison: "G2M" vs "G1"
#> ℹ [2026-07-02 09:19:34] Running comparison: "G2M" vs "S"
#> ℹ [2026-07-02 09:19:34] Running comparison: "G1" vs "S"
#> ℹ [2026-07-02 09:19:34] Running comparison: "G1" vs "G2M"
#> ℹ [2026-07-02 09:19:34] Running comparison: "S" vs "G2M"
#> ✔ [2026-07-02 09:19:34] Proportion test completed ("permutation")
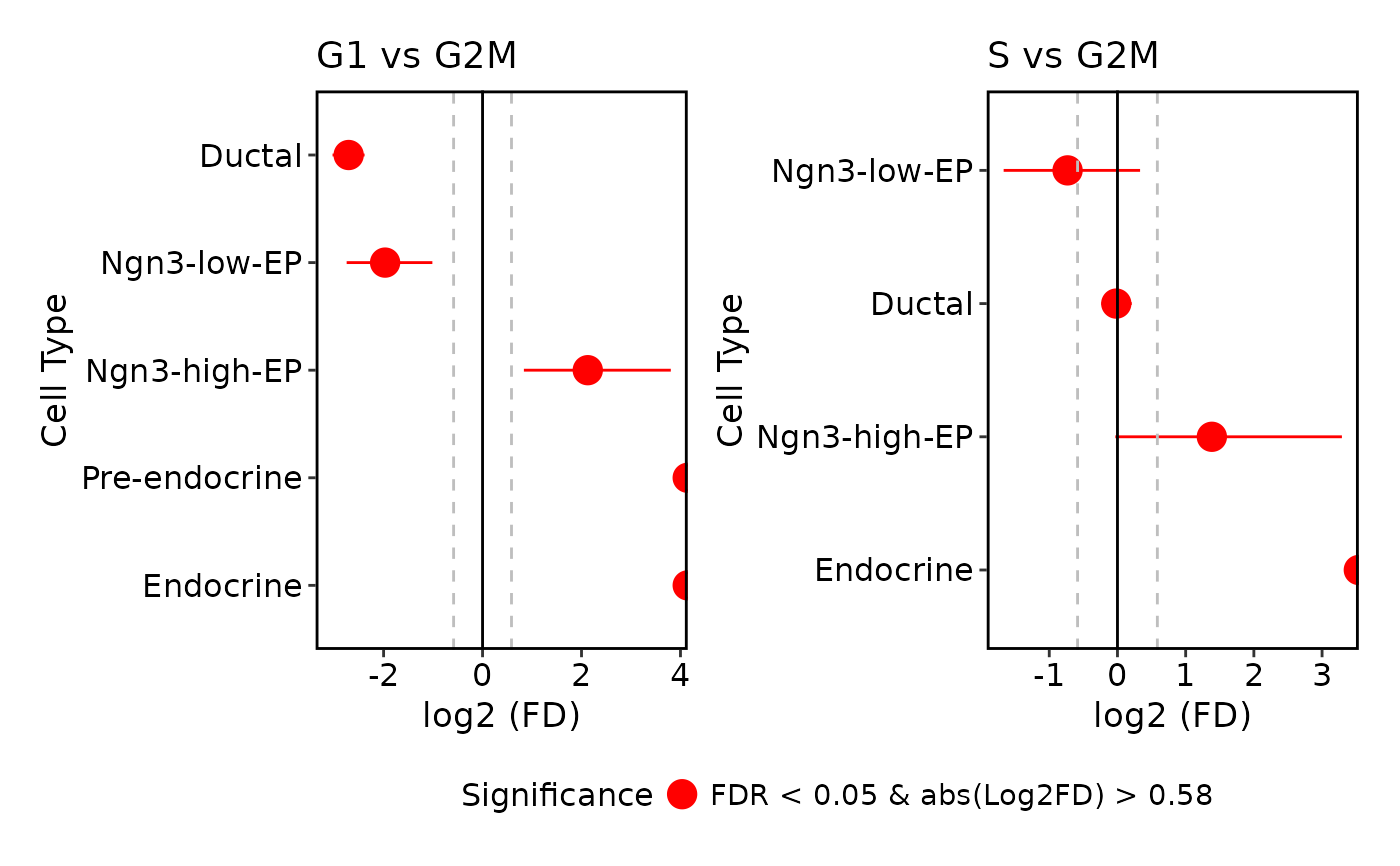
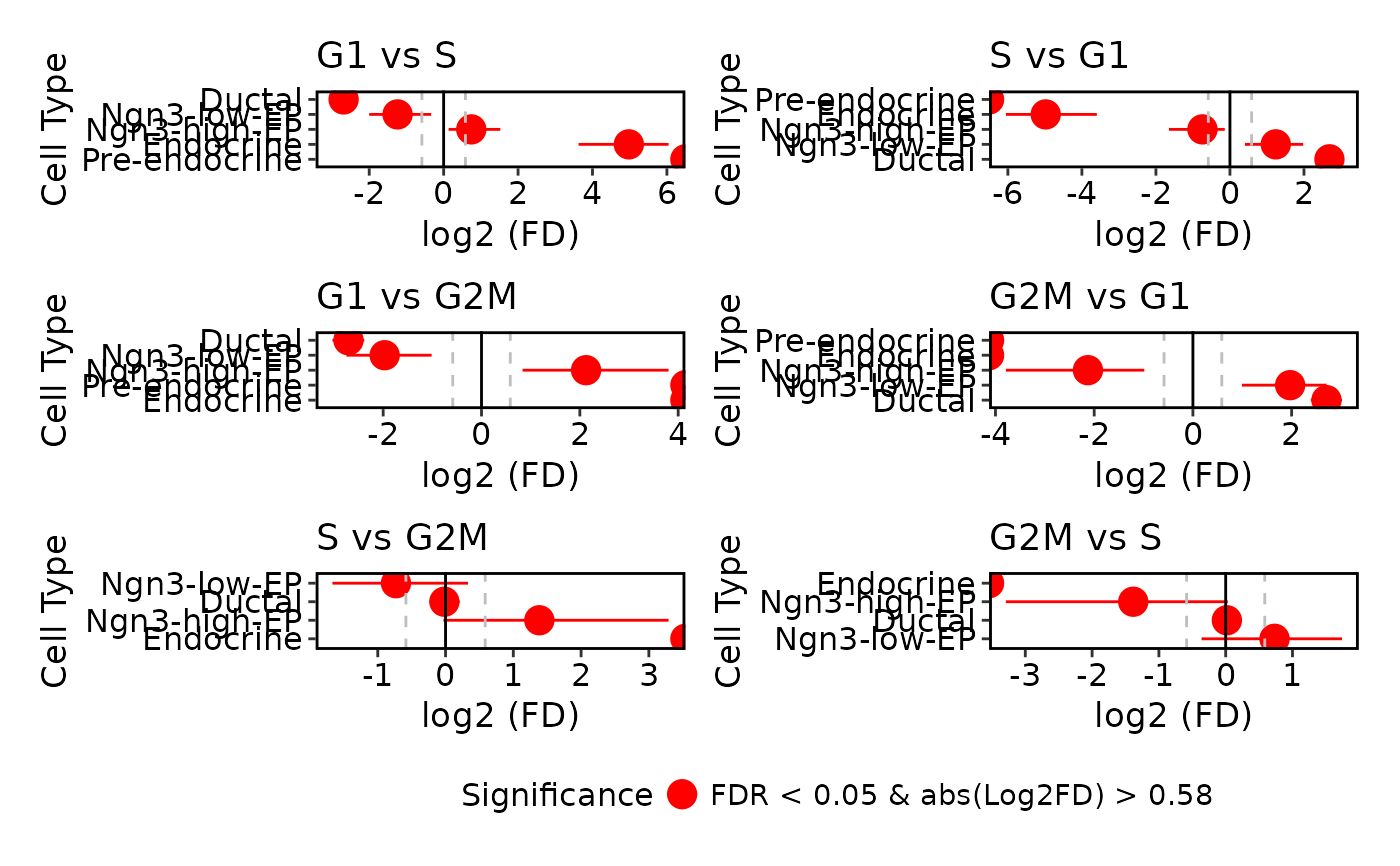
ProportionTestPlot(pancreas_sub)
 ProportionTestPlot(
pancreas_sub,
reduction = "UMAP",
plot_type = "umap",
xlab = "UMAP_1",
ylab = "UMAP_2"
)
ProportionTestPlot(
pancreas_sub,
reduction = "UMAP",
plot_type = "umap",
xlab = "UMAP_1",
ylab = "UMAP_2"
)