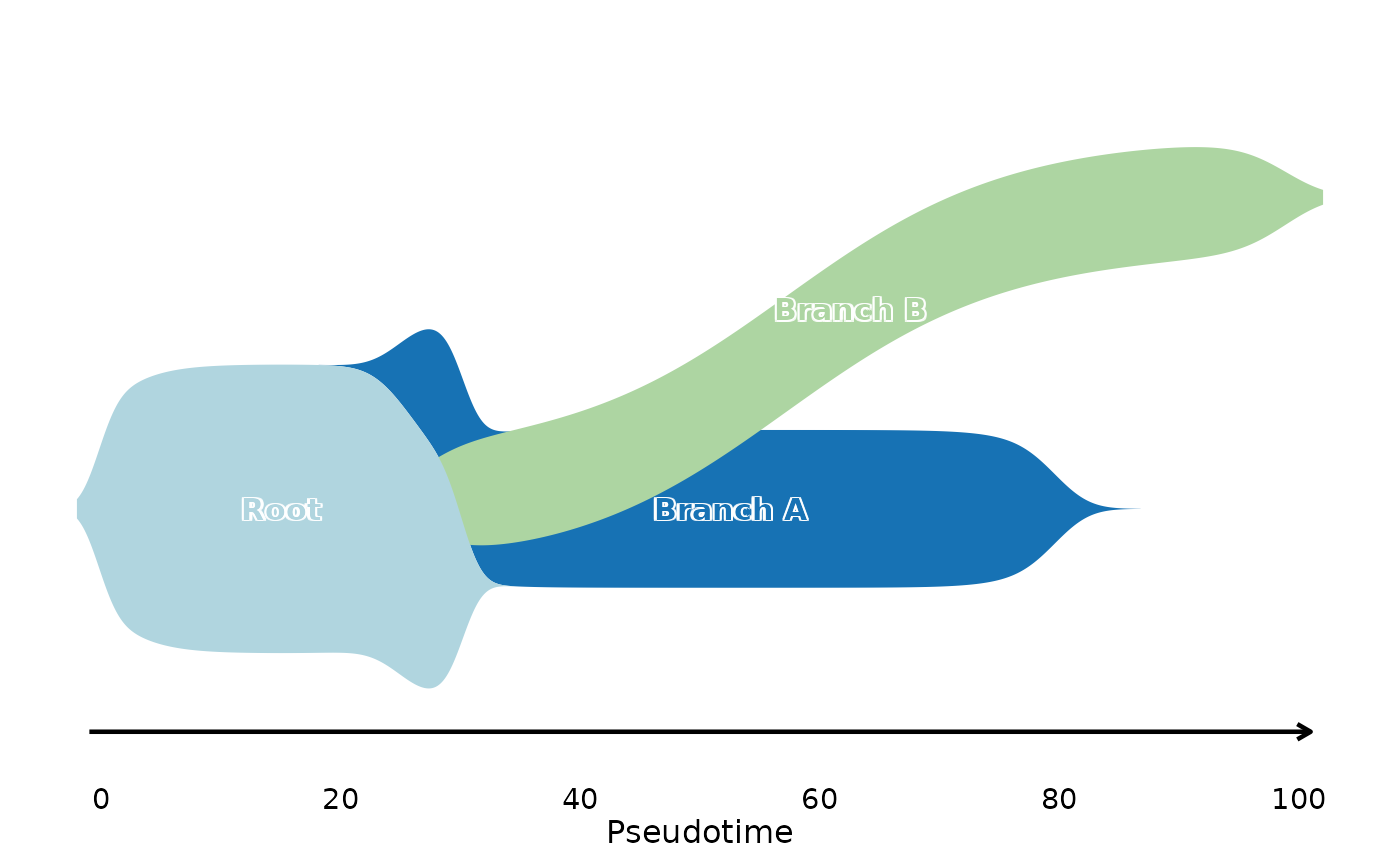
Draw branch-aware pseudotime ribbons from cell-state annotations. The plot is a visualization of pseudotime density by group; it does not infer a lineage tree by itself.
Usage
BranchStreamPlot(
  object,
  group.by,
  lineages = NULL,
  lineage.merge = c("min", "mean", "max"),
  labels = NULL,
  trunk_groups = NULL,
  branch_groups = NULL,
  branch_center = "auto",
  branch_steepness = 11,
  branch_power = 1.1,
  branch_amplitude = 0.28,
  n_branches = 2,
  n_grid = 800,
  bw = 0.15,
  pad = 0.035,
  count_power = 0.3,
  normalize_pseudotime = FALSE,
  scale_to = "auto",
  min_visible_width = 1e-04,
  xlim = NULL,
  ylim = NULL,
  xlabel = "Pseudotime",
  xticks = "auto",
  axis_y = "auto",
  label_positions = "auto",
  label_size = 4,
  label_fontface = "bold",
  label_fill = NULL,
  label_fill_alpha = 0.85,
  label_outline_width = 0.0018,
  label_outline_alpha = 0.8,
  ribbon_alpha = 1,
  palette = "Chinese",
  palcolor = NULL,
  axis_arrow = grid::arrow(length = grid::unit(0.08, "inches")),
  title = NULL,
  legend.position = "none",
  legend.direction = "vertical",
  theme_use = "theme_scop",
  theme_args = list(),
  combine = TRUE,
  nrow = NULL,
  ncol = NULL,
  byrow = TRUE
)
Arguments
- object
A
Seuratobject or adata.framecontaining cell metadata.- group.by
Column containing cell-state or branch labels.
- lineages
Pseudotime columns to use. If
NULL, lineage-like pseudotime columns such asLineage1,Lineage2,prefix_Lineage1, orpseudotimeare detected and merged into one global pseudotime for a single panel. Use"all"to plot each detected lineage in separate panels.- lineage.merge
How to merge multiple lineage pseudotime columns when
lineagesisNULLor"merge".- labels
Optional order of groups to plot. Factor levels are used when omitted.
- trunk_groups
Groups placed on the shared trunk. If
NULL, groups are inferred from KDE peak positions.- branch_groups
Optional named numeric vector/list mapping group labels to branch amplitudes. Positive and negative amplitudes bend branches in opposite directions.
- branch_center, branch_steepness, branch_power, branch_amplitude
Parameters controlling automatic branch centerlines. Use
"auto"forbranch_centerto place the split point on the current pseudotime scale.- n_branches
Number of branch amplitudes used when
branch_groupsis inferred.- n_grid
Number of pseudotime grid points.
- bw, pad
SciPy-style Gaussian KDE bandwidth factor and taper padding.
- count_power
Exponent used to scale profiles by group abundance.
- normalize_pseudotime
Whether to min-max normalize pseudotime before KDE. Default is
FALSE, so the original pseudotime scale is shown. Use"auto"to normalize only when values fall outside[0, 1].- scale_to
Maximum ribbon thickness after global rescaling. Use
"auto"for a sensible default orNULLto disable rescaling.- min_visible_width
Ribbons thinner than this threshold are hidden.
- xlim, ylim
Plot limits.
xlim = NULLuses the observed pseudotime range.- xlabel
X-axis label.
- xticks
Pseudotime tick locations. Use
"auto"for pretty breaks on the current pseudotime scale.- axis_y
Y position of the arrow-style pseudotime axis. Use
"auto"orNULL.- label_positions
Optional data.frame/list with label, x, y, and optional size columns.
"auto"places labels at ribbon maxima.- label_size, label_fontface, label_fill, label_fill_alpha
Label styling. If
label_fillisNULL, labels are drawn as OmicVerse-style colored text with a white outline.- label_outline_width, label_outline_alpha
Outline styling used when
label_fillisNULL.- ribbon_alpha
Ribbon transparency.
- palette
Color palette name.
- palcolor
Custom colors used to create a color palette.
- axis_arrow
Arrow used for the pseudotime axis.
- title
Plot title.
NULLhides the title for merged/single panels. When multiple lineages are plotted andtitleisNULL, each panel is titled with its lineage column.- legend.position
The position of legends, one of
"none","left","right","bottom","top". Default is"right".- legend.direction
The direction of the legend in the plot. Can be one of
"vertical"or"horizontal".- theme_use
Theme used. Can be a character string or a theme function. Default is
"theme_scop".- theme_args
Other arguments passed to the
theme_use. Default islist().- combine
Whether to combine multiple lineage plots with
patchwork.- nrow, ncol, byrow
Layout controls for combined lineage plots.