Plot coefficients for multiple targets
Examples
data(example_matrix)
network_table <- inferCSN(
example_matrix,
targets = c("g1", "g2", "g3")
)
#> ℹ [2026-01-23 02:15:59] Inferring network for <matrix/array>...
#> ◌ [2026-01-23 02:15:59] Checking parameters...
#> ℹ [2026-01-23 02:15:59] Using L0 sparse regression model
#> ℹ [2026-01-23 02:15:59] Using 3 targets
#> ℹ [2026-01-23 02:15:59] Using 1 core
#> ⠙ [2026-01-23 02:15:59] Running for g1 [1/3] ■■■■■■■■■■■ …
#> ✔ [2026-01-23 02:15:59] Completed 3 tasks in 72ms
#>
#> ℹ [2026-01-23 02:15:59] Building results
#> ✔ [2026-01-23 02:15:59] Inferring network done
#> ℹ [2026-01-23 02:15:59] Network information:
#> ℹ Edges Regulators Targets
#> ℹ 1 51 18 3
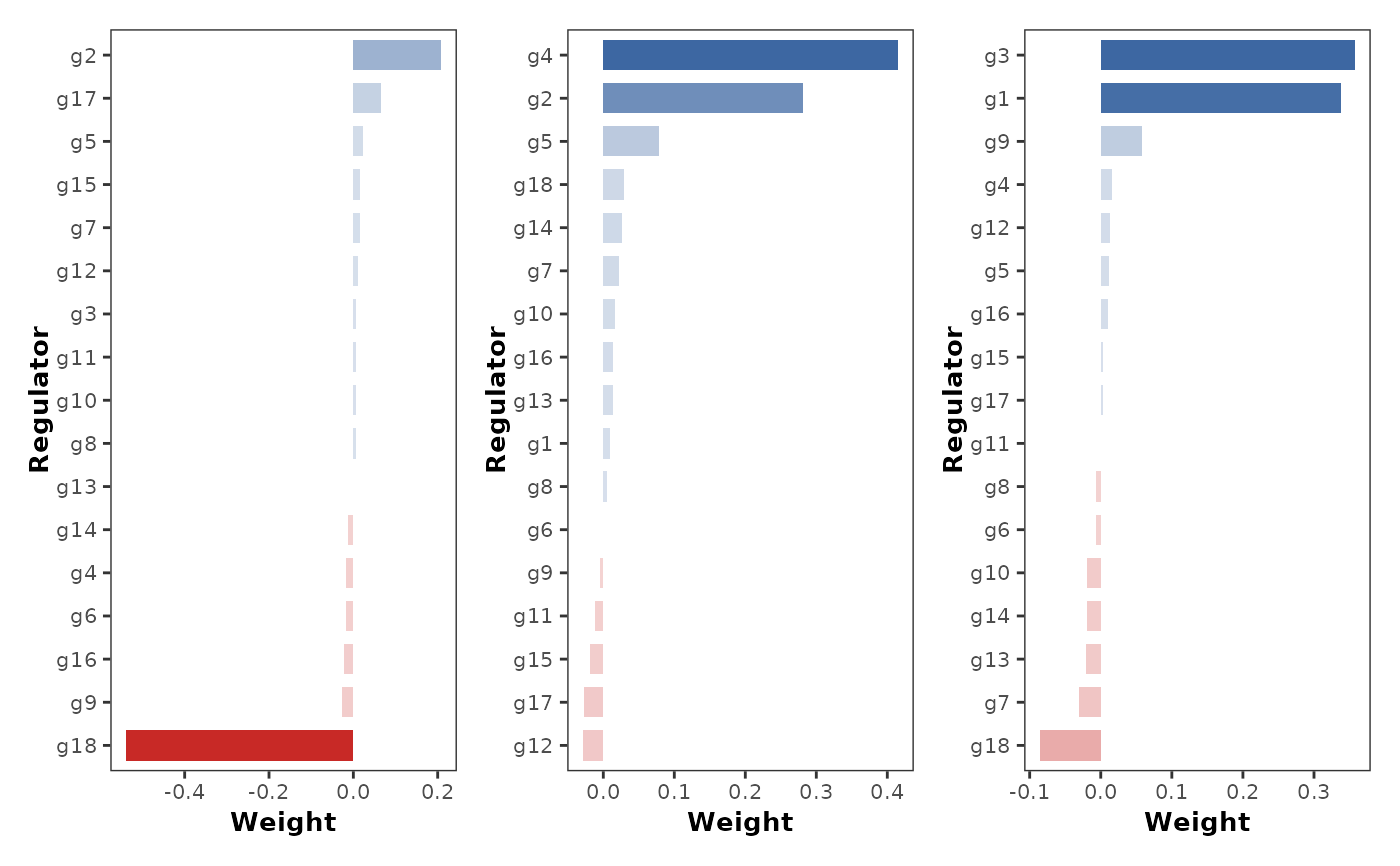
plot_coefficients(network_table, show_values = FALSE)
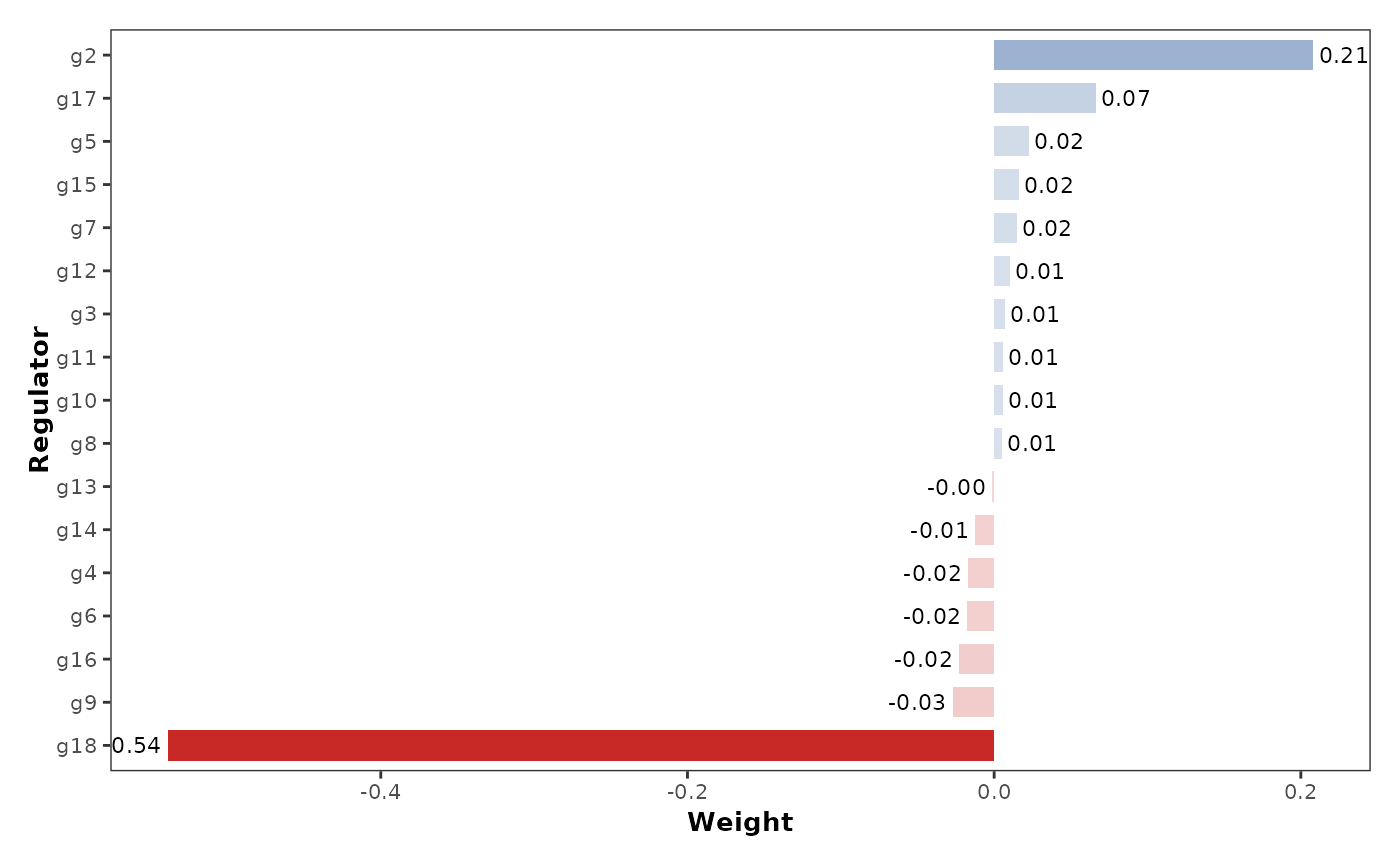
 plot_coefficients(network_table, targets = "g1")