Plot coefficients
Usage
plot_coefficient(
data,
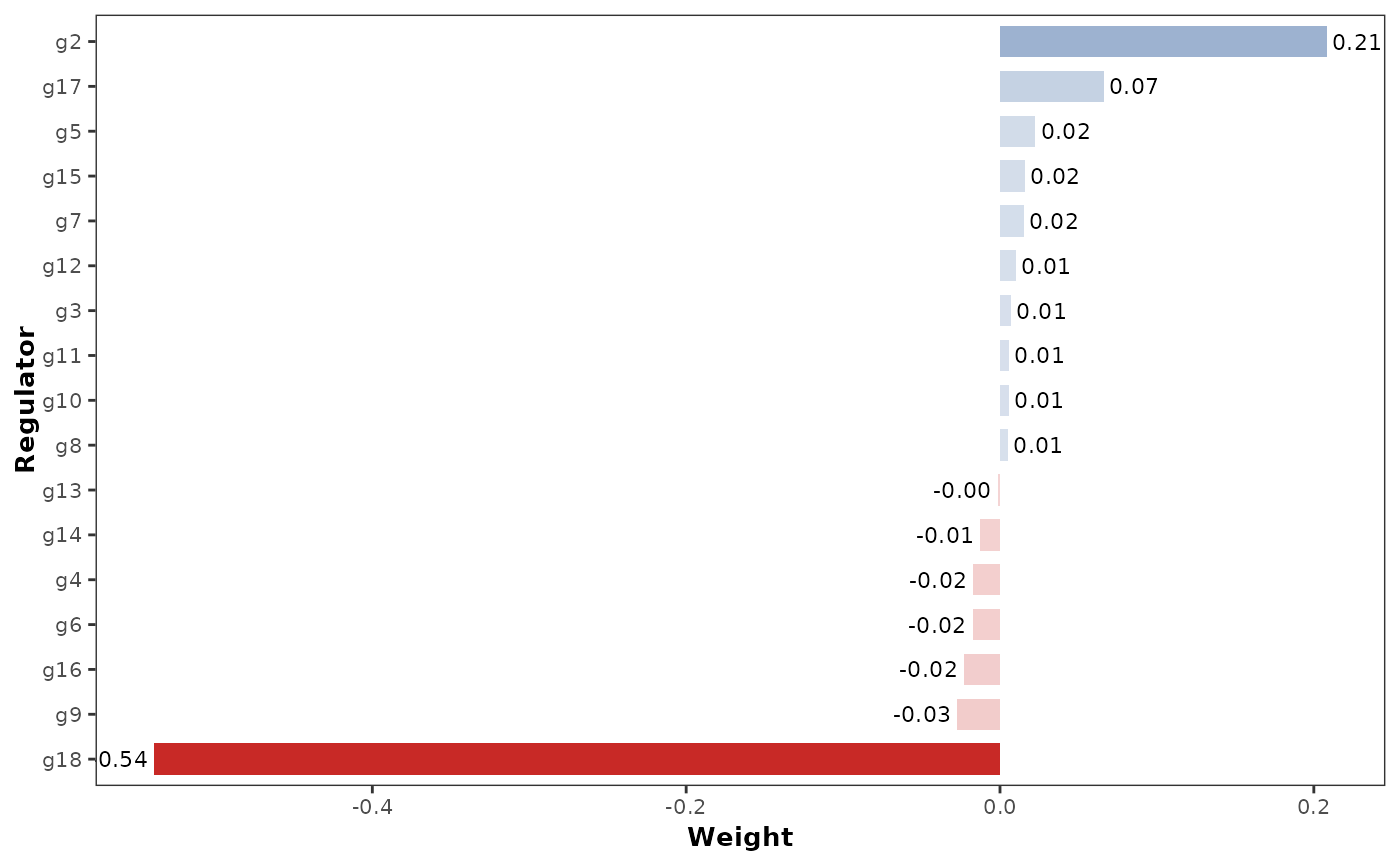
style = "continuous",
positive_color = "#3d67a2",
negative_color = "#c82926",
neutral_color = "#cccccc",
bar_width = 0.7,
text_size = 3,
show_values = TRUE
)Arguments
- data
Input data.
- style
Plotting style:
"binary","gradient", or"continuous".- positive_color
Color for positive weights. Default is
"#3d67a2".- negative_color
Color for negative weights. Default is
"#c82926".- neutral_color
Color for weights near zero (used in
"continuous"style). Default is"#cccccc".- bar_width
Width of the bars. Default is
0.7.- text_size
Size of the text for weight values. Default is
3.- show_values
Whether to show weight values on bars. Default is
TRUE.
Examples
data(example_matrix)
network_table <- inferCSN(example_matrix, targets = "g1")
#> ℹ [2026-01-23 02:15:58] Inferring network for <matrix/array>...
#> ◌ [2026-01-23 02:15:58] Checking parameters...
#> ℹ [2026-01-23 02:15:58] Using L0 sparse regression model
#> ℹ [2026-01-23 02:15:58] Using 1 target
#> ℹ [2026-01-23 02:15:58] Using 1 core
#> ℹ [2026-01-23 02:15:58] Building results
#> ✔ [2026-01-23 02:15:58] Inferring network done
#> ℹ [2026-01-23 02:15:58] Network information:
#> ℹ Edges Regulators Targets
#> ℹ 1 17 17 1
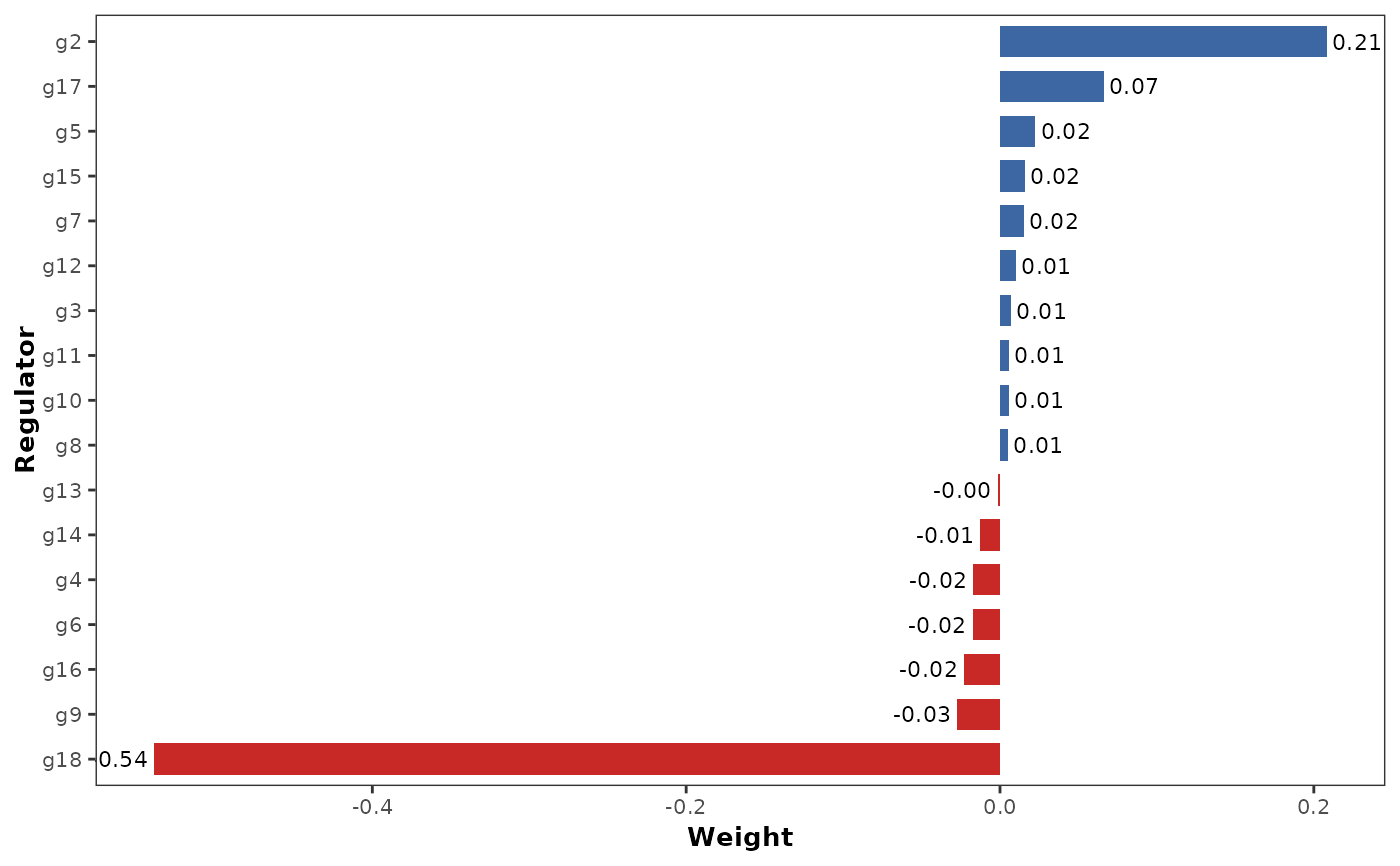
plot_coefficient(network_table)
 plot_coefficient(network_table, style = "binary")