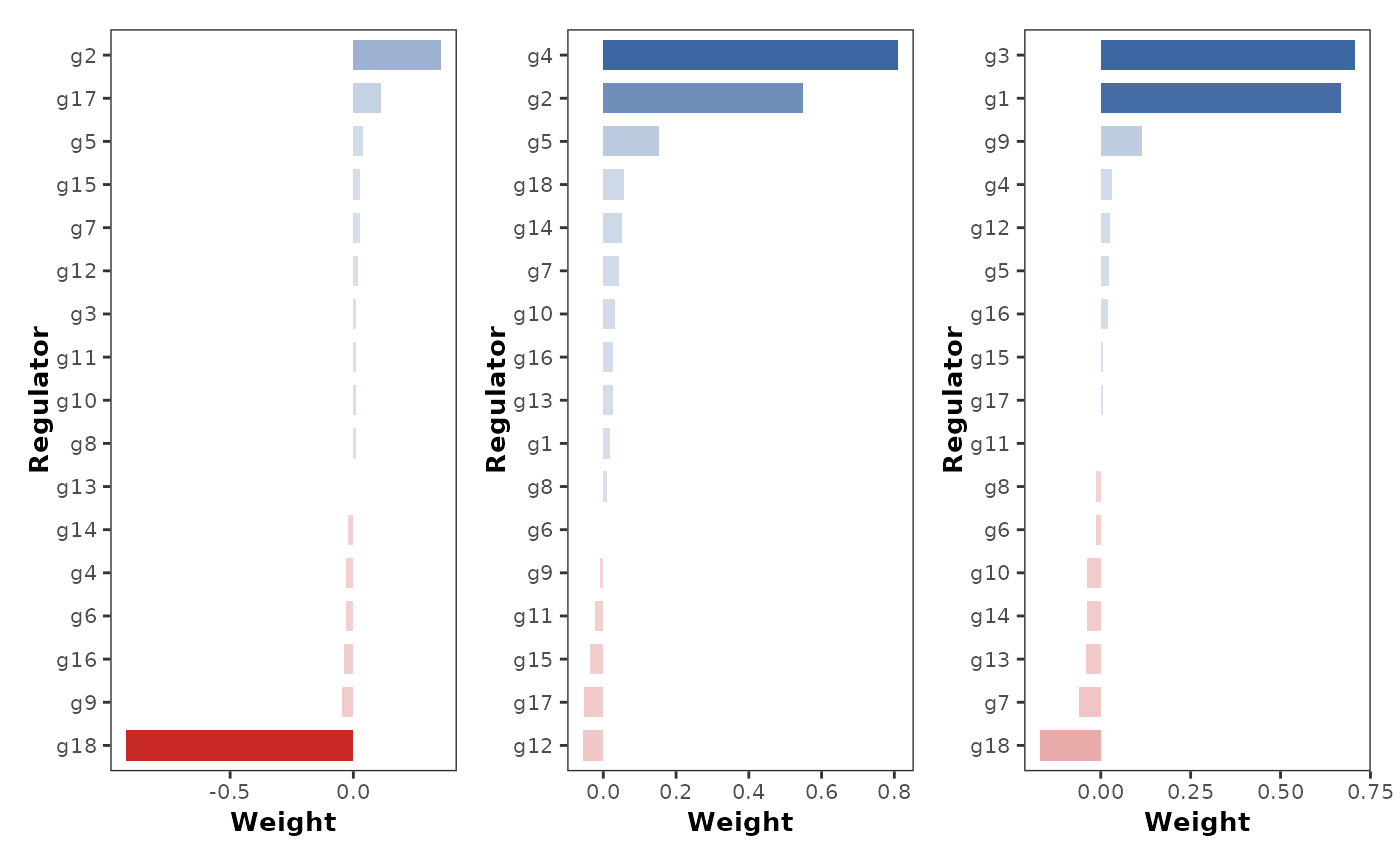
Plot coefficients for multiple targets
plot_coefficients(data, targets = NULL, nrow = NULL, ...)Arguments
- data
Input data.
- targets
Targets to plot.
- nrow
Number of rows for the plot.
- ...
Other arguments passed to
plot_coefficient.
Value
A list of ggplot objects
Examples
data("example_matrix")
network_table <- inferCSN(
  example_matrix,
  targets = c("g1", "g2", "g3")
)
#> ℹ [2025-07-28 09:33:21] Running for <dense matrix>.
#> ℹ [2025-07-28 09:33:21] Checking input parameters.
#> ℹ [2025-07-28 09:33:21] Using 3 target(s).
#> ℹ [2025-07-28 09:33:21] Using L0 sparse regression model.
#> ℹ [2025-07-28 09:33:21] Using 1 core
#> ⠙ [2025-07-28 09:33:21] Running [1/3] ETA:  0s
#> ✔ [2025-07-28 09:33:21] Completed 3 tasks in 51ms
#>
#> ℹ [2025-07-28 09:33:21] Building results
#> ✔ [2025-07-28 09:33:21] Run done.
plot_coefficients(network_table, show_values = FALSE)

plot_coefficients(network_table, targets = "g1")
