density_points
density_points(
  meta_data,
  cluster_list = NULL,
  method = "combine",
  celltype_by = NULL,
  group_column = "cluster",
  pseudotime_column = "pseudotime",
  min_cells = 100,
  plot = FALSE,
  key_word = "network_",
  key_sign = "..",
  file_save = NULL,
  color_list = c("#0066ff", "#0099ff", "#66cc33", "#66ff33", "#ccff00", "#ffff99",
    "#ffff33", "#ffcc33", "#ff9933", "#ff6633", "#cc3300", "#ff3333")
)
Arguments
Value
points
Examples
test_data <- rbind(
data.frame(
cluster = "cluster1",
pseudotime = rnorm(500, mean = 1, sd = 1)
),
data.frame(
cluster = "cluster2",
pseudotime = rnorm(500, mean = 2, sd = 2)
),
data.frame(
cluster = "cluster3",
pseudotime = rnorm(500, mean = 3, sd = 3)
)
)
density_points(
meta_data = test_data,
plot = TRUE
)
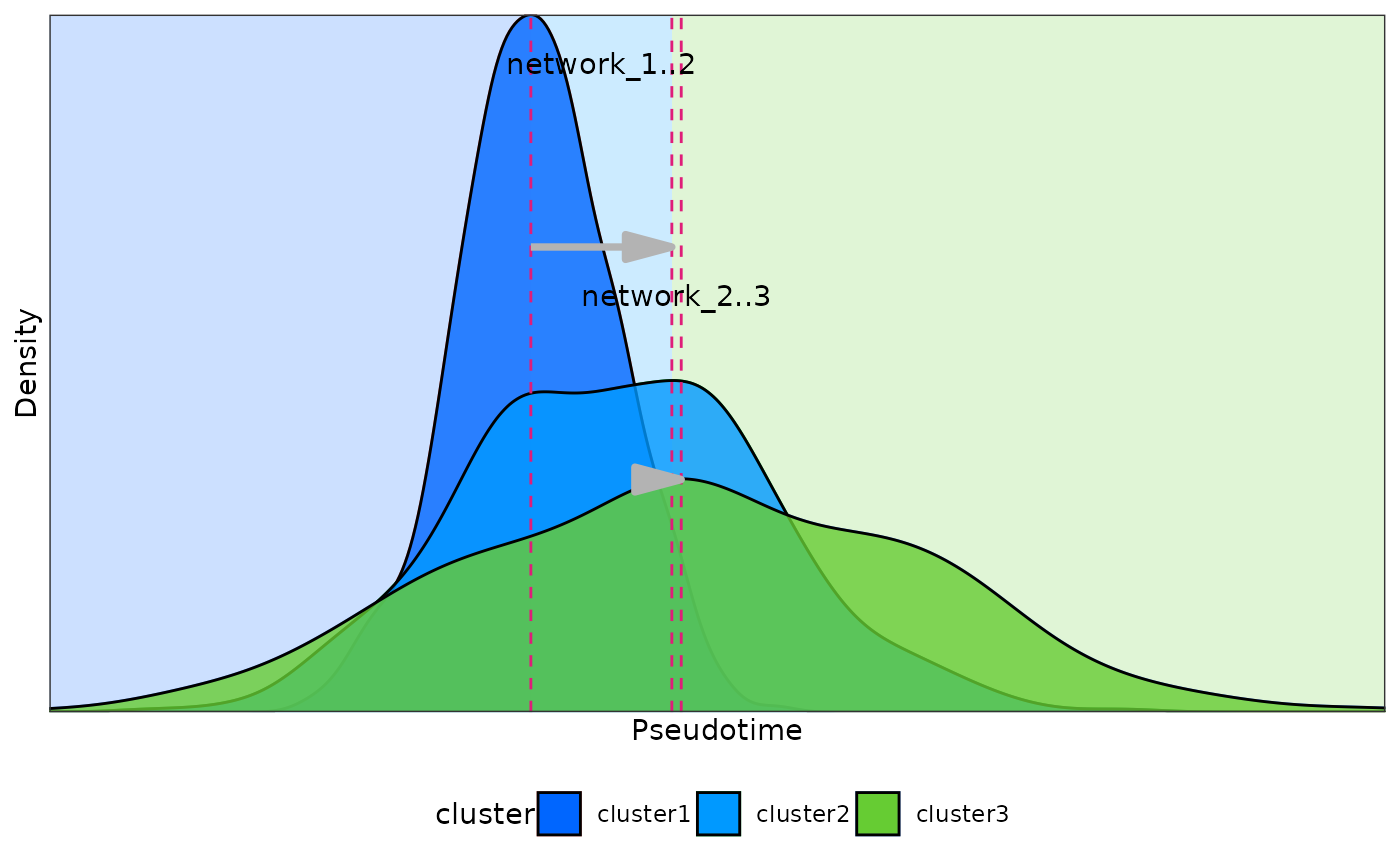 #> window cluster1 cluster2 time_point1 time_point2
#> 1 network_1 cluster1 cluster3 0.9253374 2.238531
#> 2 network_2 cluster3 cluster2 2.2385311 2.446525
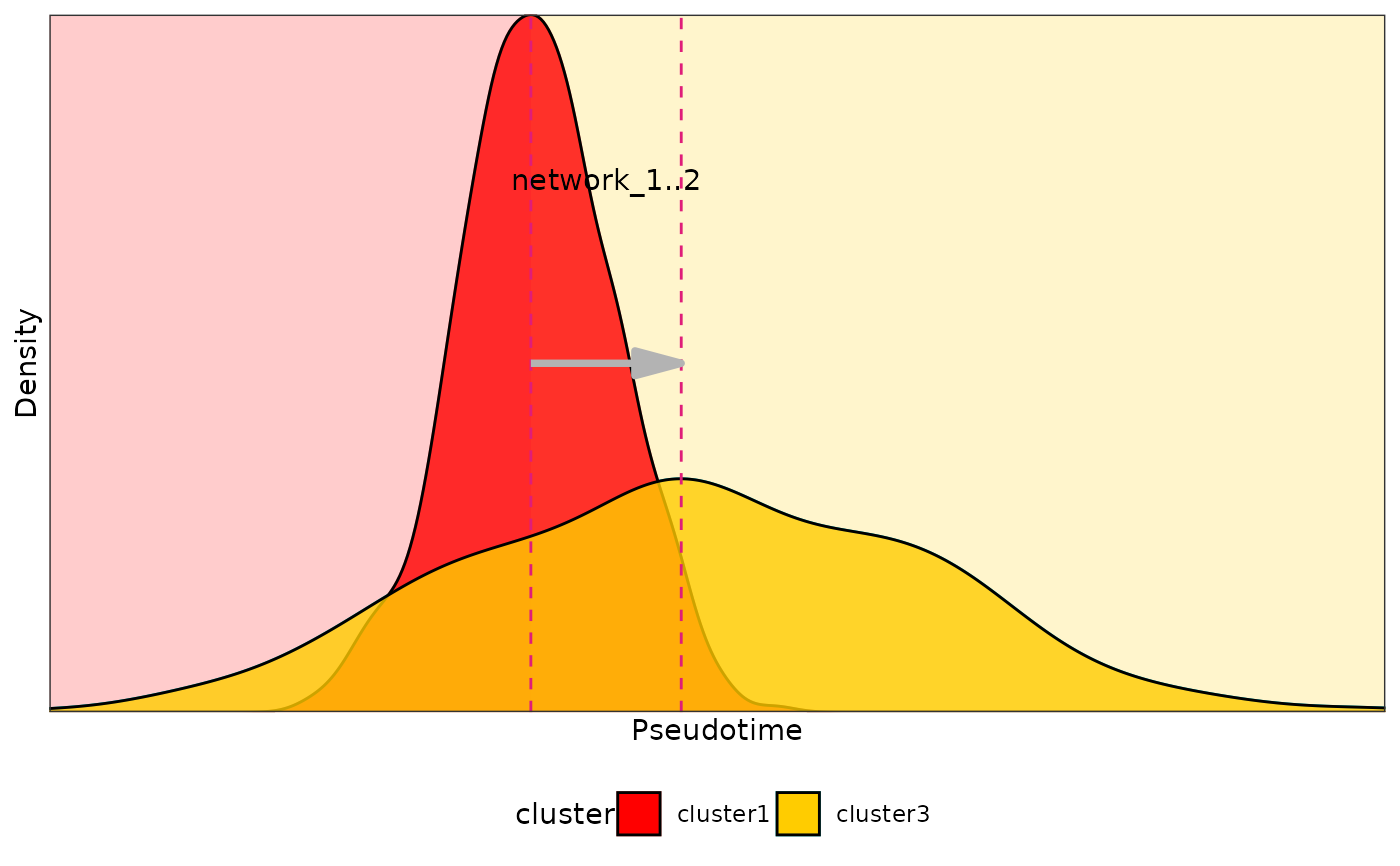
density_points(
meta_data = test_data,
cluster_list = list(c("cluster1", "cluster3")),
plot = TRUE,
color_list = c("#ff0000", "#ffcc00")
)
#> window cluster1 cluster2 time_point1 time_point2
#> 1 network_1 cluster1 cluster3 0.9253374 2.238531
#> 2 network_2 cluster3 cluster2 2.2385311 2.446525
density_points(
meta_data = test_data,
cluster_list = list(c("cluster1", "cluster3")),
plot = TRUE,
color_list = c("#ff0000", "#ffcc00")
)
 #> window cluster1 cluster2 time_point1 time_point2
#> 1 network_1 cluster1 cluster3 0.9253374 2.238531
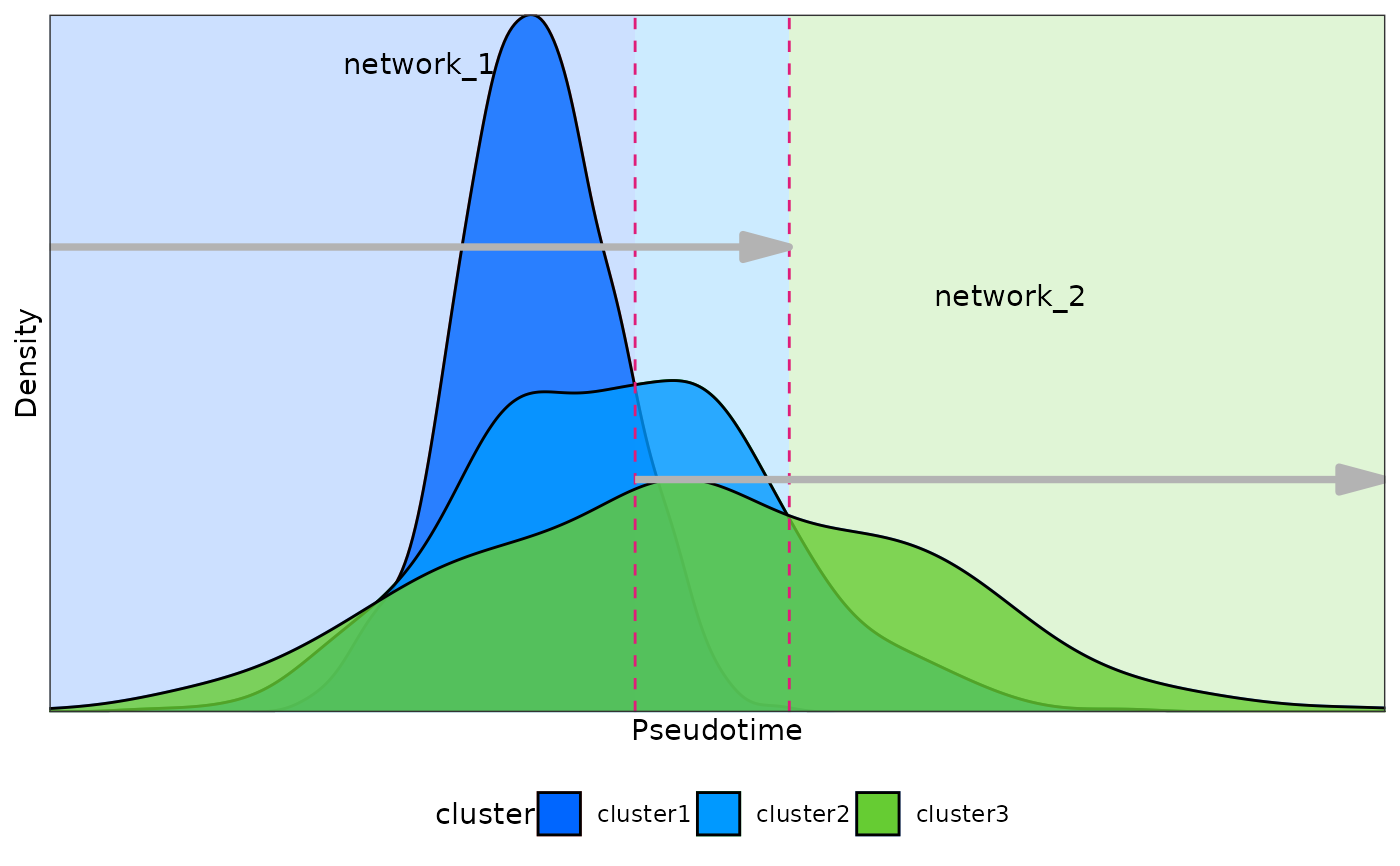
density_points(
meta_data = test_data,
method = "intersection",
plot = TRUE
)
#> window cluster1 cluster2 time_point1 time_point2
#> 1 network_1 cluster1 cluster3 0.9253374 2.238531
density_points(
meta_data = test_data,
method = "intersection",
plot = TRUE
)
 #> window cluster1 cluster2 time_point1 time_point2
#> 1 network_1 cluster1 cluster2 -5.847251 -1.152391
#> 2 network_2 cluster1 cluster2 2.582157 12.327548
#> window cluster1 cluster2 time_point1 time_point2
#> 1 network_1 cluster1 cluster2 -5.847251 -1.152391
#> 2 network_2 cluster1 cluster2 2.582157 12.327548