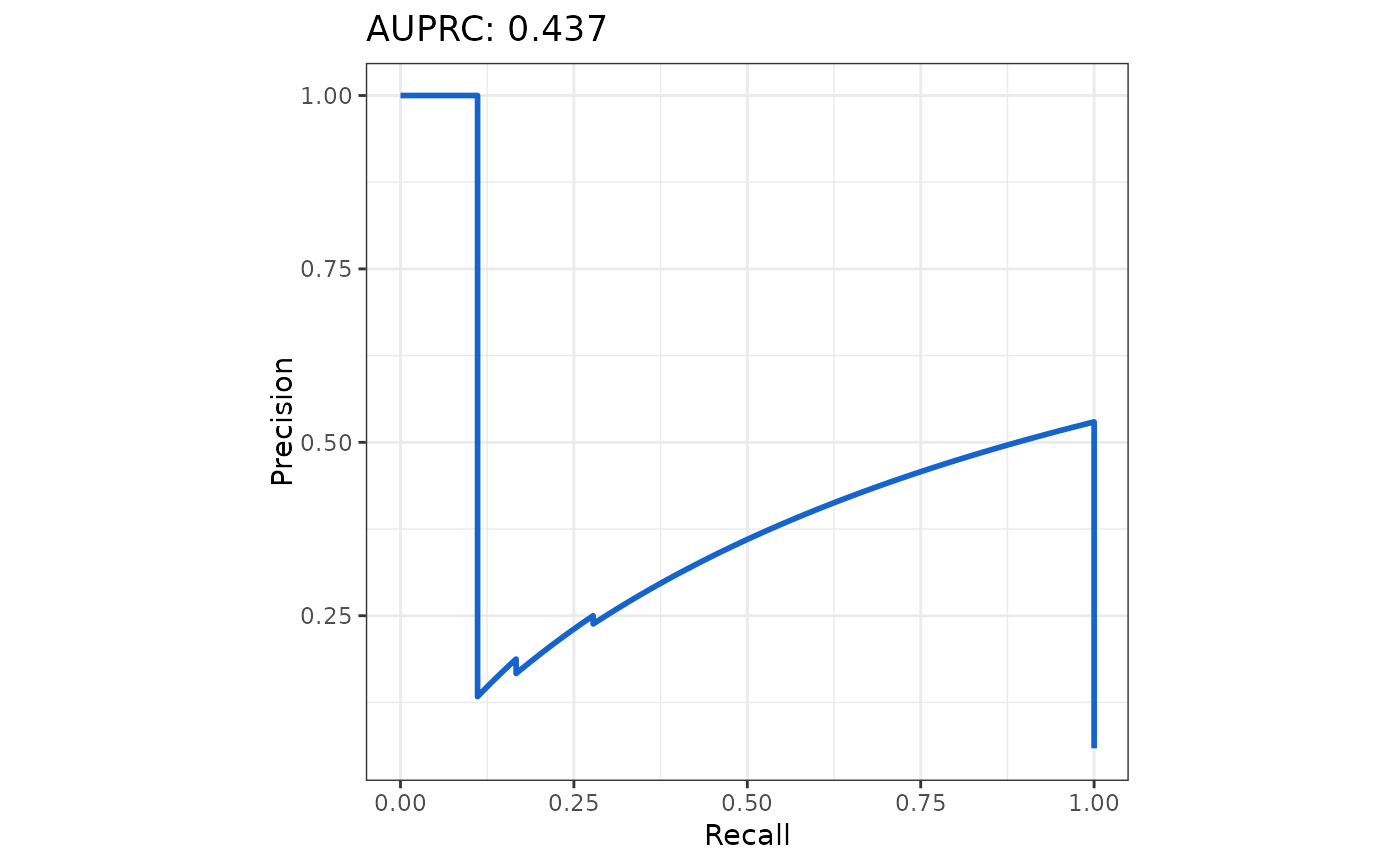
Calculates AUPRC metric with optional visualization
calculate_auprc(
  network_table,
  ground_truth,
  return_plot = FALSE,
  line_color = "#1563cc",
  line_width = 1
)
Arguments
Value
A list containing metric and optional plot
Examples
data("example_matrix")
data("example_ground_truth")
network_table <- inferCSN(example_matrix)
#> ℹ [2025-07-28 09:32:49] Running for <dense matrix>.
#> ℹ [2025-07-28 09:32:49] Checking input parameters.
#> ℹ [2025-07-28 09:32:49] Using L0 sparse regression model.
#> ℹ [2025-07-28 09:32:49] Using 1 core
#> ℹ [2025-07-28 09:32:50] Building results
#> ✔ [2025-07-28 09:32:50] Run done.
calculate_auprc(
  network_table,
  example_ground_truth,
  return_plot = TRUE
)
#> $metrics
#>   Metric Value
#> 1  AUPRC 0.437
#>
#> $plot

#>
#>