Calculates AUROC and AUPRC metrics with optional visualization
calculate_auc(
  network_table,
  ground_truth,
  return_plot = FALSE,
  line_color = "#1563cc",
  line_width = 1,
  tag_levels = "A"
)
Arguments
Value
A list containing metrics and optional plots
Examples
data("example_matrix")
data("example_ground_truth")
network_table <- inferCSN(example_matrix)
#> ℹ [2025-07-28 09:32:49] Running for <dense matrix>.
#> ℹ [2025-07-28 09:32:49] Checking input parameters.
#> ℹ [2025-07-28 09:32:49] Using L0 sparse regression model.
#> ℹ [2025-07-28 09:32:49] Using 1 core
#> ⠙ [2025-07-28 09:32:49] Running [1/18] ETA: 1s
#> ✔ [2025-07-28 09:32:49] Completed 18 tasks in 227ms
#>
#> ℹ [2025-07-28 09:32:49] Building results
#> ✔ [2025-07-28 09:32:49] Run done.
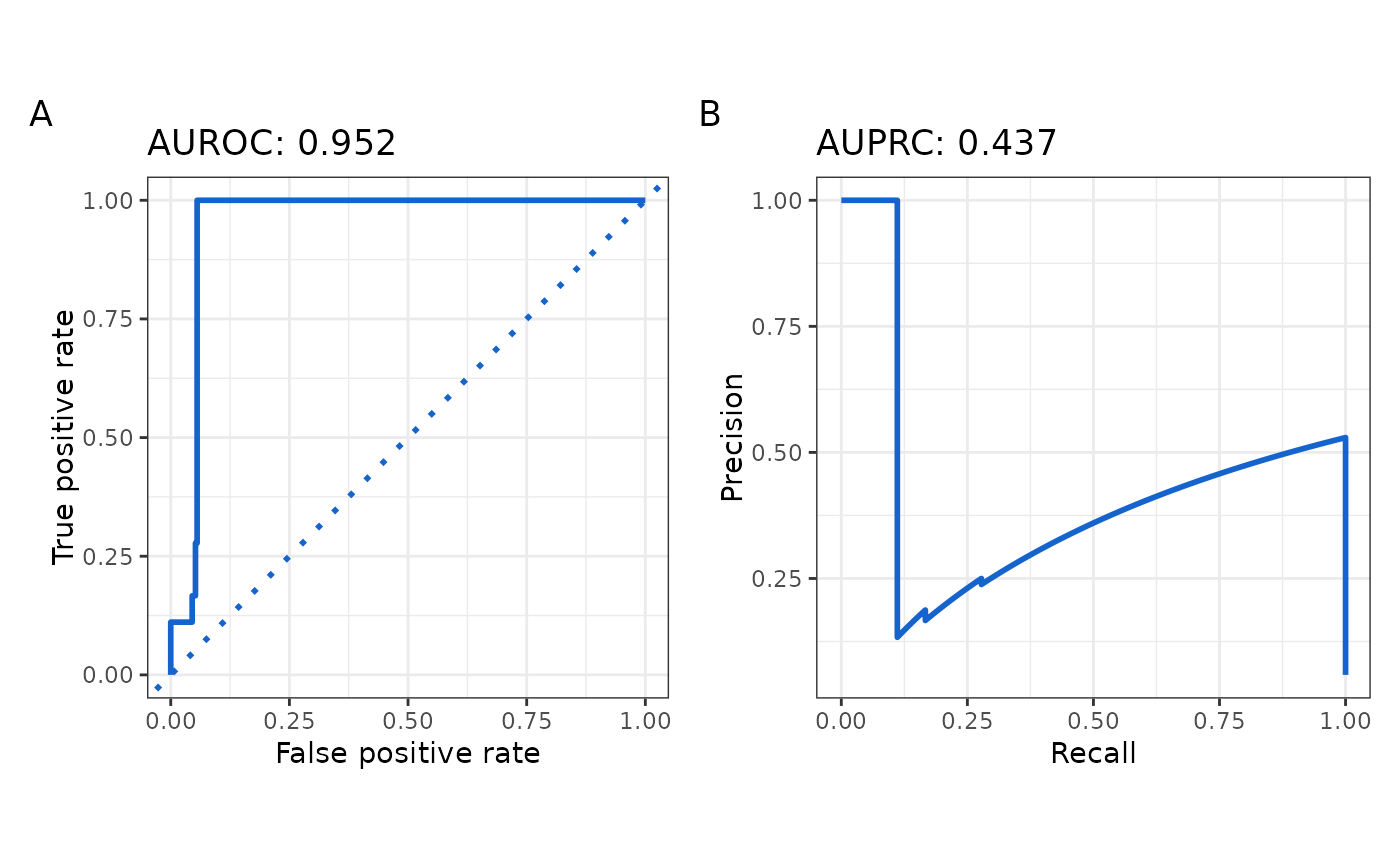
calculate_auc(
network_table,
example_ground_truth,
return_plot = TRUE
)
#> $metrics
#> Metric Value
#> 1 AUROC 0.952
#> 2 AUPRC 0.437
#>
#> $plot
 #>
#>