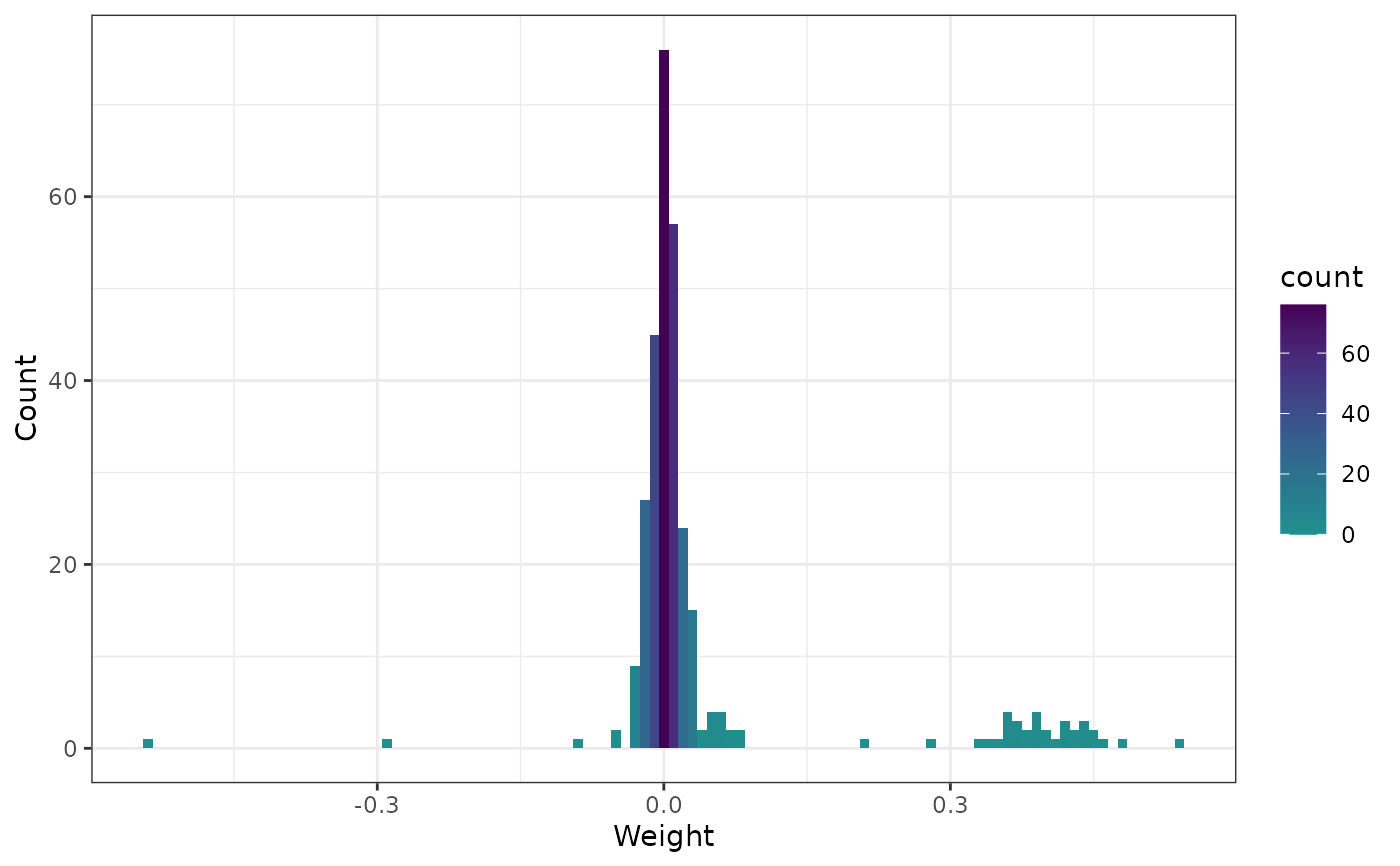
Plot weight distribution
plot_weight_distribution(
  network_table,
  binwidth = 0.01,
  show_border = FALSE,
  border_color = "black",
  alpha = 1,
  theme = "viridis",
  theme_begin = 0,
  theme_end = 0.5,
  theme_direction = -1,
  legend_position = "right"
)
Arguments
- network_table
The weight data table of network.
- binwidth
Width of the bins.
- show_border
Logical value, whether to show border of the bins.
- border_color
Color of the border.
- alpha
Alpha value of the bins.
- theme
Theme of the bins.
- theme_begin
Begin value of the theme.
- theme_end
End value of the theme.
- theme_direction
Direction of the theme.
- legend_position
The position of legend.
Value
ggplot object