Plot network heatmap
Usage
plot_network_heatmap(
  network_table,
  regulators = NULL,
  targets = NULL,
  switch_matrix = TRUE,
  show_names = FALSE,
  heatmap_size_lock = TRUE,
  heatmap_size = 5,
  heatmap_height = NULL,
  heatmap_width = NULL,
  heatmap_title = NULL,
  heatmap_color = c("#1966ad", "white", "#bb141a"),
  border_color = "gray",
  rect_color = NA,
  anno_width = 1,
  anno_height = 1,
  row_anno_type = c("boxplot", "barplot", "histogram", "density", "lines", "points",
    "horizon"),
  column_anno_type = c("boxplot", "barplot", "histogram", "density", "lines", "points"),
  legend_name = "Weight",
  row_title = "Regulators"
)
Arguments
- network_table
The weight data table of network.
- regulators
Regulators list.
- targets
Targets list.
- switch_matrix
Whether to weight data table to matrix. Default is
TRUE.- show_names
Whether to show names of row and column. Default is
FALSE.- heatmap_size_lock
Lock the size of heatmap.
- heatmap_size
The size of heatmap. Default is
5.- heatmap_height
The height of heatmap.
- heatmap_width
The width of heatmap.
- heatmap_title
The title of heatmap.
- heatmap_color
Colors of heatmap.
- border_color
Default is
"gray". Color of heatmap border.- rect_color
Default is
NA. Color of heatmap rect.- anno_width
Width of annotation.
- anno_height
Height of annotation.
- row_anno_type
Default is
"boxplot", could add a annotation plot to row. choose one of"boxplot","barplot","histogram","density","lines","points", and"horizon".- column_anno_type
Default is
"boxplot", could add a annotation plot to column. choose one of"boxplot","barplot","histogram","density","lines", and"points".- legend_name
The name of legend.
- row_title
The title of row.
Examples
data(example_matrix)
data("example_ground_truth")
network_table <- inferCSN(example_matrix)
#> ℹ [2026-01-23 02:16:07] Inferring network for <matrix/array>...
#> ◌ [2026-01-23 02:16:07] Checking parameters...
#> ℹ [2026-01-23 02:16:07] Using L0 sparse regression model
#> ℹ [2026-01-23 02:16:07] Using 1 core
#> ℹ [2026-01-23 02:16:07] Building results
#> ✔ [2026-01-23 02:16:07] Inferring network done
#> ℹ [2026-01-23 02:16:07] Network information:
#> ℹ Edges Regulators Targets
#> ℹ 1 306 18 18
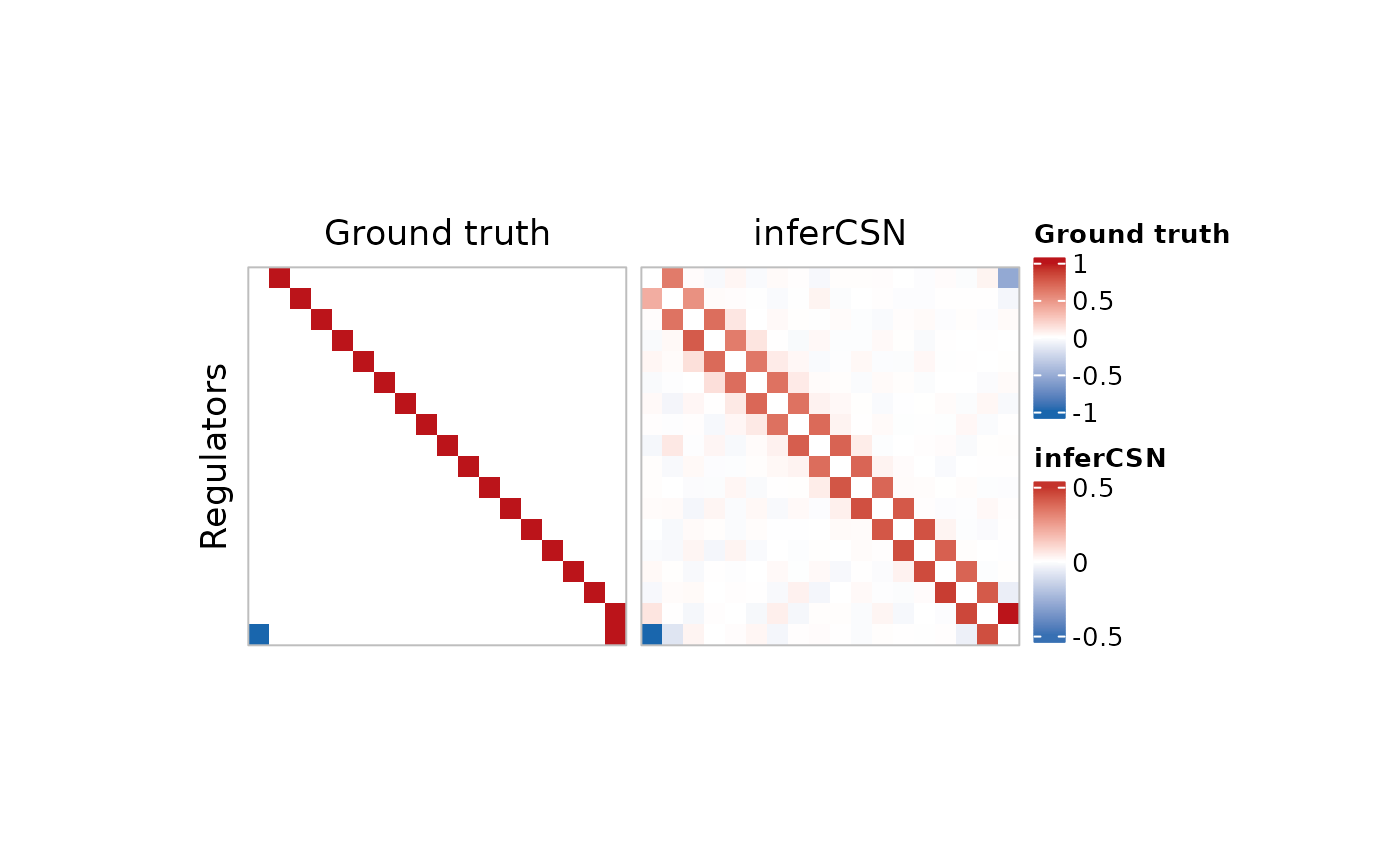
p1 <- plot_network_heatmap(
example_ground_truth[, 1:3],
heatmap_title = "Ground truth",
legend_name = "Ground truth"
)
p2 <- plot_network_heatmap(
network_table,
heatmap_title = "inferCSN",
legend_name = "inferCSN"
)
ComplexHeatmap::draw(p1 + p2)
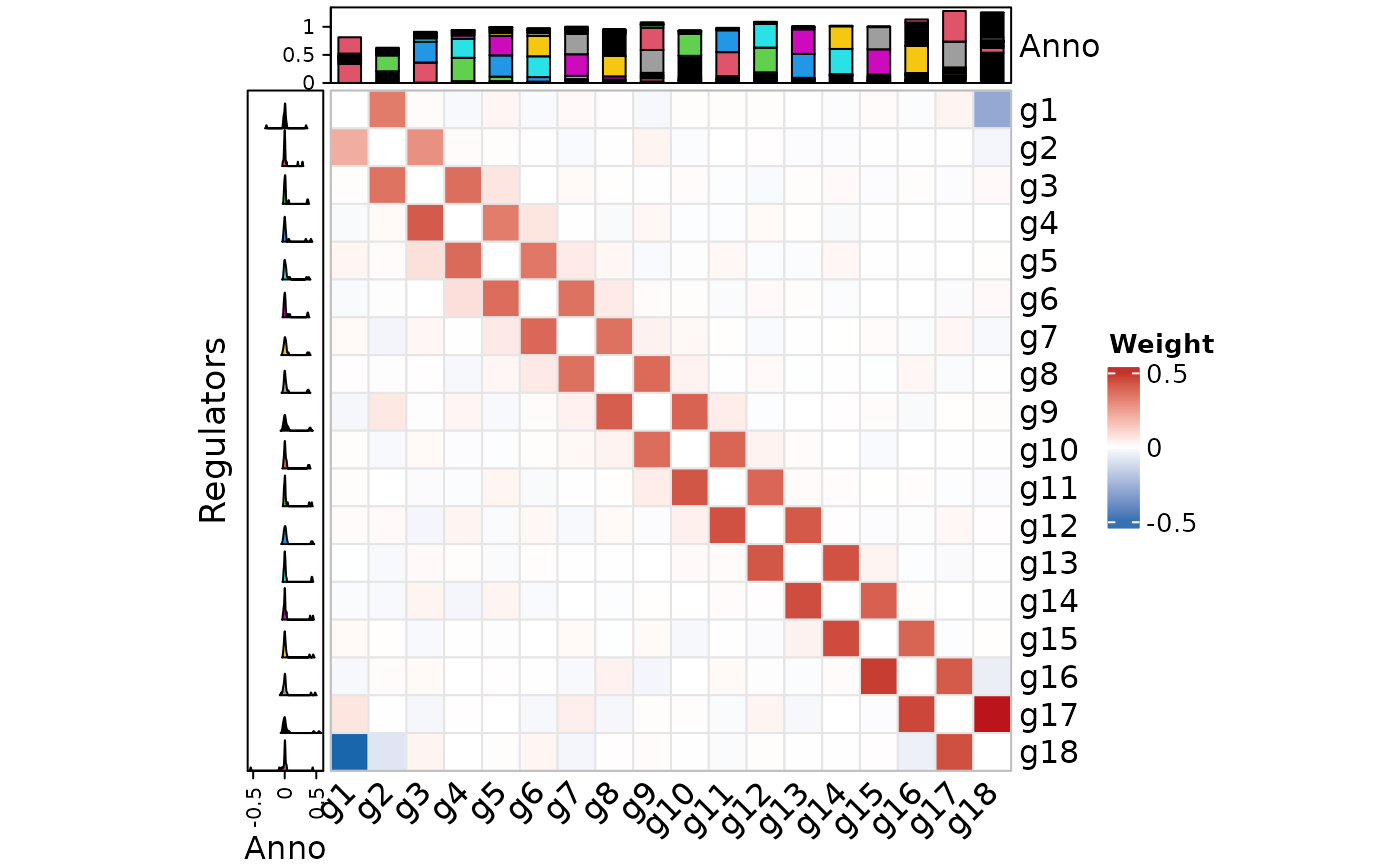
 plot_network_heatmap(
network_table,
show_names = TRUE,
rect_color = "gray90",
row_anno_type = "density",
column_anno_type = "barplot"
)
plot_network_heatmap(
network_table,
show_names = TRUE,
rect_color = "gray90",
row_anno_type = "density",
column_anno_type = "barplot"
)
 plot_network_heatmap(
network_table,
regulators = c("g1", "g3", "g5"),
targets = c("g3", "g6", "g9"),
show_names = TRUE
)
plot_network_heatmap(
network_table,
regulators = c("g1", "g3", "g5"),
targets = c("g3", "g6", "g9"),
show_names = TRUE
)